BASELINE ASSESSMENT OF TSUNAMI
AFFECTED VILLAGES
TAMBON KAMPUAN, SUK SAMRAN DISTRICT, RANONG
PROVINCE, THAILAND
P
REPARED BYR
ICHARDB.
P
OLLNACD
AWNK
OTOWICZJ
ULY2006
THAILAND POST-TSUNAMI SUSTAINABLE COASTAL
LIVELIHOODS PROGRAM
A
P
ROGRAM OF THEL
EADER WITHA
SSOCIATESC
OOPERATIVEA
GREEMENT ONS
USTAINABLEC
OASTALC
OMMUNITIES ANDE
COSYSTEMS(SUCCESS)
I
MPLEMENTED BY THEC
OASTALR
ESOURCESC
ENTER,
U
NIVERSITY OFR
HODEI
SLAND INPARTNERSHIP WITH THE
A
SIANI
NSTITUTE OFT
ECHNOLOGY AND THEU
NIVERSITY OFH
AWAIIFunded by:
Regional Development Mission/Asia U.S. Agency for International Development
Table of Contents
Executive Summary vii
1. Introduction 1
1.1 Project Background. 1
1.2 Purpose of the baseline and methods used. 1
2. Tsunami Impacts on Residents. 2
2.1 Introduction 2
2.2 Injury and Death 2
2.3 Locations and Experiences of Residents During the Tsunami 4 3. Impacts of the Tsunami on Possessions and Productive Materials 5
3.1 Introduction 5
3.2 Impacts on Possessions and Productive Materials 5
3.3 Conclusions 7
4. Current Occupations 8
4.1 Introduction 8
4.2 Current occupations 8
4.3 Conclusions 10
5. Distribution of Labor by Age and Gender 10
5.1 Introduction 10
5.2 Family participation in occupations 11
5.3 Conclusions 13
6. The Capture Fishery 14
6.1 Introduction 14
6.2 Descriptions of fishing gear 14
6.3 Distribution of gear types 19
6.4 Conclusions 24
7. Current Socioeconomic Conditions 25
7.1 Village infrastructure and population 25
7.2 Other socioeconomic indicators 26
7.3 Material style of life 27
7.4 Conclusions 28
8. Perceptions of Changes in Well-being 29
8.1 Introduction 29
8.2 Inter-village variation in perceptions of changes in well-being 29 8.3 Predictors of variation in perceptions of changes in well-being 30
8.4 Conclusions 31
9. Attitudes Towards the Occupation of Fishing 33
9.1 Introduction 33
9.2 Attitudes toward fishing 33
9.3 Alternatives to fishing 34
9.4 Predictors of variability in attitudes toward fishing 35
9.5 Conclusions 36
10. Perceptions of Coastal Resources and Factors Related to Their Management 39
10.1 Introduction 39
10.2 Inter-village variation in perceptions of the environment and management. 39 10.3 Predictors of variability in perceptions of the environment and management 41
10.4 Conclusions 43
11. Investment Orientations 45
11.1 Introduction 45
11.2 Inter-village variation in investment orientations 45
11.3 Predictors of variability in investment orientations 47
11.4 Conclusions 48
12. Perceptions of and Participation in Tsunami Recovery Activities 50
12.1 Introduction 50
12.2 Current activities 50
12.3 Proposed activities 51
12.4 Predictors of variability in project activities knowledge and participation 51
12.5 Conclusions 53
13. Summary and Recommendations 55
Tables
Table 1. Percent respondents injured by tsunam1. 2
Table 2. Percent distribution of number of household members injured
by the tsunami. 2
Table 3. Percent distribution of number of household members killed
by the tsunami. 2
Table 4. Percent distribution of number of relatives injured by the tsunami. 3 Table 5. Percent distribution of number of relatives killed by the tsunami. 3 Table 6. Percent distribution of number of friends injured by the tsunami. . 3 Table 7. Percent distribution of number of friends killed by the tsunami. . 3 Table 8. Analysis of variance of tsunami impacts on household members,
relatives and friends. 3
Table 9. Percent distribution of location of respondents during the tsunami. 4 Table 10. Percent distribution of respondent’s experiences during the tsunami. 4 Table 11. Damage to boats, engines, gear, house, and household items
grouped by village. 5
Table 12. Damage to houses and household items. 6
Table 13. Tsunami Impacts on Non-Fishing Occupations by Village. 6
Table 14. Cumulative impacts. 7
Table 15. Percent distribution of Village 1 Occupations by rank. 8 Table 16. Percent distribution of Village 2 Occupations by rank. 9 Table 17. Percent distribution of Village 3 occupations by rank. 9 Table 18. Percent distribution of Village 4 occupations by rank. 9 Table 19. Percent distribution of Village 7 occupations by rank 10
Table 20. Family Participation by Occupation in Village 1. 11
Table 21. Family Participation by Occupation in Village 2 11
Table 22. Family Participation by Occupation for Village 3 12
Table 23. Family Participation by Occupation for Village 4 12
Table 24. Family Participation by Occupation for Village 7 13
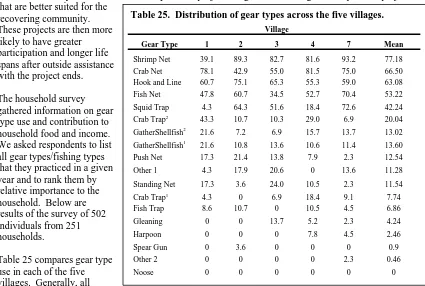
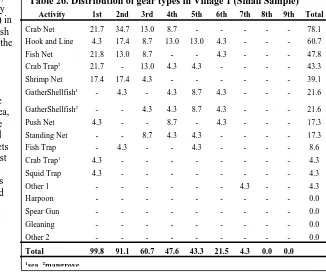
Table 25. Distribution of gear types across the five villages. 19 Table 26. Distribution of gear types in Village 1 (Small Sample). 20
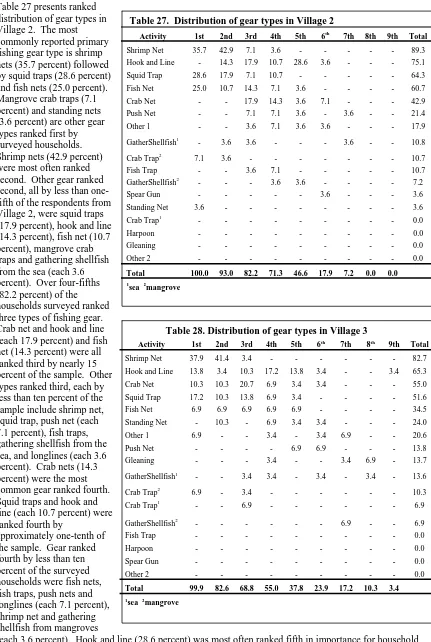
Table 27. Distribution of gear types in Village 2. 21
Table 28. Distribution of gear types in Village 3. 21
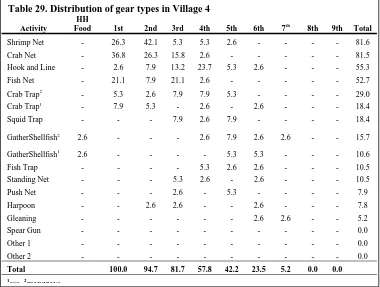
Table 29. Distribution of gear types in Village 4. 22
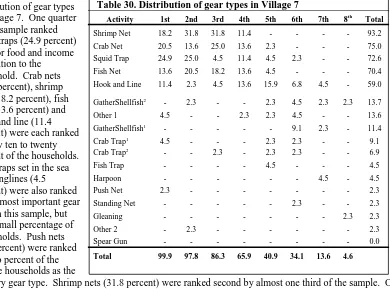
Table 30. Distribution of gear types in Village 7. 23
Table 31. Village infrastructure. 25
Table 32. Distribution of village populations 2005. 26
Table 33. Analyses of community differences in age, education, religion,
exposure to media and travel. 26
Table 34. Principal component analysis of material style of life items. 27 Table 35. Principal component analysis of household construction attributes. 27 Table 36. Analysis of variance of community differences in MSL
and HHC component scores. 28
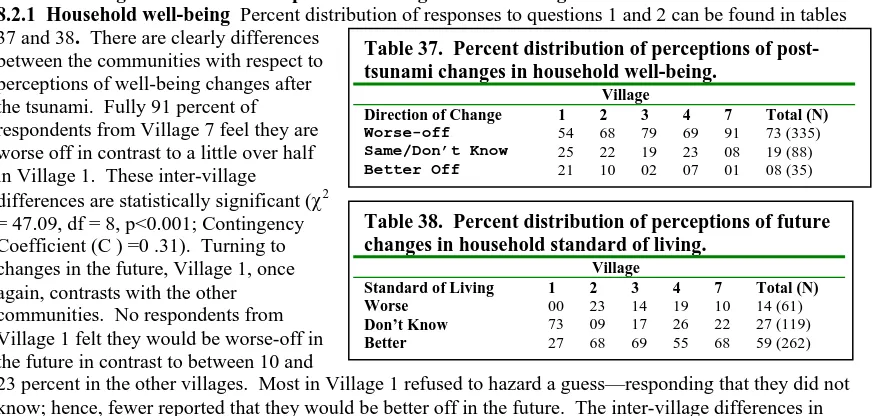
Table 37. Percent distribution of perceptions of post-tsunami changes in
household well-being. 29
Table 38. Percent distribution of perceptions of future changes in household
standard of living. 29
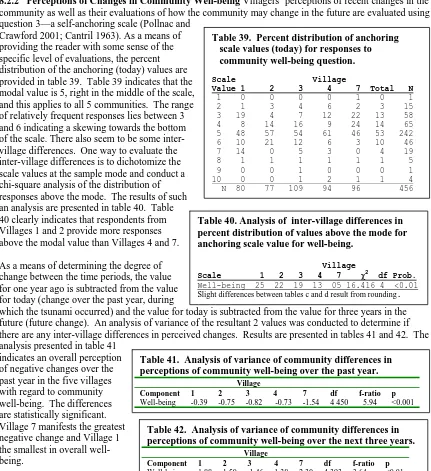
Table 39. Percent distribution of anchoring scale values (today) for responses
to community well-being question. 30
Table 40. Analysis of inter-village differences in percent distribution of values
above the mode for anchoring scale value for well-being. 30
Table 41. Analysis of variance of community differences in perceptions of
community well-being over the past year. 30
Table 42. Analysis of variance of community differences in perceptions of
Tables (continued
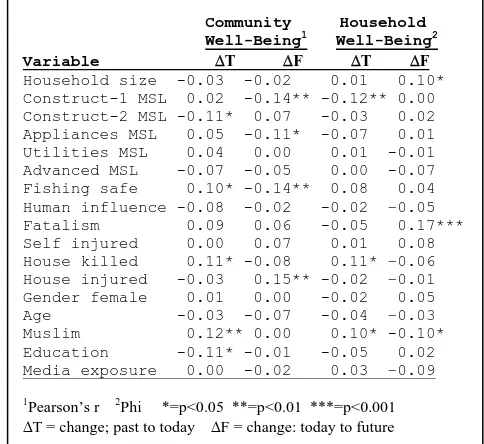
)Table 43. Correlations of independent variables with perceptions
of well-being changes. 31
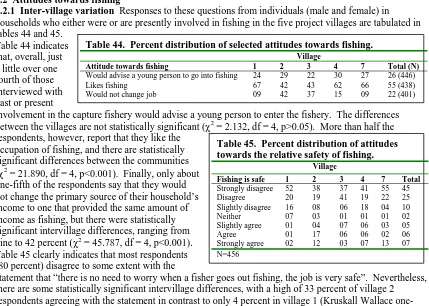
Table 44. Percent distribution of selected attitudes towards fishing. 33 Table 45. Percent distribution of attitudes towards the relative safety of fishing. 33 Table 46. Percent distribution of selected attitudes towards fishing among
males in households where fishing is of primary importance. 34 Table 47. Percent distribution of selected attitudes towards fishing among
males in households where fishing is of primary or secondary importance. 34 Table 48. Percent distribution of attitudes towards the relative safety of fishing among males in households where fishing is of primary importance. 34 Table 49. Preferred occupation if household members could no longer fish. 34 Table 50. Percent distribution of preferred occupation by males in households where fishing is of primary importance if household members could
no longer fish. 35
Table 51. Percent distribution of preferred occupation by males in households where fishing is of primary or secondary importance if household members
could no longer fish. 35
Table 52. Correlations (phi) between attitudes towards fishing
and independent variables. 36
Table 53. Percent distribution of responses to statement Human activities
do not influence the number of fish in the ocean. 40 Table 54. Percent distribution of responses to statement There is no point in
planning for the future, what happens, happens and we cannot do
anything about it. 40
Table 55. Percent distribution of anchoring scale values (today) for responses
to empowerment (control over resources) question. 40
Table 56. Percent distribution of anchoring scale values (today) for responses to
resource health question. 40
Table 57. Percent distribution of anchoring scale values (today) for responses to
compliance question. 40
Table 58 Analysis of inter-village differences in percent distribution of values
above the mode for anchoring scale values. 41
Table 59. Analysis of variance of inter-village differences in mean values
for perceived change. 41
Table 60. Correlations (phi) between perceptions and the independent variables. 42 Table 61. Correlations of independent variables with perceptions of post-tsunami
changes. 42
Table 62. Correlations of independent variables with perceptions of future
changes. 42
Table 63. Percent distribution of investment orientations (9000B) across
the five villages (1st response). 45
Table 64. Percent distribution of investment orientations (110,000B) across
the five villages (1st response). 46
Table 65. Percent distribution of investment orientations (110,000B) across
the five villages (2nd response). 46
Table 66. Percent distribution of investment orientations (both questions)
across the five villages (all responses). 47
Table 67. Correlations (phi) between investment orientations and selected
independent variables. 48
Table 68. Frequency distribution of tsunami recovery activities mentioned
by sample. 50
Tables (continued)
Table 71. Frequency distribution of evaluation of and willingness to participate
in proposed groups. 51
Table 72. Frequency distribution of evaluation of and willingness to participate
in proposed activities 51
Table 73. Correlations of independent variables with total activities
mentioned, participation and proposed participation. 52
Table 74. Stepwise regression analyses of multiple predictors of
project awareness. 52
Table 75. Stepwise regression analyses of multiple predictors of project participation in proposed activities. Dependent variable: Participation in
proposed activities. 53
Table 76. Stepwise regression analyses of multiple predictors of project
Figures
Figure 1. Hand line hooks and reel. 15
Figure 2. Bycatch in a tangle net. 16
Figure 3. Rectangular crab trap. 16
Figure 4. Cylindrical crab trap. 17
Figure 5. Collapsed cylindrical crab trap. 17
Figure 6. Garlands on crab boats. 17
Figure 7. Squid traps. 18
Figure 8. Small shrimp push net. 18
Figure 9. Fish trap. 18
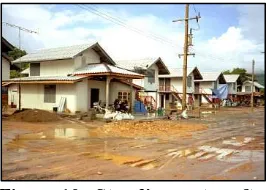
Figure 10. Standing water after a rain storm in Village 7. 25
Figure 11. Percent distribution of perceptions of human influence on
number of fish. 43
Appendices
Appendix 9A. Detailed breakdown of occupations mentioned as alternatives
to fishing if fishing could no longer be practiced. 38
Appendix 12A. Frequency distribution of known recovery activities. 54
EXECUTIVE SUMMARY OF BASELINEASSESSMENTOFTSUNAMIAFFECTEDVILLAGES
TAMBONKAMPHUAN,SUKSAMRANDISTRICT,RANONGPROVINCE,THAILAND
The purpose of a baseline is to establish a standard which can be used to evaluate changes that take place in the area of concern. In the present case it is performed before project activities in an attempt to determine project impacts. The baseline can also be used to assist in the design of these activities. To achieve this latter objective, aspects of the data collected during the baseline were analyzed and provided to project personnel in 2005 (e.g., Pollnac 2005).
Methods involved a preliminary assessment of the five project communities to determine information of use in designing and conducting a baseline survey. A map of the five villages is presented below.
Overall, 30 percent of the households in the five villages are included in the sample. One male and one female adult were interviewed in each household resulting in a total sample size of 502. Questions in the baseline survey included: 1) background on the interviewee (e.g., age, religion, gender, education), 2) the individual’s household (e.g., material possessions, sources of income, household size), 3) impacts of the tsunami on humans, household material wealth, and occupation, and 4) individuals’ perceptions of well-being, beliefs concerning the environment, attitudes towards the occupation of fishing, perceptions of changes over time and perceptions of ongoing and planned recovery activities (see interview form in Appendix I).
The tsunami had extensive impacts in the five project villages. Overall, 16 percent of respondents to the survey report injury by the tsunami. Twenty percent of the respondents report some household members injured and 13 percent report household members killed. Fully 37 percent report relatives injured and over one-half (54 percent) report relatives killed. Finally over half of the respondents to the survey report friends injured and killed (53 and 59 percent respectively). Except for number of household members injured, there is a great deal of variation between the five villages as detailed in the following report. For example, Village 1 has the highest mean number of household members and non-household relatives killed, and respondents from Village 3 report the highest mean number of non-household kin injured and friends killed and injured.
The tsunami also wrought damage and destruction to the villagers’ material possessions. Damage to houses varied greatly between villages, ranging from under 10 percent (Villages 4 and 3) to over fifty percent (Village 7). Household impacts represent investment and savings over a relatively long time period because most people in this area move into a house after they marry and remain there for the rest of their lives while continually adding to their initial investment. Many of the families gradually built or improved their houses overtime as they accrued savings. Those households that lost houses also lost most of the contents within and, therefore, must start over again, saving for improving their houses and acquiring items.
Occupational impacts are also significant. For example, if a household loses its boat and fishing gear, it must first save enough money to invest in these things again in order to resume fishing. Many occupations practiced in this area provide food in addition to income; people practicing these occupations are hurt both in terms of monetary income and food. Other occupations were impacted because productive materials were literally washed away by the water that inundated the villages.
How have these impacts influenced villagers’ perceptions of well-being? The survey clearly indicates that there are differences between the villages with respect to perceptions of changes in household well-being following the tsunami. Almost all respondents from Village 7 feel they are worse off in contrast to a little over half in Village 1. With respect to perceptions of community well-being, respondents from Villages 1 and 2 provide more positive responses than Villages 4 and 7. Analyses of perceived community level changes since the tsunami indicates an overall perception of negative changes in the five villages with regard to community well-being, with statistically significant inter-community differences. Village 7 manifests the greatest negative change and Village 1 the smallest in overall well-being. With regard to degree of change in the future, Village 7 anticipates the greatest positive change in well-being over the next three years and Village 4, the least. Overall, the findings display a remarkable resilience in response to this great natural disaster. Highly impacted villages like Village 7 project the most positive future changes. This observation is supported by the fact that on the individual level, those who perceive the most negative post-tsunami changes tend to predict the most positive future changes.
Since the livelihoods of most of the households in the five villages depend on resource extraction (fishing), sustainability of these resources should be an important consideration in recovery. Hence, it is important to understand villagers’ perceptions of the environment and environmental management. The analysis of predictors of variability in perceptions of the environment suggest that older individuals, those with less education, those who were injured by the tsunami and those with a lower level of exposure to the mass media will probably require special attention in training programs directed at environmental management since they are more likely to be fatalistic—to feel that planning has no impact on what happens in the future. There is also inter-village variability. A low of 35 percent of the respondents from Village 1 agree with the statement that there is no point in planning for the future, what happens, happens and we cannot do anything about it, in contrast to almost 60 percent of those from Village 2 (table 54). This difference can probably be attributed to the fact that Village 1 is the focus of the most development work and there is internal political conflict within Village 2. Both of these factors can influence perceptions of the impact of planning, indicating that inter-village differences must be accounted for in the development of post-tsunami recovery efforts.
the nature of the problems encountered, or has top-down planning resulted in feelings that they have nothing valuable to contribute to the recovery efforts? If the latter, co-management efforts will have to be structured to change these perceptions which could be dysfunctional in a situation where local participation is necessary and feelings of empowerment an essential ingredient.
A more positive finding, however, is that a large number of respondents from the project villages disagree with the statement that human activities do not influence the number of fish in the ocean. This contrasts with similar data collected in Indonesia in 2002 and Vietnam in 2004 where much smaller proportions of the samples disagreed with this statement. Responses of the Thai villagers indicate a much greater level of environmental awareness, which bodes well for involving villagers in co-management efforts.
Nevertheless, one must note that a little over one-third of the respondents do not believe that human activities have an impact on fish populations. This one-third probably represents villagers who would be less likely to participate in cooperative management and would likely resist attempts to manage the fishery. Clearly there is still a need to develop some sort of educational programs for this segment of the
population. Inter-village differences in these perceptions should inform these programs.
Our examination of occupations indicates that most of the households in these villages were engaged in multiple occupations, both pre- and post-tsunami. About two-thirds of the households in the five village derive income from at least 2 productive activities and about one-third from at least 3. This is an advantage for managers because if residents are accustomed to participating in different types of livelihood options, they are likely to be comfortable learning various types of skills as needed. Therefore, they may be more likely to participate in newly introduced livelihood projects to supplement their current sources of income. One option for rehabilitation is to encourage expansion of current livelihood options (e.g., raising
livestock). This could be a relatively rapid way to increase income for households and will also involve less capital and training because some households already practice this type of livelihood.
It should be kept in mind that the results of the survey indicate that males and females, as well as children, although less frequently, are involved in productive activities. Hence, recovery efforts should include women and children in participatory consultations in order to design projects that will address contributions of the entire household. Women and children should be consulted as to their availability and willingness to participate and learn new skills. It is possible that children’s willingness to participate in projects is different than those of adults, especially since a majority of children in this area have some experience with formal education. This may increase willingness to participate because the children are confident that they can learn new skills but it may decrease likeliness if children tend to want to devote more time to
schooling. Women also may be more likely to participate in different types of projects, especially with respect to working group structure. During the survey it was observed that women tended to work in groups, for example when gleaning the intertidal areas. Men, however, tended to work (especially in the capture fishery) in pairs or threes. Project design should reflect these trends in current working
environments in order to increase their likelihood of success.
Fishing was the most frequent source of livelihood in all of the villages except Village 3, and it also manifested a great deal of multiplicity with regard to specific types of fishing. The survey indicates that overall, households do not rely on only one or two types of fishing, but practice many types for both food and income. For those involved in fishing, between almost half and over two thirds use at least four gear types. At least 40 percent of the households in four out of the five villages use 5 or more gear types. This type of gear multiplicity increases a household’s ability to adapt to changing conditions in a fishery. Therefore, fishing households are more likely to adapt by emphasizing other gear types if one regulation restricts a certain type of gear. Managers, however, should still be conscious that regulating one type of gear is not likely to reduce effort overall but rather, decrease stress on the stocks targeted by that effort. This data also illustrates that many fishing households are deeply involved in fishing, especially as evidenced by the investment required to acquire various gear types.
be attributed solely to the impacts of the tsunami is not clear at this point. The tsunami indicators, as analyzed in this report, did not have a negative impact on either liking the occupation or advising a young person to enter the occupation. Those who lost family members or friends to the tsunami did tend to report that they would leave the occupation for an alternative providing the same income. Nevertheless, personal injury resulting from the tsunami did not have this effect. Further, those with a fatalistic attitude and those who perceived fishing as not dangerous tended to report that they would not leave the occupation. The survey was conducted during the monsoon season when fishing conditions were at their worst, and this may have influenced some of the negative responses. Nevertheless, we observed that as fishers obtained boats and gear, they quickly returned to the sea, frequently braving the heavy swells and crashing waves as they departed the coastal channels and river mouths to ply their traditional occupation.
Clearly the large number of respondents who state they would change to an alternative occupation bodes well for an alternative income program. Nevertheless, given the relatively large percentage of respondents who report that they like fishing (about four-fifths of the males from households where fishing is first or second in importance for income) suggests that as time goes by and memories of the tsunami fade,
fascination with an alternative occupation might wane. What would fishers in the five villages prefer to do if they could no longer fish? Our survey indicates that most would prefer to become a traders or farmers, with only a small percentage mentioning other occupations. Aquaculture, which is often promoted as an alternative livelihood for fishers, is preferred by only one in 25 in our sample. Analyses of investment orientations among all villagers produced similar results. There is, however, inter-village variation with respect to these preferences, which should be considered.
The analyses of job satisfaction among fishers and investment orientations in the villages as a whole can be used to provide tsunami recovery workers some indication of activities perceived as worthy of investment by community members. Inter-village and inter-individual differences in investment orientations are information important in the structuring of credit schemes and complementary training programs to foster investment opportunities in targeted communities. But this information must be used with care—responses to questions do not always reveal realistic behavioral responses—some may see themselves as a successful traders, but do they have the necessary skills and is there a market for the proposed trade?
Trading is used as an example because investment in trading is the most frequently mentioned option in the interviews. It appeared as a first or later response in 37 percent of the interviews (table 66). Responses were often general; e.g., “invest in trading,” “open a shop,” “expand shop.” Only a few were specific; e.g., “trade fish,” “buy drugs for pharmacy,” “open grocery,” “trade fruit.” This suggests that most respondents had not even carefully considered the type of trading they would become involved in. Further, one must ask, how many traders are needed? If more than one third of the respondents open some sort of trading enterprise, would there be enough business to support such a large number of traders? Similar questions could be asked of some of the other alternatives.
The baseline survey also examined aspects of recovery project awareness and participation. These analyses indicate that those most impacted by the tsunami (as evidenced by low material style of life scores, and household members killed or injured), with smaller households, younger, female, educated and exposed to mass media are most aware and most likely to participate in project activities. Since all these variables evidence statistically significant independent effects on project participation, they all should be taken into account when targeting individuals for training and participation (e.g., level of tsunami impact, higher level of education or female, although the combination of the variables would predict greater chances of
success). Efforts should also be made to reach those less likely to participate (older, fatalistic, lower levels of education, and larger households) to convince them of the value of the recovery projects. Valuation of ongoing and proposed projects as well as information provided in previous preliminary baseline reports should also be used to inform project planning.
BASELINEASSESSMENTOFTSUNAMIAFFECTEDVILLAGES
TAMBONKAMPHUAN,SUKSAMRANDISTRICT,RANONGPROVINCE,THAILAND
1. Introduction
1.1 Project Background
The December 26, 2004 Indian Ocean tsunami severely impacted the lives of hundreds of thousands of people in coastal villages throughout the region. The Post-Tsunami Sustainable Coastal Livelihoods
Program was implemented to assist local government coordinate, plan and implement recovery efforts. It
was implemented as a demonstration project in five communities in Ranong Province, south of the
Myanmar border along the Andaman Coast. The five villages are Thale Nok (Village Number1); Nua (No. 2); Kam Phuan (No. 3); Phu Khao Thong (No. 4, also referred to as Ta Klang); and Haad Sai Kao (No. 7, also referred to as Baan Haad Yao).1 Details concerning project background and implementation can be found in the report on the participatory rapid appraisal (PRA) conducted by Soparth, et al. (2005). Additional information on the communities can be found in Pollnac and Kotowicz (2005).
1.2 Purpose of Baseline and methods used
1.2.1 Purpose The purpose of the baseline assessment is to provide a baseline for assessing changes through time in affected villages as impacted by recovery programs and other factors. This will allow those involved in recovery efforts to assess impacts of their recovery activities as well as plan activities based on the information from the baseline assessment.2
1.2.2 Methods Methods involved a preliminary assessment (Pollnac and Kotowicz 2005) to determine information of use in designing and conducting a baseline survey (Pollnac and Crawford 2000). Questions in the baseline survey included: 1) background on the interviewee (e.g., age, religion, gender, education), 2) the individuals household (e.g., material possessions, sources of income, household size), 3) impacts of the tsunami on humans, household material wealth, and occupation, and 4) individuals’ perceptions of well-being, beliefs concerning the environment, attitudes towards the occupation of fishing, perceptions of changes over time and perceptions of ongoing and planned recovery activities (see interview form in Appendix I).
Sample households were selected using systematic sampling in each of five villages (1, 2, 3, 4, 7). Target sample size for each village was fifty households. Sampling was accomplished by determining number of households from official statistics and interviews, then dividing that number by 50 for each village. The resulting number (X) was used to select every Xth household in the village for an interview. In addition, all households that relocated to other locations were identified and included in the sampling procedure to capture the portion of the population that moved as a result of the tsunami. Number of households and percent of total number of houses for each village are as follows: Village 1, 43 (94%), Village 2, 46 (17%), Village 3, 61 (34%), Village 4, 50 (23%), Village 7, 51 (43%). The reason for the relatively larger sample size in Village 3 and smaller in Village 2 was lack of information regarding the border between Villages 2 and 3 in the Sub-District and Tambon office records. Overall, 30 percent of the 840 reported households for the 5 villages are included in the sample. One male and one female adult were interviewed in each
household resulting in a total sample size of 502.
1
The numbers for the villages are official designations for the Tambon, which are used in official documents as well as terms of reference by some individuals.
2
2. Tsunami Impacts on Residents.
2.1Introduction
In order to determine the experiences respondents in the five villages had concerning the tsunami as well as the tsunami’s impacts on their physical well being as well as that of their household members, relatives and friends, they were asked the following questions:
1. As a result of the tsunami, were you injured? Yes____ No___
For the following 3 questions if the response was yes, the number was entered in the space provided.
2a. Were any members of your household killed? yes___ no___ b. or injured? Yes___ no___
3a. Were any of your kin outside your household killed? yes___ no___ b. or injured? Yes___ no___
4a. Were any close friends killed? yes___ no___ b. or injured? Yes___ no___
5. Where were you when the tsunami struck? 6. What did you see?
2.2Injury and Death
2.2.1 Inter-village variation Table 1 indicates the percent distribution of respondents who were injured by the tsunami. The overall differences are not
statistically significant (χ2= 8.19, df = 4, p>0.05), but Village 4, in comparison to the other villages combined has a smaller number of respondents who report injury by the tsunami (χ2= 6.29, df = 1, p<0.05).
Table 1. Percent respondents injured by tsunami.
Village
1 2 3 4 7 Total Percent respondents injured 13 18 20 07 19 16 N=457
Tables 2 and 3 indicate the percent distribution of numbers of household members injured or killed by the tsunami. Village 4 has the smallest percentage of respondents reporting some household members being
injured or killed (12 and 1 percent respectively). Village 7 has the largest percentage reporting some household members injured (25 percent) and Village 1 reports the largest percentage with some killed (36 percent). Statistical analyses of total numbers are presented below in table 8.
Table 2. Percent distribution of number of household members injured by the tsunami.
Village Number
injured 1 2 3 4 7 Total 0 80 81 77 88 75 80 1 16 10 18 08 19 15 2 01 06 03 04 06 04 3 00 03 01 00 00 01 4 03 00 00 00 00 <01 5 00 00 01 00 00 <01 N=458
Table 3. Percent distribution of number of household members killed by the tsunami.
Village Number
killed 1 2 3 4 7 Total 0 64 84 89 99 96 87 1 15 13 06 01 02 07 2 11 03 05 00 02 04 3 02 01 00 00 00 01 4 04 00 00 00 00 01 5 04 00 00 00 00 01 N=461
Table 4. Percent distribution of
Table 5. Percent distribution of number of relatives killed by the
Table 6. Percent distribution of number of friends injured by the
Table 7. Percent distribution of number of friends killed by the
Table 8. Analysis of variance of tsunami impacts on household members, relatives and friends.*
**df changes due to missing data on some variables.
household members injured, differences between the five villages are statistically significant. Village 1 has the highest mean number of household members and non-household relatives killed. Respondents from Village 3 report the highest mean number of non-household kin injured and friends killed and injured. These latter findings can possible be explained by the fact that Village 3 is the local trading center where village members have many contacts in the other villages. Also, Village 7 was a part of Village 3 until recently. Overall, Village 1 reports the largest number of household members, non-household kin and friends killed (the summary measure). Village 3 reports the highest number injured.
2.3 Locations and Experiences of Residents during the Tsunami
2.3.1 Locations of Residents Table 9 indicates the location of respondents during the tsunami. Half the respondents reported being at home, 10 percent
in boats at sea, a total of 9 percent on the beach, on an offshore island, in the mangroves, or at the pier or in the canal. About one-fourth (23 percent) were at other locations in or outside their village. Finally, nine percent of respondents did not want to talk about their location at the time of the tsunami.
2.3.2 Experiences of Residents Table 10 presents percent distribution of experiences during the tsunami as reported by respondents. Response categories in table 10 are sub-categorized from 85 response categories in the raw data. The category “debris” includes reports of automobiles, houses, and other large debris being broken and/or washed through the village by the waves. “Boats sinking” refers to reports of visually observing boats sinking. Any description of the waves, e.g., “high waves”, “lots of waves”, “big white waves”, “wave about 7 meters high”, etc. were categorized as simply “waves”. Any mention of the impact on people, e.g., “people
running”, “dead people”, “people crying”, was categorized as “people”. The category “high water” included mention of flooding, “water rising quickly”, etc. Some reported not seeing anything (nothing) and others refused to talk about the tsunami (no response). Responses
that could not be categorized into these categories are noted as “other”.
Table 9. Percent distribution of location of respondents during the tsunami.
Village
1 2 3 4 7
Focusing only on inter-community differences that are statistically significant, table 10 indicates that villagers from Village 4 are more likely to note the high water (χ2= 43.91, df = 4, p<0.001) than villagers from the other villages. Since Village 4 is located in the mangroves for the most part, they probably only experienced the increase in water, the waves being buffered by the trees. Villagers from Villages 1 and 7 are more likely to report aspects of the waves (χ2= 38.65, df = 4, p<0.001), probably as a result of their overall more exposed location. Behavior of people were mentioned most frequently by respondents from Village 4 (χ2= 14.09, df = 4, p<0.01). It is difficult to explain this relationship. Finally, respondents from Villages 2 and 3 are most likely to report seeing nothing (χ2= 62.48, df = 4, p<0.001). This response can probably be explained by the fact that significant proportions of the populations of these two villages live inland and farther away from the sea than those from the other villages.
Total N
Table 10. Percent distribution of respondent’s experiences during the tsunami.
3. Impacts of the Tsunami on Possessions and Productive Materials
3.1 Introduction
Recovery efforts in the aftermath of natural disasters must be designed to meet the needs of the affected population. The extent and type of aid needed is determined by the impact of the disaster on households and livelihoods. Therefore, it is important to describe the extent of damage to possessions and productive materials. This information can then be used to structure recovery over the life of the program.
In order to describe the affects of the tsunami on possessions and productive materials, we surveyed a sample of 251 households. The respondents were asked the following questions:
1. Do you have a replacement boat? If so, does it have a replacement motor? 2. In terms of the gear associated with the productive activities, was any of it
3. damaged or destroyed by the tsunami? If yes, what and what was the extent of the damage?
4. With regard to your house and/or its contents, was anything damaged or destroyed by the tsunami? If Yes, what?
3.2 Impacts on Possessions and Productive Materials
Table 11 illustrates damage to various aspects of households in each village. Due to changes in the survey after completing the first sample in Village 1, a shortened survey was administered to twenty-five
households to provide more detailed information. Therefore, the data for the boat, engine and gear damage was calculated from the smaller sample for Village 1 and the house and household item damage was determined from the larger sample. However, the relative percentages are of the respective sample from which the data was gathered.
Over two-thirds of the residents in Village 7 (70.6 percent) lost one or more boats during the tsunami. In Villages 1 (52 percent) and 4 (54 percent) over half of the households lost boats. Approximately one-third of the boats were
lost from Villages 2 (39.1 percent) and 3 (32.8 percent). In all of the surveyed villages, the percentage of engines lost was the same or slightly less than loss of boats (Villages 1 and 3, equal; Village 2, 2.1 percent less; Village 4, 12 percent less; Village 7, 2 percent less). This is to be expected because some of the boats that were destroyed by the tsunami did not have engines.
Table 11. Damage to boats, engines, gear, house, and household items grouped by village
No. % No. % No. % No. % No. %
Boat 13 52.0 18 39.1 20 32.8 27 54.0 36 70.6
Engine 13 52.0 17 37.0 20 32.8 21 42.0 35 68.6
Gear 20 80.0 26 56.5 23 37.7 35 70.0 41 80.4
House 13 30.2 18 39.1 5 8.2 3 6.0 27 52.9
Household Items 35 81.4 19 41.3 12 19.7 7 14.0 39 76.5
Village 7 Village 1 Village 2 Village 3 Village 4
Gear damage, as recorded in the table above, includes all fishing gear that was reported damaged and/or destroyed. Overall, more gear was lost by a larger percent of surveyed households in all of the villages than boats or engines. Eighty percent of the households sampled in Villages 1 and 7 (80.4 percent) lost fishing gear. Seventy percent of the households in Village 4 and over half of the sample in Village 2 (56.5 percent) lost fishing gear.
Damage to houses differed largely between villages, ranging from six (Village 4) to over fifty percent (Village 7). This disparity is best explained by the proximity of each of the villages to the ocean. The location of the houses in Village 7 (52.9 percent damage) were along a canal that led to open ocean. About one-third of the sample in Villages 2 (39.1 percent) and 1 (30.2 percent) experienced damage to houses. In Village 3 (8.2 percent) houses were less likely to experience damage because their location is further inland and Village 4 (6.0 percent), within a mangrove area that is protected from open ocean waves.
to household items at over two-thirds of each of the samples. Over forty percent of the households
surveyed in Village 2 (41.3 percent) sustained damage to household items. In Villages 3 (19.7 percent) and 4 (14.0 percent), less than one-fifth of the surveyed households reported damage to household items.
Table 12 categorizes household damage as none, partial or total. Many houses were completely destroyed along with all of the contents within. However, there were some households that experienced water damage, which may
(37 percent) and 1 (30.2 percent) each reported complete damage in approximately one third of the surveyed households. This is consistent with the presence of rebuilt houses in each of these villages. Although there are rebuilt houses in Village 2, a large portion of the village is located inland and did not experience damage. This explains the relatively large percentage of households reporting no damage (58.7 percent) in addition to approximately one-third of the sample that experienced total damage (37 percent). Over half of the households surveyed in Village 1 (51.2 percent) experienced partial damage to their house and/or household items. Less than fifteen percent of the sample in Villages 2 (4.3 percent), 4 (8 percent), and 7 (14 percent) experienced partial damage. There were no households that reported partial damage in Village 3. Villages 3 (80.3 percent) and 4 (86 percent) reported the largest proportion of households with no damage. This finding is consistent with the settlement pattern in Village 3 because the village is located further inland than other villages. Most houses in Village 4 are also relatively protected from the open ocean because the village is located behind a thick area of mangroves and the houses are constructed on stilts and connected by
raised walkways.
Table 12. Damage to houses and household items
Village 1 Village 2 Village 3 Village 4 Village 7
affected by the tsunami. Villages 3 and 4 (80.3 percent) each contained the highest proportion of households that did not report any impact to occupations while Village 2 (56.5 percent) reports the least percentage of households that experienced no impact upon occupations.
Table 13. Tsunami Impacts on Non-Fishing Occupations by Village
Table 14 illustrates the cumulative effects of the tsunami on surveyed households in each of the five villages. Only house and household item damage are included for the data in Village 1
because there are two sets of data that cannot be combined to analyze for the purposes of this table. In Village 1, over ten percent sustained one impact (11.6 percent) and about one third of the sample sustained two impacts (30.3 percent). This data includes two-fifths of the total number surveyed (43 households) because the remaining households may have sustained other impacts but it cannot be determined from the information gathered.
Table 14. Cumulative impacts.
Village 1 Village 2 Village 3 Village 4 Village 7
No. % No. % No. % No. % No. %
No Impacts - - 13 28.3 33 54.1 8 16.0 2 3.9
Impacts analyzed for Villages 2, 3, 4, and 7, in table 14 are house, household items, boat, engine, gear and impacts to occupations other than fishing. Over half of the sample in Village 3 (54.1 percent) and over one-quarter of Village 2 (28.3 percent) sustained no impacts that were addressed in the survey. In Villages 4 (16 percent) and 7 (3.9 percent) less than one-fifth of the surveyed households reported no impacts to occupations or possessions. In Village 2, about one quarter of the households sustained five impacts from the disaster (23.9 percent). This is significant because it shows that while many households were not impacted (28.3 percent), a significant portion was also severely impacted. This reflects the settlement pattern because those households that were located adjacent to the ocean were heavily affected and those located inland, were not. The data in Village 3 reflects the settlement pattern of households as well. Other than the households that did not experience any impacts, the highest remaining percentage sustained four impacts (13.1 percent) and constitutes less than fifteen percent of the sample. Because households are generally located inland in Village 3, there were many surveyed households that sustained no damage to their houses and household items. However, Village 3 is connected to the ocean via a river. This river is used as access for boats from Village 3 to the ocean and, therefore, its residents still rely on fishing for food and income and may have sustained impacts to this aspect of their household income. Although many of the houses in Village 4 are built on stilts above the water, they were largely protected from the surge of water because they are located within a mangrove area. However, many households in Village 4 participate in fishing, and their boats that were docked nearby did not fair as well as houses in the area. The largest portion of households in this sample sustained three impacts from the tsunami in Village 4 (30 percent). Over one-fifth of the sample reported one impact (22 percent) and over eighty percent of households experienced one or more impacts (84 percent). The settlement pattern of Village 7 is more concentrated on the ocean than any other village. This is reflected in the data where over ninety five percent (96.1 percent) of the sample experienced at least one impact from the tsunami and the largest percentage (27.5 percent) sustained five impacts to their household.
3.3 Conclusions
This data as a whole illustrates the severity of tsunami impacts to material objects (both personal possessions and productive materials). Household impacts represent investment and savings over a relatively long time period because most people in this area move into a house after they marry and remain there for the rest of their lives while continually adding to their initial investment. Many of the families gradually built or improved their houses overtime as they accrued savings. Those households that lost houses also lost most of the contents within and, therefore, must start over again, saving for improving their houses and acquiring items.
Occupational impacts are also significant. For example, if a household loses its boat and fishing gear, it must first save enough money to invest in these things again in order to resume fishing. Manyoccupations
One Impact 5 11.6 8 17.4 6 9.8 11 22.0 5 9.8
Two Impacts 13 30.3 5 10.9 2 3.3 7 14.0 5 9.8
Three Impacts - - 7 15.2 7 11.5 15 30.0 7 13.7
Four Impacts - - 0 0.0 8 13.1 8 16.0 9 17.6
Five Impacts - - 11 23.9 1 1.6 1 2.0 14 27.5
Six Impacts - - 2 4.3 4 6.6 0 0.0 9 17.6
practiced in this area provide food in addition to income; people practicing these occupations are hurt both in terms of monetary income and food. Other occupations were impacted because productive materials were literally washed away by the water that inundated the villages. For example, one respondent was a seamstress prior to the tsunami but her sewing machine and all of her tools and materials were washed away. She now has to save enough money to begin to rebuild her practice but because she has lost her machine, she needs to find a new occupation, or another way to access necessary tools to sew, in order to begin the rebuilding process. An additional impact is indirect. Many households are saving as much as possible in order to invest in materials necessary for practicing their former occupations, but because of this, they are less likely to spend money on things that are not absolutely necessary. To continue with the example above, the woman who wants to start a new occupation in order to buy a sewing machine will not be likely to save much by continuing as a seamstress (for example, by hand) because other villagers are less likely to hire her for her expertise. Therefore, the community as a whole will recover more slowly than if residents were able to resume their former livelihoods with the necessary tools.
4. Current Occupations
4.1 Introduction
Occupations are a very important aspect of social structure as well as an indicator of the relative importance of different components of the coastal resource. During recovery efforts, an accurate description of
occupational distribution is essential to determine options for livelihood rehabilitation projects. Scale, working group size and level of occupational multiplicity can provide additional information for use in designing recovery projects. Occupational multiplicity exists when a given individual or household practices two or more income or subsistence-producing activities. This is often a characteristic of coastal communities, especially in rural areas. Secondary data is often an inadequate source of information concerning occupations, since most published statistics only include the full-time or primary occupation. The only way to more accurately represent the distribution and relative importance of these activities is with the use of a sample survey (Pollnac and Crawford, 2000).
In order to provide an accurate description of livelihood distribution, we surveyed 251 households in the five village sites. The respondents, either the female or male head of household, were asked to rank livelihood activities by priority as they contribute to household income and/or subsistence.
4.2 Current Occupations
Fishing is the most important and the most common livelihood in each of the villages except for Village 3. Trading and farming are relatively more common in Village 3 because it is the center of commercial activity. Overall, the villages show occupational multiplicity to be the norm for households in the sample. Two of the five villages had at least one household rank six or more activities and over half of the
households in the survey listed more than one activity.
According to Table 15, the most important occupation among the surveyed households in Village 1 is fishing (81.5 percent), with over half of the households (51.2 percent) listing this as the highest ranked occupational activity. Farming (30.2 percent), livestock (32.7 percent) and labor (34.9 percent) all contribute significantly to income generation for this village with about one-third of the surveyed households ranking these three
occupations. Trading is identified by a relatively small percentage (16.3 percent). The remaining 4.6 percent are engaged in making soap for sale in the village and distributed to a small city, Kuraburi, nearby for sale to tourists.
Table 15. Percent distribution of Village 1 Occupations by rank
Activity 1st 2nd 3rd 4th 5th 6th 7th Total
Fishing 51.2 25.6 4.7 - - - - 81.5
Aquaculture - - - 0.0
Farming 9.3 9.3 7.0 2.3 2.3 - - 30.2
Livestock 4.7 14.0 9.3 4.7 - - - 32.7
Trading 9.3 4.7 2.3 - - - - 16.3
Tourism - - - 0.0
Labor 20.9 7.0 7.0 - - - - 34.9
Taxi - - - 0.0
Other1 2.3 2.3 - - - 4.6
Other2 - - - 0.0
As summarized in Table 16, over half of the surveyed households in Village 2 participate in fishing (58.7 percent). Labor (49.9 percent) and farming (47.8 percent), however, contribute to income and food in almost half of the sampled households in this village. Slightly less than one-third of the sample ranked trading (30.5 percent) or aquaculture
(28.3 percent) as a contribution to household income. Almost one-fifth of those surveyed ranked raising livestock (19.6 percent) as a source of income, but none lists this as the primary source. Other activities contributing to
percent) is ranked by less than half of the households surveyed in Village 3 and farming (70.5 percent) is the most often ranked occupation.
However, fishing was most often ranked first (31.1 percent) by over thirty percent of the sample. More than one-third of the households also ranked trading (42.6 percent) and/or labor (37.8 percent) as a source of income with each ranked first by less than thirty percent of the surveyed households (26.2 and 24.6,
respectively). Twice each week, there is a market in this village that draws local residents selling produce and merchants from nearby cities (Kuraburi and Ranong). This could account for the relatively larger
percentage of households involved in trading. Aquaculture (27.9 percent) is practiced by just under one-third of the households in the sample. Less than one-fifth of the sample ranked raising livestock (16.4 percent), with none listing this as the primary occupation, just as in village 2. The remaining occupations (14.5 percent) ranked include tourism, motorcycle taxi, manager of drivers for public transportation and village health worker. This village is not
directly adjacent to the shore which could account for the relatively lower portion of the sample ranking fishing as an occupation.
Table 16. Percent distribution of Village 2 Occupations by rank.
Activity 1st 2nd 3rd 4th 5th 6th 7th Total
Fishing 41.3 8.7 4.3 2.2 2.2 - - 58.7
Total 100.1 80.4 45.6 17.4 2.2 2.2 2.2
Table 17. Percent distribution of Village 3 occupations by rank.
Activity 1st 2nd 3rd 4th 5th 6th 7th Total
Fishing 31.1 14.8 - - 1.6 - - 47.5
Total 100.0 82.1 44.2 22.9 6.4 1.6 0.0
Table 18. Percent distribution of Village 4 occupations by rank.
Activity 1st 2nd 3rd 4th 5th 6th 7th Total
Fishing 58.0 12.0 4.0 2.0 - - - 76.0
Total 100.0 64.0 34.0 14.0 7.0 0.0 0.0
ranked by less than one-fifth (16 percent) of the households. Livestock raising (8 percent), motorcycle taxi (2 percent), administrative officer (2 percent) and computer store owner (2 percent) constitute the
remaining portion of the sources of income of the surveyed households, each representing under ten percent of the surveyed households.
Table 19 illustrates that over four-fifths of the households surveyed in Village 7 ranked fishing (86.3 percent) as a source of income, more
often than any other village. Almost three-quarters of the sample ranked fishing first for income generation and subsistence. Over one-fifth of the sample ranked labor (39.2 percent), trading (31.4 percent) and aquaculture (23.6 percent) among the activities contributing to their household food and income. Farming (15.7 percent) and raising livestock (15.6 percent) were ranked by less than one-fifth of the sample and no surveyed households ranked either activity as a primary source of income.
Table 19. Percent distribution of Village 7 occupations by rank
Activity 1st 2nd 3rd 4th 5th 6th 7th Total
Fishing 72.5 11.8 - - 2.0 - - 86.3 Aquaculture 2.0 11.8 7.8 2.0 - - - 23.6
Farming - 5.9 7.8 - 2.0 - - 15.7
Livestock - 7.8 - 7.8 - - - 15.6
Trading 9.8 15.7 5.9 - - - - 31.4
Tourism - - - 0.0
Labor 13.7 21.6 3.9 - - - - 39.2
Taxi 2.0 2.0 - - - 4.0
Other1 - - 2.0 - - - - 2.0
Other2 - - - 0.0
Total 100.0 76.6 27.4 9.8 4.0 0.0 0.0
4.3 Conclusions
The above results can be used to inform tsunami recovery project design about livelihood recovery options. Most of the households in these villages are already engaged in occupational multiplicity. This is an advantage for managers because if residents are accustomed to participating in different types of livelihood options, they are likely to be comfortable learning various types of skills as needed. Therefore, they may be more likely to participate in newly introduced livelihood projects to supplement their current sources of income (Rogers 2003). One option for rehabilitation is to encourage expansion of current livelihood options (e.g., raising livestock). This could be a relatively rapid way to increase income for households and will also involve less capital and training because some households already practice this type of livelihood.
5. Distribution of Labor by Age and Gender
5.1 Introduction
During rehabilitation efforts, the workload for different parts of the family should be closely analyzed. This is important when designing livelihood recovery projects in order to target portions of the population that have time and ability to participate in activities. In coastal communities, while males usually practice fishing in the open sea, women often glean shellfish from intertidal areas and practice other types of livelihood activities. Children may also contribute to household income before and after school, if they attend. Design of recovery projects should use the information from the current distribution of family participation to inform the structure and type of projects to be implemented and the portion of the affected population to be targeted for each project.
As a means of accurately describing family participation in occupations in the villages, we surveyed 251 households in five villages. Respondents were asked to identify who in the household is responsible for each livelihood activity that contributes to the household. The possible responses were 1) adult males; 2)
5.2 Family Participation in Occupations
Adult males contribute the most often to households in the sample, especially in the case of fishing. However, a small percentage of adult females also participate in the capture fishery. Overall, women and children contribute significantly to household income. Children, without adults, however, are not mentioned by any of the respondents in any of the livelihood activities.
Table 20. Family Participation by Occupation in Village 1
Adult
As illustrated in Table 20, occupational distribution by sex in Village 1 differs among different occupations. While fishing is practiced almost entirely by men (97.1 percent), trading (85.7 percent) is predominantly conducted only by women. In addition, palm leaf sewing (Other 1 in the table) is practiced exclusively by females, but it should be noted that there was only one respondent that listed this as an occupation. Based on this sample, children (defined in the survey as under 15 years of age) significantly contribute only to aquaculture (25 percent). Farming is practiced by only males (69.2 percent) in over two-thirds of the surveyed households and by both male and female adults in a little under one-third (30.8 percent). Half of the households raising livestock do so with both female and male participation (50.0 percent), with males only (42.9 percent) practicing in the majority of the remaining households. Labor is practiced by men (66.7 percent) in two-thirds of the households and one-third of the women (33.3 percent).
In Village 2 (see Table 21), none of the households surveyed reported that children significantly to any of the ranked occupations. Males only (92.6 percent) participate in fishing and aquaculture (84.6 percent) with only a small fraction of each of these occupations (3.6 percent and 7.7 percent, respectively) practiced by females or both males and females. In contrast both males and females contribute in over one-third of the surveyed households to farming (40.9 percent), trading (35.7 percent) and labor (34.8 percent). Males only contribute to farming (50.0 percent), livestock (44.4 percent) and labor (43.5 percent) in
Activity Male Female
Table 21. Family Participation by Occupation in Village 2
approximately half of the households in this village. Trading (57.1 percent) is the only occupation in which females only contribute in more than half of the sample. However, females alone do practice livestock (33.3 percent), teaching and road maintenance, ‘Other 1’ on Table 21, (33.3 percent) and labor (21.7 percent).
Table 22. Family Participation by Occupation for Village 3
Adult
In Village 3 (see Table 22), males only practice the occupations of tourism, motorcycle taxi (each 100 percent) and fishing (75.9 percent). Males and females practice farming (60.5 percent), livestock (60.0 percent) and aquaculture (56.3 percent) in over half of the households in the sample. Women only contribute to trading (50.0 percent) in half of the surveyed households, but both women and men (42.3 percent) participate in this occupation in almost half of the survey as well. In this village, adults and children of both sexes contribute to aquaculture (6.3 percent) and farming (2.3 percent), and women only (2.3 percent) also participate in farming but rarely. Labor is practiced by men only in half (52.2 percent) of the sample and, by women only in thirty percent of the households (30.4 percent). In less than one-fifth of the sample both males and females (17.4 percent) are involved in labor.
In Village 4 (Table 23) fishing is practiced by only males (84.2 percent) in over eighty percent of the households with females only (13.2 percent) contributing to just over one tenth of the sample and a very small percentage (2.6 percent) of households where adults and children of both sexes practice fishing. Both sexes of children and adults (12.5 percent) participate in aquaculture in over ten percent of the households surveyed. The remainder of aquaculture is practiced by men only (50 percent) in half of the sample and women only in over one third (37.5 percent). Farming is distributed more evenly between the sexes with men and women (45 percent) responsible for this activity in almost half of the households and men only (35 percent) and women only (20 percent) at lower percentages. Livestock raisingis also practiced by both
Activity Male Female
Table 23. Family Participation by Occupation for Village 4
sexes of adults (50 percent) in half of the surveyed households and females only and adult males and children each representing a quarter (25 percent) of the sample. Trading is conducted by women only (81.8 percent) in over eighty percent of the households with the remainder being conducted by both men and women (18.2 percent). This is consistent with the other village samples and with other fishing
communities where women handle trading and men fish. Labor is also practiced by only women in half (50 percent) of the households with only forty percent practiced by males only (40.9 percent) and a small percentage by both sexes of adults and both sexes of adults and both sexes of children (each 4.5 percent). Tourism, motorcycle taxi services, computer store operation, and administrative officer are performed entirely by men only (100 percent).
Table 24. Family Participation by Occupation for Village 7
Adult Males & Children
Adult Females
& Children
Adults & Children (Both Sexes)
Table 24 represents family participation in occupations in the sample from Village 7. Males only (93.2 percent) practice fishing in almost all surveyed households and entirely for motorcycle taxi (100 percent). Family participation in aquaculture is well distributed with males only (41.7 percent) slightly higher than females only (33.3 percent) and both sexes of adults (8.3 percent). Children also contribute to aquaculture for the households in this sample both with adult males (12.5 percent) and with both males and females (8.3 percent). Children, in the surveyed households in Village 7 also contribute significantly to farming (both with males only (12.5 percent) and with both sexes of adults (25.0 percent)) and to raising livestock. Half of the households engaged in livestock report that children and adults of both sexes (50 percent) participate and the other half is contributed to the household by women only (50 percent). Females alone (37.5 percent) and adults, both male and female, (25 percent) each also practice farming in significant portion with respect to farming. As in the other villages, trading is practiced by only females (56.3 percent) in over half of the sample in Village 7. However, both adults (31.3 percent) make up almost one-third of the surveyed households for trading.
5.3 Conclusions
The results above indicate that recovery efforts should include both women and children in participatory consultations in order to design projects that will address contributions of the entire household. Women and children should be consulted as to their availability and willingness to participate and learn new skills. It is possible that children’s willingness to participate in projects is different than that of adults, especially since a majority of the children in this area have some experience with formal education. This may increase willingness to participate because the children are confident that they can learn new skills but it may decrease likeliness if children tend to want to devote more time to schooling. Women also may be more likely to participate in different types of projects, especially with respect to working group structure. Researchers observed that women tended to work in groups, for example when gleaning the intertidal areas. Men, however, tended to work (especially in the capture fishery) in pairs or threes. Project design should reflect these trends in current working environments in order to increase their likelihood of success.
Activity Male Female Both (Adults)
Both (Children)
Fishing 93.2 - 4.5 - 2.3 - - Aquaculture 41.7 33.3 8.3 - 8.3 - 8.3 Farming - 37.5 25.0 - 12.5 - 25.0 Livestock - 50.0 - - - - 50.0 Trading 6.3 56.3 31.3 - - 6.3 - Tourism - - - Labor 45.0 35.0 15.0 - - - 5.0
Taxi 100.0 - - -