THAILAND POST-TSUNAMI SUSTAINABLE
COASTAL LIVELIHOODS PROGRAM
FOLLOW UP ASSESSMENT OF TSUNAMI AFFECTED
VILLAGES
TAMBON KAMPUAN, SUK SAMRAN DISTRICT, RANONG
PROVINCE, THAILAND
P
REPARED BYD
AWNM.
K
OTOWICZJ
ANUARY2008
A
P
ROGRAM OF THEL
EADER WITHA
SSOCIATESC
OOPERATIVEA
GREEMENT ONS
USTAINABLEC
OASTALC
OMMUNITIES ANDE
COSYSTEMS(SUCCESS)
R
EGIONALD
EVELOPMENTM
ISSION/A
SIAU.S.
A
GENCY FORI
NTERNATIONALD
EVELOPMENTIntroduction... 3
Number of Livelihoods Contributing to Households ... 5
Inter-village Variation... 5
Baseline and Follow Up Assessment Comparisons ... 6
Conclusions and Recommendations... 7
References Cited... 8
Follow Up to Baseline – #2... 9
Fishing Practices... 9
Introduction... 9
Current Distribution of Fishing Practices... 9
Inter-village Variation in Fishing Practices ... 11
Changes Since Initial Socio-Economic Survey ... 12
Conclusions ... 14
Preferred Occupation (if not fishing) ... 19
Attitudes toward the Safety of Fishing... 19
Changes Since Initial Socio-Economic Survey ... 21
Conclusions and Recommendations... 23
Factors Associated with Variability in Investment Orientation ... 27
Changes Since Initial Socio-Economic Survey ... 29
Conclusions and Recommendations... 29
References Cited... 29
Follow Up to Baseline – #5... 31
Perceptions of Coastal Resources and Factors Related to their Management... 31
Introduction... 31
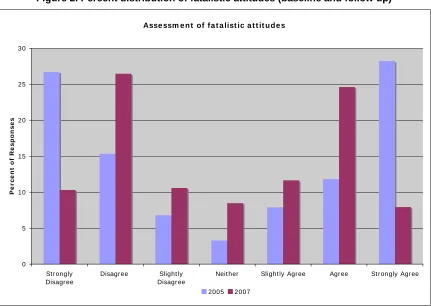
Attitudes Toward Human Influence on Coastal Resources and Fatalism... 31
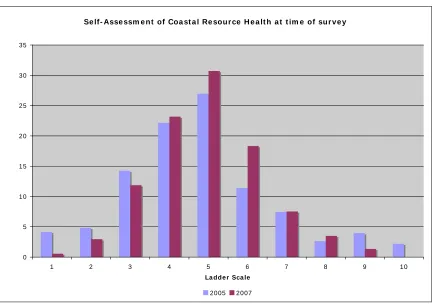
Assessment of Coastal Resources Health and Management... 33
Perceptions of Change in Coastal Resources and Management Since Tsunami ... 35
Perceptions of the Future for Coastal Resources and Management ... 37
Changes Since Initial Socio-Economic Survey ... 39
Conclusions ... 42
References Cited... 43
Follow Up to Baseline – #6... 44
Subjective and material well-being ... 44
Introduction... 44
Self-Anchoring Assessment of Community and Household Well-being ... 45
Perceptions of Changes in Well-being Since Tsunami ... 46
Projections of the Future of Well-being ... 47
Changes Since Initial Socio-Economic Survey ... 48
Conclusions ... 52
INTRODUCTION
This report describes the results of a survey of social and economic data of five villages in Suk Sumran, Ranong, Thailand. These villages were selected to participate in the Post-Tsunami Sustainable Coastal Livelihoods (SCL) Program to assist with rebuilding these coastal communities following the 2004 Indian Ocean Tsunami.
In June and July of 2005, researchers conducted a survey to provide a baseline of data in the SCL Program villages prior to the beginning of Program implementation. In February and March of 2007, a follow up survey was conducted in the villages near the conclusion of SCL Program implementation in order to document changes in the communities between the baseline and follow up surveys. Field research included participant observation, semi-structured interviews and household surveys conducted while living in the community and interacting daily with the
residents of the Program villages. Participant observation included accompanying residents during livelihood and other daily activities. Semi-structured interviews were conducted with key informants in order to document livelihood activities including traditional livelihoods and those implemented as part of the SCL Program and other recovery efforts. In addition, interviews with residents from each village were conducted regarding perceptions of recovery, preparedness and livelihood rehabilitation. Household surveys were conducted with male and female heads of households in each of the five villages in the SCL Program area.
The follow up household surveys included many of the same questions that were used during the baseline assessment in order to directly compare results directly during the two time periods. Other questions were added to the survey to assess relevant perceptions regarding recovery from the tsunami and livelihoods (Bankoff et al. 2004). The methods used for data collection and analysis are adapted to assess recovery from the manual, Assessing Behavioral Aspects of
Coastal Resource Use (Pollnac and Crawford 2000).
The following report is divided into sections into seven aspects of a socio-economic assessment that are significant for disaster recovery efforts in coastal communities: (1) livelihood distribution, (2) fishing practices, (3) attitudes toward the occupation of fishing, (4) investment orientation, (5) perceptions of coastal resources and factors related to their management, (6) subjective and material well-being and (7) perceptions of tsunami recovery activities.
Each section below begins with an explanation of the importance of monitoring the socio-economic aspects of the SCL Program villages during recovery and comparing values to data from the baseline. Next, quantitative and qualitative data is presented and interpreted regarding the topic of the section, followed by conclusions that describe what this data indicates about the recovery of the residents of SCL Program area. Finally, there is a list of references cited in that section of the report.
REFERENCES CITED
Bankoff, G., G. Frerks, and D. Hilhorst. (Eds.). 2004. Mapping Vulnerability: Disasters,
Development and People. Earthscan: Sterling, VA.
Follow Up to Baseline – #1 Livelihoods
INTRODUCTION
One focus of the Sustainable Coastal Livelihoods (SCL) Program is livelihood assistance in order to provide affected residents with the tools to begin recovering on their own. In addition, the SCL Program strives to introduce alternative livelihoods that increase resilience at both the household and community levels by increasing the number of types of livelihoods available to residents.1 Research on resilience suggests that communities that are more resilient use a diversity of natural and commercial resources sustainably and are therefore, able to respond more rapidly and effectively if one type of livelihood is disturbed (Marschke and Berkes 2006; Pomeroy et al. 2006). The concept of resilience in livelihoods can be applied to both the household and
community levels. It is important, therefore, to document the types and distribution of livelihoods in the Program villages by households, and at both the beginning and conclusion of the SCL Program. This overview can provide managers with information about household and village use of local resources for food and income. This data can also inform researchers about community-level resource use in the Program area. The follow up survey acquired data on types of livelihood activities that contribute to household food and income for 204 households in the five villages included in the SCL Program.
CURRENT LIVELIHOOD DISTRIBUTION
Respondents were asked to list all sources of income and food generation that contributed to their household in the past year. For the purposes of this analysis, livelihood activities in the Program villages were grouped into the following seven categories:
1. Fishing – including all capture fishing activities from a boat or the shore whether boat owner or crew;
2. Aquaculture – including all types of fish and seafood production and raising; 3. Farming – including farming activities for both orchard and crop production; 4. Livestock – including all types of animal breeding and raising;
5. Trading – including, for example, groceries, handicrafts, construction materials, furniture and tree seedlings;
6. Unskilled labor –types of labor that do not require extensive knowledge or training including construction, cleaning, clearing land, making fishing nets, motorcycle taxi and drivers; and
7. Skilled labor – labor types that require informal or formal knowledge or training including boat-making, carpentry, cooking, sewing, teaching, mechanics and government officials.
The following table summarizes data from 204 households regarding livelihoods that contribute to household income and/or food generation (Table 1). Overall, fishing was the most common livelihood of surveyed households, with almost one-half (48%) participating in at least one type of fishing. Unskilled labor (45%) and skilled labor (44%) each were also practiced by almost half of all households in the overall sample. Aquaculture was practiced by the smallest percentage of households in the project villages (4%). It is interesting to note that semi-structured interviews and observation indicated that, almost all households practice some form of fishing (most often hook-and-line for household consumption) on occasion. Due to the location of the villages on adjacent to the Andaman Sea, fishing is a part of the life in all of the project villages but might not be mentioned as a contribution to household income if it contributes only a small percentage overall.
1
Table 1. Percent Distribution of Livelihood Activities by Village
Village Fishing
Unskilled Labor
Skilled
Labor Farming Trading Livestock Aquaculture
No. of
* Note that percentages may total more than 100 due to households with multiple sources of income/food generation.
NUMBER OF LIVELIHOODS CONTRIBUTING TO HOUSEHOLDS
Two-thirds (66%) of all respondents listed two or more forms of income and/or food generation to household well-being (Table 2). Households that rely on more than one source of income or food are more likely to experience less severe damage during a natural disaster and, if affected, likely to recover more quickly. Hence, they are likely to be more resilient households and form a more resilient local economy (Adger 2000). In addition, semi-structured interviews and observations revealed numerous sources of informal income and food that may not have been captured by the survey. In Village 7, one interviewee reported that his income was from fishing and his wife, from processing seafood. Subsequent questions revealed that he also occasionally takes Thai tourists out on his boat and that he doesn’t consider it a regular source of income because of its irregular contribution to household income. Although, these additional sources of income usually add only a small portion to overall household earnings, they contribute to resilience at the household level. These small contributions to household income indicate that residents are willing and able to participate in various types of livelihoods. Household livelihood diversity increases the capability to respond to changing conditions by relying on available sources of livelihood, as determined by current conditions, and increases household resilience (Marschke and Berkes 2006). Households in Village 1 report the highest income diversity. Less than one quarter (24%) of surveyed
households reported only one source of income and almost one-tenth (9%) listed five sources. In contrast, 44% of households in Village 7 and over one-third (37%) mentioned only on type of livelihood in Village 4 indicate less household income diversity in these villages.
Table 2. Percent distribution of number of livelihood activities
Village One Two Three Four Five N
INTER-VILLAGE VARIATION
There were substantial differences in livelihood distribution between villages. Statistically
one is adjacent to the sea and the other is separated from the coast by a main road (Route 4) that runs north/south through Suk-Sumran. In both of these villages, households located in the coastal sections are more likely engaged in fishing and those located on the inland side of Route 4 are often engaged in other types of livelihoods, especially trading and farming. Village 3 contains the least percentage of households engaged in fishing (29%), and the highest percentage in farming (44%). This is the village where the central market, and most other shops in Kamphuan, are located. In Village 3 is also where much of the farmland is located and therefore, many households engage in farming. In this village, skilled labor (44%) is also a common source of livelihood and reported by the same percentage of households as farming. Livestock raising is most common in Villages 3 (24%) and 1 (12%) which have more land area on which to raise animals, and is a much less common source of livelihood in the other villages (2, 4 and 7) where more households focus on fishing (Village 7), or farming and trading (Village 4).
BASELINE AND FOLLOW UP ASSESSMENT COMPARISONS
Figure 1 shows the percent distribution for livelihood activities for both the baseline (2005) and follow up (2007) assessments.
Figure 1. Percent Distribution of Livelihood Activities (2005 and 2007)
0
chi-square = 44.3, df = 1, p<0.001), aquaculture (18%, chi-chi-square = 62.6, df = 1, p<0.001) and raising livestock (chi-square = 11.7, df = 1, p<0.001). Prior to the baseline assessment, many residents were given donations, such as boats and gear, or the opportunity to participate in projects, especially aquaculture projects. Heads of households that do not normally practice fishing, aquaculture and livestock took advantage of opportunities to begin making income as soon as possible after the tsunami. During the time between the baseline and follow up assessments, residents saved money from these other types of livelihoods and invested their savings in productive materials in order to facilitate their return to their pre-tsunami livelihood. In addition, some livestock and aquaculture projects failed after the baseline data collection was conducted, causing participants to find other sources of income. Respondents making income from farming also decreased by more than one-fifth (11%, chi-square = 11.7, df = 1, p<0.001).
The following figure shows the percent distribution of number of types of income for data from the baseline and follow up assessments (Figure 2).
Figure 2. Percent Distribution of Number of Livelihood Activities (2005 and 2007)
0 5 10 15 20 25 30 35 40
One Two Three Four Five Six
Number of Livelihood Types
P
e
rc
e
nt
a
ge
of
H
ous
e
hol
ds
2005 2007
From 2005 to 2007, the percentage of respondents that reported relying on one type of livelihood increased by 6%. More than one third (37% in 2005 and 35% in 2007) of the sample at each time period reported that more than two types of livelihood contributed to their household income and food. Overall, the surveyed households continue to practice a diverse set of livelihoods and rely on various natural and commercial resources for their income and food production which enhances household and community resilience.
CONCLUSIONS AND RECOMMENDATIONS
baseline. This data indicates that the Program villages are less reliant on coastal and marine resources than during the baseline assessment which suggests they may be more resilient in the face of a future coastal disaster. However, as will be further discussed in the next section, fishermen that practice various types of fishing and target more than one species increase their resilience in the case that one species or coastal/marine habitat is stressed but others remain healthy.
In addition, the increase in skilled labor indicates a more diverse workforce than during the baseline assessment, also increasing community resilience. However, the decrease in the percentage of farming, livestock and aquaculture may indicate that a number of livelihood projects that were implemented before the initial assessment have already failed. These projects were implemented by other assistance agencies and were not part of the SCL Program.
Specifically, semi-structured interviews indicate that aquaculture and livestock projects were implemented quickly and often without sufficient participant training. Often, participants were provided with materials and training regarding regular maintenance for raising animals, whether land or marine based, but not instructed as to how to respond to irregularities or whom to contact when questions or issues arose. Several respondents mentioned that if something went wrong (e.g. a donated goat became ill or a water filtration system malfunctioned), the participants were not prepared to respond to them and often abandoned the project. Overall, at both the household and community level, the data above illustrates a diversity of livelihoods using a variety of types of natural and commercial resources which can enhance community resilience in future
disturbances.
REFERENCES CITED
Adger, W.N. 2000. Social and ecological resilience: are they related? Progress in Human
Geography 24(3): 347-364.
Marschke, M.J. and F. Berkes. 2006. Exploring Strategies that Build Livelihood Resilience: a Case from Cambodia. Ecology and Society 11(1): 42.
Follow Up to Baseline – #2 Fishing Practices
INTRODUCTION
One of the goals of the SCL Program is to diversify livelihoods and resource use in the five Program villages. Although all types of fishing use coastal resources, resource dependency occurs when fishing households and/or communities rely on one type of fishing. Households that rely on fishing can still be resilient if fishermen target several species, in different habitats and during different seasons (Salas and Gaertner 2004). Diversification of fishing types is one way to encourage resilient communities where fishing is traditionally a prominent source of income and food (Pomeroy et al 2006). Fishermen that conduct various types of fishing are also more likely to effectively adapt to biophysical changes in the fishery and external stresses on fishery resources.
Fishing in all five of the SCL Program villages is primarily conducted by fishermen that reside in the area, from relatively small boats (less than 15 meters), with crews of three people or less. Fishermen from each of the five villages fish in the same offshore fishing grounds. Although the villages are adjacent to each other, there are some differences in inshore and nearshore habitat type. Villages 4 and 7 are adjacent to significant mangrove stands that fishermen use regularly, especially during the rainy season when rough ocean conditions discourage fishing offshore. Villages 1 and 3 each have a river running through them which serves as an additional fishing area, and upon which fishermen store their boats and gear. Villages 1 and 2 have significant sandy beach areas from which to fish or collect shellfish. Semi-structured interviews indicate that fishermen target nearshore areas closest to the village where they reside, but also fish in areas adjacent to other villages in Kamphuan.2 The follow up survey acquired data on fishing types that contribute to household food and income for 97 households (48% of the survey sample) in the five SCL Program villages. Respondents were asked to rank all types of fishing that contributed to household income and/or food generation over the past year.
CURRENT DISTRIBUTION OF FISHING PRACTICES
Ninety-two households (95% of households ranking fishing as a livelihood activity) consider fishing either a primary or secondary source of income and food generation (Table 1). The remaining 5% of surveyed households rely on fishing as a smaller proportion of household income and were not included in the remainder of this analysis.
Table 1. Percent of Fishing (Primary and Secondary) Households
Village Primary Secondary
No. of households
1 85.7 9.5 20
2 92.9 7.1 14
3 83.3 8.3 11
4 66.7 22.2 16
7 93.8 3.1 31
Overall 85.6 9.3 92
This data may indicate that survey respondents were less likely to note fishing among their livelihood sources if they rely on fishing for only a small percentage of total household income. Interview responses support this idea because several respondents that did not consider themselves fishermen (and were less likely to rank fishing among their livelihood activities) still reported fishing occasionally, especially if they received a donation boat or fishing gear from aid agencies. Due to the high percentage of fishing households in the Program villages and the
2
corresponding importance of fishery resources to the local economy, it is necessary to assess fishing practices separately.
Table 2 illustrates the percent distribution of fishing types in the Program villages. Crab nets (53%), shrimp nets (49%) and fish nets (42%) are the three most common fishing practices listed by fishermen in the survey sample.
Table 2. Percent Distribution of Fishing Activities by Village
Village
These types of nets are placed in offshore or nearshore areas where they are left for a time ranging from a few to twelve hours to collect catch. After this time, the net is gathered and either dragged to shore or onto a boat. Although each type of net differs in eye size, length and target species, personal observation indicates that the catch includes all species that become entangled in the nets. Almost all of the catch is used in some way, sold, eaten or used for bait, and very little goes to waste. However, this gear can entangle anything that swims into it, including juveniles and other sea animals, like turtles. Also of note is that this survey was conducted in the dry season when fishing with nets is more commonly practiced because the sea is relatively calm. Therefore, these activities are more likely to be emphasized by fishermen responses during this time of year. However, it is still important to note that the three most common forms of fishing are nets that entangle many types of organisms in addition to the target species.
Squid traps (35%) are the next most commonly reported type of fishing among the fishermen surveyed. Squid traps are more commonly used in the rainy season when they can be weighted and baited and dropped on the sea floor, then collected later with less chance of loss in rough seas than nets. Therefore, their use may have been overlooked by some of the fishermen because the survey was administered at a time of year when they are not often used.
Hook and line fishing (22%) was listed by over one-fifth of the sample. However, personal observation and semi-structured interviews indicate that almost all households fish using hook and line, although it may contribute only a small amount of food to the household. Residents often fish from piers, or the bank of rivers or estuary areas with fishing line tied around a plastic bottle and a hook on the end. They often catch mud crabs and other brackish water species which are usually for household consumption or feed for household animals in small numbers; too few to sell to a fish buyer or at market. Gleaning is also practiced by many households, although only reported by 4% of the surveyed sample. Older women and children often walk along the banks of rivers, estuaries and sandy beaches during low tide and collect various types of shellfish and shells (with no organism). The shells are sold directly or made into handicrafts on a small scale and then sold. Shellfish that are collected by gleaning is usually consumed by the household. Both gleaning and hook and line are considered part of daily life for most residents, not necessarily a livelihood and therefore, might not be captured by the survey even though respondents were asked to mention all types of fishing that contribute to their household.
Table 3. Number of type of fishing activities
Village One Two Three Four Five N
1 33.3 38.1 14.3 14.3 - 21
2 28.6 35.7 7.1 7.1 21.4 14
3 8.3 50.0 41.7 - - 12
4 16.7 44.4 22.2 16.7 - 18
7 18.8 31.3 28.1 18.8 3.1 32
Overall 21.6 38.1 22.7 13.4 4.1 97
This data suggests that within fishing households in the Program villages, residents practice numerous types of fishing. The advantage of this is that fishermen target several species, located in varying habitats, changing seasonally, and using different gear types, rather than stressing the same resource, or set of resources, continually. In addition, fishers that practice several types of fishing are more apt to learn a new type of fishing in order to adapt to changing conditions of the coastal and marine ecosystems. One example of fishermen adapting in the SCL Program villages is the jelly fishery. Jelly fishing was not identified during baseline data collection or the initial Participatory Rapid Appraisal, both conducted in 2005, but increasing numbers of fishermen have participated in this fishery in the past two seasons, from October till February (Crawford and Dunbar 2006). In this case, fishermen’s willingness to adapt to changes in environmental conditions illustrates their resilience without abandoning their way of life as fishermen.
INTER-VILLAGE VARIATION IN FISHING PRACTICES
Although fishermen in all Program villages practice the same types of fishing, there were relative percentage differences among villages. The following three types of fishing showed statistically significant differences between villages: shrimp net (chi-square = 40.6, df = 4, p<0.001),
mangrove crab trap (chi-square = 36.7, df = 4, p<0.001) and squid trap (chi-square = 37.0, df = 4, p<0.001). These differences most likely reflect the variations in habitat adjacent to each of the villages. For example, in Village 4 fishermen report no fishing with squid traps, usually placed offshore, but over one-quarter (28%) report fishing with crab traps in mangroves. Village 4 is located adjacent to an area of mangroves that shelter the village from the open water. The mangroves have passages cut into them for boats to travel between the village pier and the open water and provide healthy fishing grounds in closer proximity to the pier than offshore grounds. Similarly, shrimp net use is relatively low (10%) in Village 1 while crab net use (67%) is reported by two-thirds of the fishermen in this village. Although these nets are similar, the crab net is more often set in estuarine locations which are abundant adjacent to Village 1 a river empties out into the ocean, forming a large estuarine area, ideal for setting shrimp nets.
CHANGES SINCE INITIAL SOCIO-ECONOMIC SURVEY
While addressing changes in fishing since the baseline survey, it should be noted that methodological issues may have affected this data in addition to changes in the fishery in the survey area. First, there are significant seasonal changes in the types of fishing practiced and number of fishers in the SCL Program villages. Although the question in the survey asked the respondent to report all types of income in the past year, fishermen that do not fish year round may be less likely to report income from fishing. In addition, during the time of the follow up survey, many fishermen went to other provinces to fish. Some of their wives accompanied them to the other fishing grounds which resulted in omitting these households from the sample because there was no one to survey. Those wives that remained in the Program villages were more likely to be away from the house when the survey was administered because their children were also at school at this time which allowed them to run errands away from the house.3
Another change that could have affected survey results was higher than normal gasoline prices when the follow up survey was administered, which could also contribute to the decrease in reported fishing between the two time points. In semi-structured interviews, numerous fishermen noted that gasoline prices were high and significantly decreased their revenue from each trip. One respondent from Village 2 stated that he was less likely to go out to fish recently because there were more boats at his usual fishing spots and it was too costly for him to use the gasoline to get to these spots if he would get a smaller portion of the fish because of the increased crowds. This response highlights a contradiction between interview responses and observations. Several respondents noted the presence of more boats than before the tsunami, and fishermen stated that more fishermen were out fishing. However, there was a significant decrease in number of reported fishing households in the survey data. This contradiction could be due to a
methodological oversight that sampled less fishing households for reasons described above or it could be that many fishermen observed this increase in fishing and have left the fishery in response.
Another difference since the baseline survey is the absence of several aid agencies from the area. During the baseline assessment, representatives from numerous aid agencies were present in the Program villages and many aid projects were beginning or underway. Several of these projects included donations, especially of boats and gear for fishermen. As mentioned above, many households practice some type of fishing even if it contributes a relatively small percentage to total household income. Therefore, that segment of households that are only occasionally involved in fishing may have been more likely to report fishing income during the baseline assessment in order to increase their likelihood of receiving donations of fishing productive materials. These materials could immediately be put to use, helping residents supply food (either directly or indirectly) and income to facilitate their recovery.4 During the follow up assessment, there were fewer, if any aid agency representatives and the frenzy of donations had passed, resulting in fewer households reporting small contributions from fishing during the follow up survey.
Supporting the data in the survey were several statements during semi-structured interviews that weather conditions were less conducive to fishing in the years since the tsunami. Both fishermen and non-fishermen remarked that there were more days, even during high fishing season, when they could not go out to sea due to wind, waves and/or storms. It is undocumented whether this
3
There was an attempt to include households where people were away from their homes during daytime hours but returned in the evening. However, these households were more difficult to survey and therefore, it can be assumed that they are not proportionally represented in the sample.
4
observation is truly the case or merely the perception of residents, but the sentiment was echoed several times by respondents in all SCL Program villages. This perception, however, may influence some fishers to rely less on fishing for income or exit the fishery entirely. In addition, it may be coincidence that the two full years after the tsunami have had weather less conducive to fishing and subsequent years may be better, with more fishermen fishing and fishing more often.
It is, however, important to observe differences in data on fishing type and number of types of fishing between the baseline and follow up assessments. There is a statistically significant difference in the mean number of fishing types reported by survey respondents in the baseline and follow up surveys (two tailed t-test = 10.8, df = 540 p<0.001). A closer evaluation of the data further illustrates this decrease, as two thirds (60%) of fishermen in the sample reported one or two types of fishing in the follow up survey (2007). In contrast, over three quarters (77%) of fishermen surveyed for the baseline assessment reported that three or more types of fishing contribute to household fishing income/food. Figure 1 further illustrates that less important types of fishing, with respect to income generation, were less likely to be reported during the follow up survey because hook and line was reported by almost half of surveyed households involved in fishing (49%) during the baseline survey and just over one fifth (22%) in the follow up
assessment.
Figure 1. Percent Distribution of Fishing Types (2005 and 2007)
0
Crab Net Shrimp Net Fish Net Squid Trap Hook and Line
Hook and line fishing usually serves as a supplementary form of fishing and its catch is often used for household consumption or feed for household animals. Therefore, hook and line fishing is very common in fishing households but usually forms a small overall percentage of income and food source for a household and, therefore, may serve as a proxy for assessing respondents’ likeliness to include fishing types with smaller contributions.
Figure 2. Percent Distribution of Number of Fishing Types (2005 and 2007)
0 5 10 15 20 25 30 35 40 45
One Two Three Four Five Six Seven
Number of Fishing Types
P
e
rc
e
nt
a
ge
of
H
ous
e
hol
ds
2005 2007
Interesting to note is the relative frequencies of reported fishing types at each time point to assess relative percentages of coastal and marine resources and habitats that are targeted most often by fishermen in SCL Program villages. During the baseline survey, shrimp nets (76%), crab nets (68%) and fish nets (57%) were the most often reported types of fishing, respectively. Fishing types most often reported during the follow up assessment were crab nets (53%), shrimp nets (49%) and fish nets (42%). This data suggests that the same broad type of fishing (using various types of nets), is most common at both time periods and the other types of fishing generally follow the same trend, although in smaller percentages in data from the follow up survey. A difference from the baseline to the follow up data is that “other” types of fishing were reported by one quarter (26%) of respondents in the baseline survey and less than ten (9%) in the follow up survey.5 This is further evidence that fishing types that contribute less to overall household contribution from fishing were less often reported during the follow up survey. Another difference between time periods is the addition of jelly fishing in the SCL Program villages, which illustrates (as stated above) fishermen’s ability to adapt to changing conditions of the fishery.
CONCLUSIONS
Given the data presented above and methodological issues, the conclusions stated here are preliminary and additional assessments of fishing in the SCL Program villages are likely to provide further information about changes in the occupation of fishing overtime. Seasonal
5
“Other” types of fishing were those types of fishing that were reported by less than 5% of respondents during the baseline assessment. For the follow up assessment, the same categories were used unless there was an additional type of fishing reported by over 5% of the
changes in relative rates of fishing pressure along with areas of fishing could have affected the survey results. However, the survey was conducted during the dry season when weather conditions are better for fishing. This could result in fewer surveys conducted in households involved in fishing. Another seasonal effect on the data could be that fishermen are more likely to report the dominant form of fishing and forget to report types of fishing that contribute smaller percentages to overall fishing income and food.
The prominence of fishermen fishing in areas away from local fishing grounds could be due to a decrease in fish catch in fishing grounds closer to the SCL Program villages or it could be a reaction to more boats and fishermen at nearby fishing grounds during the initial recovery period. During baseline data collection, fishermen that were interviewed did not mention going to other provinces to fish. Although this does not rule out that traveling to fishing grounds is not a common occurrence, it does suggest that this practice was more frequent in the area during follow up data collection than when the baseline survey was administered. Therefore, this may be a trend that continues to attract fishermen to grounds in other provinces that could impact both the local fishery and local economy of the SCL Program villages in the future. For example, those
fishermen that are fishing in far away fishing grounds may decide to move from Suk Sumran with their families. These fishermen are likely to be more experienced fishers, to be knowledgeable about a greater number of fishing grounds, and financially better off, in order to front funds needed to travel to other provinces for fishing. However, current data cannot determine the effect of these changes and additional studies could provide more information on longer term impacts on fishing.
Those households that do rely on fishing, practice several types and exhibit the ability to adapt to changes in coastal and marine resources and habitats. This suggests that fishermen, and the fishery in the SCL Program villages, is relatively resilient with respect to economic and social concerns. However, the data presented above implies that fishing practices may stress coastal and marine resources overtime. The prominence of net fishing (various types), which entangles all organisms larger than a certain size, could cause biophysical stresses on the fishery and/or coastal ecosystem in the future. In addition, although the increase in jelly fishing indicates that fishermen are more resilient in terms of adapting to biophysical changes in the fishery, the prominence of jellyfish indicates the absence of other organisms of higher trophic levels and a shift in the marine ecosystem (Pauly and Christensen 1995). Although it is not clear whether the increase in jelly fishing is due to an increase in number of jellyfish because fishermen perceive this practice as more profitable than other types of fishing, this trend of fishing has been associated with fishing “down the food chain” in other fisheries. If jellyfish populations are increasing, this suggests that the fishery is less robust, with fewer higher trophic level organisms than before the prominence of jellyfish and therefore, less ecologically resilient (Pauly et al 2003). However, the biophysical state of the fishery can only be determined by an analysis of coastal and marine ecosystems that is beyond the scope of this report.
REFERENCES CITED
Crawford, B. and C. Dunbar. 2006. The Andaman Sea jelly fishery: resiliency and adaptability of
longtail fishers following the tsunami. Fishbytes: The Newsletter of the Fisheries Center –
University of British Columbia 12 (1): 1-2.
Pauly, D., J. Alder, E. Bennett, V. Christensen, P. Tyedmers, and R. Watson. 2003. The future for fisheries. Science 302 (5649): 1359-1361.
Pauly, D. and V. Christensen. 1995. Primary production required to sustain global fisheries.
Nature 374 (6519): 255-257.
Pollnac, R.B. and D.M. Kotowicz. 2005. Initial Rapid Assessment of Tsunami Affected Villages,
Tambon Kamphuan, Suk Samran District, Ranong Province, Thailand. Coastal
Resources Center, University of Rhode Island Asian Institute of Technology, University of Hawaii, Hilo. U.S. Agency for International Development.
Pomeroy, R.S., B.D. Ratner, S.J. Hall, J. Pimoljinda, V. Vivenkanandan. 2006. Coping with disaster: Rehabilitating coastal livelihoods and communities. Marine Policy 30: 786-793. Salas S. and D. Gaertner. 2004. The behavioural dynamics of fishers: management implications.
Follow Up to Baseline – #3 Perceptions of Fishing
INTRODUCTION
In the aftermath of the tsunami, it was debated whether fishermen would be reluctant to resume fishing due to concerns about safety or dissatisfaction with the occupation. However, during baseline data collection, observations and survey results suggested that fishermen were going back to fishing when they received replacement gear and boats. In order to assess attitudes toward fishing in the aftermath of the tsunami, we asked individuals in households where fishing contributed as a primary or secondary income to a household, the following five questions:
1. Would you advise a young person to become a fisher today? 2. Do you like fishing?
3. If you had the opportunity to change the primary source of your household’s income to one that provided the same amount of income as fishing, would you change? 4. If your household’s income had to be derived from a source other than fishing, what
type of work would you prefer to do? 5. Have you considered exiting the fishery?
In addition, to evaluate attitudes toward safety in the occupation of fishing, surveyors asked respondents to rate the following statement on a Likert scale with possible responses ranging from ‘Strongly Disagree’ to ‘Strongly Agree’:
1. There is no need to worry when a fisher goes out fishing, the job is very safe. Do you agree or disagree?
ATTITUDES TOWARD FISHING
Since the tsunami, much of the recovery effort has been geared toward helping fishermen get back to work, especially in the form of replacing boats and gear. During semi-structured interviews, respondents frequently commented about significantly more boats at piers and local fishing spots since the tsunami. Lack of coordination among donors and miscommunication resulted in numerous fishermen receiving more than one boat and widows in fishing households receiving boats with no adult male in the household to use it. In one interview, a family where the head male was a mechanic specializing in boat motors and not involved in fishing prior to the tsunami, received a donation boat. This man began fishing because it was the quickest and most easily accessible way for him make money and begin saving to replace equipment to fix boat motors. This case and others indicate that because fishing gear and boats were available, residents took advantage of this opportunity to begin making income quickly, regardless of fear of another tsunami and intention to remain in the fishery.
Table 1. Percent Distribution of Attitudes toward Fishing
Village
residents recognize the addition of more boats, and anticipate it becoming more difficult to make enough money from fishing to provide for their families. For example, one respondent observed, “now there are ten boats trying to fish from one spot and only three get fish”. Almost one-fifth (20%) of respondents in the sample reported that they would not change their primary source of income from fishing. More than one-third (37%) of respondents report that they like the
occupation of fishing. These values are considerably lower than those reported by fishers in other countries in Southeast Asia (Pollnac et al 2001). In addition, almost three quarters (73%) of respondents have considered exiting the fishery.
Table 2. Percent Distribution of Attitudes toward Fishing among males of fishing households
Among only males in households where fishing is a primary source of income, responses to all four of these questions favors fishing more than when the questions were asked of both males and females in fishing households. Approximately one quarter (26% each) of fishermen would advise a young person to become a fisher and would not change their occupation from fishing. Less than half (46%) of fishermen surveyed, report that they like fishing. Seventy percent of the sample report that they have considered stopping fishing. Although the responses to this question imply dissatisfaction with fishing, it is important to note that these responses are from males that were fishing as a primary or secondary source of income, at the time of data collection.
Observations and interviews indicate that although residents acknowledge an increase in boats and fishers, and are aware that this increase implies less fish to be caught by each fisher, almost half of the surveyed sample continue to rely on fishing as a primary or secondary source of income.
There are statistically significant intervillage differences in percent of respondents who ‘like fishing’ for all heads of households (males and females) and only males of fishing households (Tables 2 and 3; chi-square = 25.2 df = 8, p<0.001 for all respondents and chi-square = 27.0, df = 8, p < 0.001 for males from fishing households). Notably, responses in Village 2 are lowest (5% in Table 2 and 8% in Table 3) and highest in Village 4 (62% in Table 2 and 100% in Table 3). This discrepancy in responses between villages could be explained by the difference in concentration of households in each village and relative experience with the tsunami. Whereas, much of Village 4 is located adjacent to the ocean, Village 2 has a smaller portion of houses adjacent to the coast. Observations and interviews indicate that village leadership in Village 4 represents interests of fishermen more often than those of Village 2. For example, one respondent reported that an aquaculture project (not funded by the SCL Program) was headed by a resident in the inland area of Village 2 but infrastructure for it was located in the coastal section.
of the tsunami. Although there was significant damage to some houses, boats and gear in this section of the village, most houses were left intact.
PREFERRED OCCUPATION (IF NOT FISHING)
Fishermen were asked what type of occupation in which they would prefer to participate if their income had to be derived from a source other than fishing. The responses of 81 males from fishing households are represented in Figure 1.
Figure 1. Preferred occupation if not fishing among males of fishing households
Chosen Occupation (if not fishing)
63
30.9
12.3
1.2 1.2 1.2
0 10 20 30 40 50 60 70
Farming Trading Livestock Unskilled Labor
Skilled Labor
Other
P
e
rcent of Respondents
Almost two thirds of the respondents chose farming (63%) as an alternative if their income could not be derived from fishing. One possible reason for this selection is that interviews suggest farming, especially of rubber, is a relatively lucrative livelihood in the Program villages. Almost one third (31%) of the surveyed fishermen chose trading and twelve (12%) percent chose raising livestock as an alternative livelihood. It is interesting to note that less than two percent of the sample chose both skilled and unskilled labor (1.2%). Earlier studies of job satisfaction in fishing note that independence and being one’s own boss are characteristics of alternative occupations that are most likely to satisfy former fishermen (Pollnac and Poggie 1988; Sievanen et al. 2005). Supporting these ideas, the most common alternative sources of income to fishing in this survey - farming, trading and raising livestock - each preserve aspects of independence and being one’s own boss. Alternatively, labor often involves working with and for others, thereby sacrificing the characteristics of independence and being one’s own boss.
ATTITUDES TOWARD THE SAFETY OF FISHING
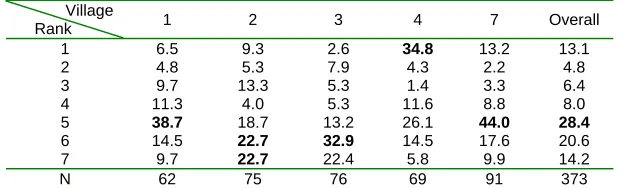
Table 3. Percent Distribution of Attitudes toward the safety of fishing* * Most common (modal) responses for each question are in bold.
Overall, respondents most often ‘disagreed’ (32%) that fishing was safe and there is no reason to worry when a fishermen goes out to sea. Along with over one-fifth of respondents who ‘strongly disagreed’ (22%) overall, over two-thirds (61%) of the sample do not think that fishing is safe (adding the percentage of responses for ‘slightly disagree’, ‘disagree’ and ‘strongly disagree’). There are statistically significant differences among villages (Kruskall-Wallis one-way analysis of variance coefficient=27.5, df=4, p<0.001). Analysis of responses by village show Village 7 in contrast to the others, where respondents in this village most often ‘agree’ (44%) with the
statement that fishing is safe. In addition, although respondents most often ‘strongly disagreed’ in Village 1 (29%), almost one quarter (24%) from this village ‘agreed’ with the statement. Villages 1 and 7 also contain the greatest percentage of households that report fishing among livelihoods that contribute to household income and food generation. This data suggests that those villages where more households are engaged in fishing are also villages where more people are likely to agree that fishing is safe.
Table 4. Percent Distribution of Attitudes toward the safety of fishing among males of fishing households* * Most common (modal) responses for each question are in bold.
Among only males of fishing households, there are no statistically significant differences between villages in response to the statement that fishing is safe (Table 4). Over one quarter of fishermen (27%) sampled ‘strongly disagreed’ that fishing is safe, but over one fifth (22%) of the sample also ‘agreed’ with the statement. However, over half of the fishermen in the sample (57%) do not agree that fishing is safe. These attitudes toward the safety of fishing indicate a general
disagreement that fishing is safe which might be affected by the tsunami. In addition, many fishermen, during interviews, noted more days this year when conditions were not conducive for fishing due to waves and storms. The experience with the tsunami in addition to the turbulent conditions of the current year may have influenced responses during the time of the survey.
CHANGES SINCE INITIAL SOCIO-ECONOMIC SURVEY
Attitudes toward the occupation of fishing and safety in fishing were predicted to change in the aftermath of the tsunami. Studies of other hazards suggest that perceptions of hazards change with increasing time after the hazard occurs and actions pertaining to risk of future hazards change as well (Tobin and Montz 1997). In an area such as Suk Sumran where almost half of the households are engaged in fishing, it is important to assess changes in perceptions of fishing because of its impact on fishing and hazard preparedness.
Table 5. Percent Distribution of Attitudes toward Fishing (2005 and 2007)6
Year
Responses are not statistically significant between the baseline and follow up surveys for whether to advise a young person to fish and those that would not change jobs for the entire sample (Table 5). Results indicate slightly less positive attitudes toward fishing in the follow up surveys than the baseline for both questions (change of –3.4% ‘would advise fishing’, and –2.5% ‘would not change job’). There is a statistically significant difference in responses from baseline to follow up surveys on whether the respondent ‘likes fishing’ (chi-square= 14.8, df = 1, p<0.001).
Eighteen percent (18%) fewer respondents noted that they ‘liked fishing’ during the follow up survey. It is important to note the change in sample size between time periods as well (baseline = 401, follow up = 161) which suggests that others many more survey respondents were engaged in fishing during the baseline survey. Overall, however, these changes suggest less positive views of the occupation of fishing.
Table 6. Percent Distribution of Attitudes toward Fishing among males of fishing households (2005 and 2007) 1
Similar to the results for all respondents, responses from males of fishing households was not statistically significantly different between the baseline and follow up surveys for the questions whether to advise someone to go into fishing and if they would not change jobs (Table 6).
However, the percent of fishermen that would advise a young person to go into fishing decreased (-3.9%) while the percent of surveyed fishermen who would not change jobs increased (4.8%). Although these changes are not statistically significant, it may indicate that there is less confidence in the future of the fishery (i.e. prospects for the livelihood of a young person) but those who are already fishing, will continue to do so. Of those that do continue to fish, however, thirty five percent (-35%) less of the sample stated that they ‘liked fishing’. This difference between responses to the baseline and follow up surveys is statistically significant (chi-square = 26.2, df = 1, p<0.001) which suggests that fishermen are less satisfied with fishing than they were during the baseline survey.
6
The decrease in attitudes of fishers toward fishing may be due to sampling differences between the baseline and follow up surveys. Specifically, the baseline survey was conducted during the rainy season when fishermen were more likely to be surveyed because they were not out fishing as often. The follow up survey was administered during the dry season when more fishermen were out fishing more often and some were fishing in other provinces. Therefore, these fishermen were not surveyed which could have affected results.
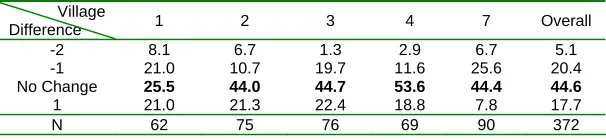
Table 7. Percent Distribution of Attitudes toward the safety of fishing (2005 and 2007)
Village
Responses of the entire sample regarding the safety of fishing show statistically significant differences between the baseline and follow up assessments (Kruskall-Wallis one-way analysis of variance coefficient=41.9, df = 1, p<0.001). The change in percentage of respondents who ‘strongly disagree’ that fishing is safe decreased by over one fifth (-23%) and the percentage of the sample that disagreed (‘strongly disagree’, ‘disagree’ and ‘slightly disagree’) decreased from 80% (baseline survey) to 61% (follow up). These results suggest that fewer residents that were surveyed feel that fishing is a dangerous occupation but a majority of respondents still do not agree that fishing is safe.
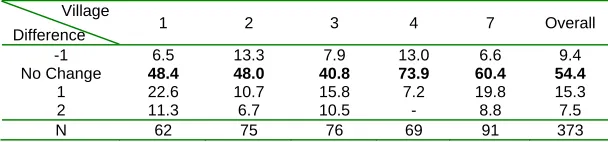
Table 8. Percent Distribution of Attitudes toward the safety of fishing among males of fishing households (2005 and 2007)
Among males of fishing households, responses regarding the safety of fishing also showed a statistically significant difference between baseline and follow up responses. However, the significance is weaker than for the change among all survey respondents (Table 8; Kruskall-Wallis one-way analysis of variance coefficient=8.2, df = 1, p<0.01). The largest percent
difference is a decrease of over one-fifth (-22%) of fishermen who ‘strongly disagree’ that fishing is safe. The results for fishermen also follow the same trend as for all respondents in the percent of the sample who disagree (all levels of disagreement) that fishing is safe. Over three quarters of the sample (77%) disagreed during the baseline survey and just under two thirds (57%)
disagreed with the statement during the follow up survey. Similar to results for the entire sample, however, over half of the respondents still do not agree that fishing is safe.
Table 9. Percent Distribution of Preferred Occupation if not fishing among males of fishing households (2005 and 2007)
Year Farming Trading Livestock
Unskilled Labor
Skilled
Labor Aquaculture Other N 2005 38.4 45.5 2.7 6.3 1.8 4.5 - 112 2007 63.0 30.9 12.3 1.2 1.2 - 1.2 81 Change* 24.6 -14.6 9.6 -5.1 -0.6 -4.5 1.2
Farming was commonly preferred during the baseline and follow up assessments, as an
occupation during the baseline assessment was trading (46%). Respondents during the follow up assessment chose trading as an alternative occupation fifteen (-15%) less often, and farming one quarter (25%) more often than during the baseline survey. Several interviewees noted the
number of new small stores during the follow up survey, often started by residents that received small loans. It is possible that fishermen observe this increase in trading and are less likely to choose it as a replacement for fishing. Another notable difference between baseline and follow up responses to this question is that no respondents stated they would like to practice aquaculture if not fishing during the follow up survey. However, five percent (5%) of the fishermen surveyed during the baseline, selected aquaculture. This difference could be accounted for by the large number of aquaculture projects that failed during the reconstruction period between the baseline and follow up surveys.
CONCLUSIONS AND RECOMMENDATIONS
Attitudes toward fishing are less positive overall, than in other similar studies of Southeast Asian fisheries (Pollnac et al 2001). However, comparing data from the baseline and follow up surveys shows that in some aspects, specifically attitudes toward the safety of fishing, perceptions were less negative during the follow up survey. Again, there is no pre-tsunami data for comparison so it cannot be determined whether residents in SCL Program villages were more concerned about the safety of fishing in the early months after the tsunami and attitudes are now returning to those of the area before the tsunami or if there is another reason for the change.
Relative to other studies, there was a small percentage of fishing households that would not change occupations from fishing and a high percent of respondents that have considered stopping fishing. These views could be a result of an initial increase in fishers and boats as discussed above, which may subside overtime with more residents returning to pre-tsunami occupations. In addition, the continued influx of outside assistance may influence people to respond that they are willing to try a new occupation if they think there could be training, gear, or other assistance available for additional types of livelihoods. Although this is less of a concern in the follow up data than during the baseline because there was more opportunity to participate in alternative livelihood projects, many households continue to participate in more than one type of livelihood and this could affect responses to these questions. In addition, those fishermen that like fishing were more likely to be out fishing when the survey was administered for the follow up which could also have affected the results of these answers. However, because the responses are comparable to the baseline information overall, it is not likely that these methodological aspects significantly affected results of this survey. Low values of satisfaction with fishing can also be a sign of willingness of fishers to practice alternative livelihoods in the future which should be taken into consideration for future livelihood projects in Suk Sumran. In addition, the results presented here suggest preferred alternative sources of income that might satisfy those fishermen willing to leave the fishery.
Responses to this survey indicate that both residents of the SCL Program villages and fishermen view fishing as an unsafe occupation. However, the severity of theses views seems to be
lessening with an increase of time since the tsunami and may continue to do so. Therefore, continued monitoring of attitudes in general toward fishing would provide further information about how residents’ perception of fishing continues to change overtime after the tsunami.
REFERENCES CITED
Pollnac, R.B., R.S. Pomeroy and I. Harkes. 2001. Fishery policy and job satisfaction in Three Southeast Asian fisheries. Ocean and Coastal Management 44(5): 531-544.
Sievanen, L., B. Crawford, R.B. Pollnac and C. Lowe. 2005. Weeding through Assumptions of Livelihood Approaches in ICM: Seaweed Farming in the Philippines and Indonesia.
Ocean and Coastal Management 48: 297-313.
Follow Up to Baseline – #4 Investment Orientations
INTRODUCTION
The SCL Program implemented various types of livelihood interventions in order to facilitate recovery of residents of the Program villages. One type of intervention is village banks and distribution of micro-loans for individuals to have access to money that they can invest most appropriately for their needs. Asking respondents how they would invest a sudden windfall of money, can provide information for Program managers about the types of investment priorities for residents in the Program villages. In order to assess investment orientations, villagers were asked the following two questions:
1. If you were to suddenly inherit or win 9,000B in a lottery, what would you do with this money?
2. If you were to suddenly inherit or win 110,000B in a lottery, what would you do with this
money?
Respondents were asked these questions as free-form questions. Answers were then grouped into the following categories and multiple responses were recorded.
INVESTMENT ORIENTATION
Table 1 illustrates the percent distribution of all responses to how they would invest in 9,000B. This value was chosen because preliminary interviews (during baseline data collection) indicated that 9,000B was an approximation of average monthly income in the Program villages.
Table 1. Percent Distribution of Investment Orientation (9,000B)7
Village
There were 744 responses to this question which were recorded and categorized as presented in Table 1. The most common response was to invest the money in productive goods. Productive goods are defined (for the purposes of this categorization) as anything that is needed or can be used for some type of livelihood and/or food generation activity. Over forty percent (43%) of respondents reported that they would invest in productive goods. One fifth (20%) of the sampled residents stated that they would save the money for future use. The next most common answer was to save the money for children (18%), and then pay off existing debt (14%). Just over five percent (6%) of the sample reported that they would use the money to purchase material goods. Less than one percent (0.3%) of the respondents did not wish to answer.
Although the most common response in each village is to invest in productive goods, intervillage differences are statistically significant (Kruskall-Wallis one-way analysis of variance
coefficient=477.0, df = 5, p<0.001). One notable difference is that over half of the sample in Villages 3 and 4 (56% and 54%, respectively) reported that they would invest in productive goods and only around one third, in Villages 1, 2 and 7 (34%, 39% and 34%, respectively). Villages 1, 2 and 7 each experienced direct damage from the tsunami (e.g. houses and boats were swept
7
away). These results suggest that respondents in these villages want more productive goods, but it cannot be determined from this information whether this is because they are still recovering or if they wish to expand with additional productive goods. However, supporting the idea that at least some residents would use the money for some type of occupational recovery, during semi-structured interviews, one interviewee in Village 7 stated that he was still saving money in order to replace machinery that was lost during the tsunami.
Another difference to note is about half of the respondents in Villages 1 (57%) and 2 (48%) responded that they would save 9,000B, either for the future or for their children. In contrast, only about thirty percent of respondents in Villages 3 (30%), 4 (30%) and 7 (31%) reported that they would save for the future or for their children. This difference is less likely to be due to the effects of the tsunami because Villages 1, 2, and 7 had more significant structural damage than Villages 3 and 4. An additional difference is that one quarter (25%) of respondents in Village 7 also reported they would use the money to pay off debt, which is a much higher percentage than the other villages. This may be a result of more opportunities for residents in Village 7 to take on debt for recovery or that respondents in Village 7 or more concerned about paying back debt than individuals in other villages.
Table 2 shows the percent distribution of respondents’ choices for investment if given 110,000B. This value was chosen as an approximate average one year’s income in the Program villages, also determined during baseline data collection.
Table 2. Percent Distribution of Investment Orientation (110,000B)8
There were 744 responses to this question with almost forty percent (39%) of the respondents reporting that they would invest in productive goods. One fifth (20%) of the sample responded that they would save for the future and another one fifth (20%) would save the money for their children. Almost fifteen percent (14%) would use the money to pay off existing debt and less than ten percent (7%) would buy material goods. Similar to responses for 9,000B, less than one percent (0.1%) did not wish to answer the question.
Intervillage responses between villages are statistically significant (Kruskall-Wallis one-way analysis of variance coefficient=395.4, df = 5, p<0.001) although the most common response in each of the villages is to invest in productive goods. Responses between villages regarding savings are not as distinctly different for investment choices for 110,000B. Saving, either for the future or for children, was a less common response than with 9,000B with between 35% (Villages 2 and 3) and 47% (Village 1) of each village reporting that they would save the sum of money. Similar to responses for 9,000B, more responses in Village 7 were to pay off debt (22%)
compared to the other villages where percentages ranged from 9% (Village 3) to 13% (Village 4).
8
Figure 1. Percent Distribution of Overall Investment Choices
Figure 1 shows investment choices for both questions (9,000B and 110,000B) for 1488
responses. These results show that the most common response overall is to invest in productive goods (43%). One fifth of respondents would invest money in each, saving for the future (20%) or saving for their children (18%) which shows that after investing in productive goods, savings are also a high priority. Paying off debt is less of a priority for respondents with just less than fifteen percent (14%) of responses and only six percent (6%) would spend the money on material goods. Differences between villages are statistically significant for responses to both questions (Kruskall-Wallis one-way analysis of variance coefficient=56.4, df = 4, p<0.001) and reflect differences discussed above for responses to each question.
FACTORS ASSOCIATED WITH VARIABILITY IN INVESTMENT ORIENTATION
The following table (Table 4) illustrates bivariate correlations between types of investment orientation and demographic variables that have been associated with each other in previous studies including age, education and involvement in fishing (Pollnac 1989). Religion, gender, fatalistic views and exposure to media are other factors that could affect investment orientation and are therefore, included as exploratory variables. Finally, experience with the tsunami is expected to affect an individual’s outlook on the future which could impact investment orientation. Variables pertaining to tsunami impacts are personal injury, member of household killed, and member of household injured during the tsunami.
This analysis used natural dichotomies (e.g. gender, religion (Muslim or non-Muslim, income from fishing, etc.) or calculated dichotomies. Dichotomies were formed around the median value (age (38), years of education (6), listening to radio news (0.5) and reading newspaper (7)). Due to non-normal variance in responses and outliers, values are the Spearman’s Correlation Coefficient. Responses to investment choices for 9,000B and 110,000B were analyzed as one variable and multiple responses were recorded with each answer weighted evenly.
Table 4. Correlations between selected variables and investment choices**
* Correlation is significant at p>0.01 (two-tailed)
**N is calculated by response, not individual, and ranges from 1476-1488.
Bivariate correlation coefficients are presented in Table 4. These correlations indicate that those individuals who would invest in material goods also tend to be younger, from households that fish, listen to news on the radio more often and are less likely to have had a household member injured during the tsunami. Individuals reporting that they would pay off debt with a windfall of money were more likely to be Buddhist, not fatalistic, and closely affected by the tsunami (i.e. were themselves injured or had a member of their household killed or injured during the incident). Older, Muslim, fatalistic males with less education who listened to radio news less often were more likely to report that they would invest in productive goods. Individuals reporting that they would invest in productive goods were also more likely to receive personal injury, lose a
household member or have an injured household member due to the tsunami. Respondents that report they would save the money for the future were less likely to live in households that gain income from fishing and more likely to have experienced a death in their household due to the tsunami. Individuals that have more education, and are Muslim tend to report that they would save money for their children. Those individuals reporting that they would save money for their children also tended not to be fatalistic, were more likely to be from households that did not gain income from fishing, listened to radio news and read newspapers more often.
Of specific interest to the SCL Program are relationships between investment orientations and experience with the tsunami. The correlations above indicate that all three variables pertaining to the tsunami are positively correlated with reporting intentions to pay off debt and negatively correlated with responses to invest in productive goods. This association suggests that those who were directly affected by the tsunami over two years prior to this survey prioritized paying off their debt over other investment choices. These results could be an indication that those individuals that were closely affected by the tsunami accrued debt following the tsunami and now want to pay it off. Supporting the notion that more capital is needed for investment in productive materials, microfinance loans through village banks implemented by the SCL Program, prioritized loans for households that were more severely affected by the tsunami in some cases. Also, many aid projects prioritized households that were directly affected by the tsunami when donating productive materials (e.g. boats) or allowing participation in recovery livelihood projects.