RESEARCH FOUNDATION INTERNATIONAL (INDIA)
Editor
Dharam Vir
Contemporary Social Sciences
Volume 24, Number 1 (January-March), 2015
(An Autonomous, Registered (1972), Recognized Charitable Organization of Social Scientists, Authors, Journalists and Social Activists)
Founder
Editorial Board
FOUNDERPadma Shri S. S. Shashi, Executive Chairman, Research Foundation International (India) and Former Director General, Publications Division, Government of India, ‘Anusandhan’, B-4/245, Safdarjung Enclave, New Delhi–110 029, India.
EDITOR
Dharam Vir, Former Head, Department of Post-graduate Studies and Research in Sociology, Nanakchand Anglo Sanskrit College, CCS University, Meerut–250 004, India. ASSOCIATE EDITORS
Sanjeev Mahajan, Department of Post-graduate Studies and Research in Sociology, Nanakchand Anglo Sanskrit College, Ch. Charan Singh University, Meerut–250 004, India. Richa Singh, Secretary (Academics), Social Science Division, Research Foundation International (India), Delhi–110 029, India.
MANAGING EDITOR
Kamlesh Mahajan, Department of Sociology, Ismail National Mahila Post-graduate College, Ch. Charan Singh University, Meerut–250 004, India.
BOOK REVIEW EDITOR
S. K. Gupta, Professor of Sociology (Retired), Panjab University, Chandigarh–160 014, India.
CONSULTING EDITORS
Dr. A. K. Singh (Assistant Coordinator, IGNOU Centre, Rohini, Delhi); Prof. B. K. Nagla (M. D. University, Rohtak); Prof.Bhoumik Deshmukh (University of Pune, Pune);Prof. I. P. Singh (Former Head of Anthropology, Delhi University, Delhi); Prof. I. S. Chauhan (Former Vice-Chancellor, Barakatulla University, Bhopal); Dr. László Vasa, Faculty of Economics and Social Sciences, Szent István University, Hungary; Dr. Mamta Singh (Academic Counsellor, IGNOU Centre, Rohini, Delhi); Dr. R. W. Sherman, Adjunct Associate Professor, Silberman School of Social Work, New York;Prof. S. S. Sharma (CCS University, Meerut); Prof. S. K. Gupta (Panjab University, Chandigarh); Prof. Satya Prakash (Department of Law, N. A. S. College, Meerut); Prof. Wang Xiaoyi (Director, Rural and Industrial Sociology, Institute of Sociology, Chinese Academic of Social Sciences, Beijing, China); Dr. Y. N. Sharma ‘Arun’ (Member, Sahitya Academy).
ISSN 0302-9298
1 Status of Rice Production in Jammu and Kashmir : An Economic Analysis
Mysir Jeelani Kaloo and Tapan Choure 1
2 Knowledge, Attitudes and Practices (KAP) towards Family Planning among Currently Married Women in Major States of India
Pramod K. Gupta and Sarita Verma 13
3 Plasma Technology in Textile : A Step towards the Green Environment
Arpita Kothari 29
4 Education for the 21st Century : The Singapore Context
Marc Jonet 49
5 The Efficiency of John Dewey’s Teaching Method in relation to Tourism and Leisure
Abbas Ardekanian and Abbas Hassani 79
6 Public Administration in Terms of Productivity and Efficiency : Innovative Practices in Service Delivery
V. Rama Krishna, R. Shashidhar and Muniraju M. 85
7 Human Resource Management in PSBs : The Need of the Hour
Sarita Aggarwal 93
8 Rural Society and Health Facilities
Rangoli Chandra 103
9 Sedition Law and its Draconian Effects
Geetika Garg 111
10 Overview of Work Life Balance and Workers Performance in Bali
Dewi Puri Astiti 121
11 Comparison of E-image and True Image of Printed Cotton Fabrics
Sarabjeet Kaur and Surabhi Mahajan 129
12 Research on Agricultural Products Trade Current Situation and its Competitiveness in China under Financial Crisis
Journal of National Development
Aims and Scope
The Journal of National Development (JND) is an interdisciplinary bi-annual peer reviewed & refereed international journal committed to the ideals of a ‘world community’ and ‘universal brotherhood’. The Journal is a joint effort of like-minded scholars in the field of social research. Its specific aims are to identify, to understand and to help the process of nation-building within the framework of a ‘world community’ and enhance research across the social sciences (Sociology, Anthropology, Political Science, Psychology, History, Geography, Education, Economics, Law, Communication, Linguistics) and related disciplines like like all streams of Home Science, Management, Computer Science, Commerce as well as others like Food Technology, Agricultural Technology, Information Technology, Environmental Science, Dairy Science etc. having social focus/implications.. It focuses on issues that are global and on local problems and policies that have international implications. By providing a forum for discussion on important issues with a global perspective, the JND is a part of unfolding world wide struggle for establishing a just and peaceful world order. Thus, the JND becomes a point of confluence for the rivulets from various disciplines to form a mighty mainstream gushing towards the formulation and propagation of a humanistic world- view.
Publication Schedule
The Journal of National Development is published in volumes of approximately 250-300 pages, divided into two bi-annual issues–summer and winter. Besides, a special issue in Hindi is also published every year to meet the demand of social scientists, both research scholars and teachers of Hindi speaking states of India.
Subscription and Business Correspondence
The annual subscription is ` 1000 in India and US$ 60 abroad, including postage by Speed-Post/Airmail. Special issue in Hindi is free with annual subscription. All the subscriptions must be prepaid in favour of The Journal of National Development, payable at
Meerut.
ISSN 0972-8309; NAAS Rating : 2.50; IBI FACTOR : 3.46
All correspondence pertaining to subscription, change of address, purchase of back numbers, books for review and advertisements should be addressed to :
The Managing Editor
Journal of National Development
D-59, Shastri Nagar, Meerut-250 004 (India)
Tel : 91+121-2763765, 2770765; Mobile : 91+9412200765, 91+99997771669
1
Status of Rice Production in Jammu and
Kashmir : An Economic Analysis
Mysir Jeelani Kaloo* and Tapan Choure**
Jammu and Kashmir is well acknowledged for both agricultural and horticultural, and has maintained a first-rate status in all the States of India, but at the equivalent time rice being a staple food for almost intact population is losing its status. Presentstudy was based on the secondary data in which linear multiple regression model used to understand the impact of area and irrigation on the production of rice in Jammu and Kashmir, the data has revealed that both the variables has shown 85% of variation caused in the rice production Jammu and Kashmir, but at the same time area under the rice production in Jammu and Kashmir is declining as there is continuously land diversion taking place from rice to horticultural one as a result every year government has to import at a large scale from the central pool.
[Key words : Rice, Jammu & Kashmir, Production, Multiple Regressions]
1.
Introduction
Jammu and Kashmir’s economy is predominantly dependent on agriculture and allied activities. The Kashmir valley is known for its sericulture and cold-water fisheries. Wood from Kashmir is used to make high-quality cricket bats, popularly known as Kashmir Willow. Kashmiri saffron is very famous and brings the state a handsome amount of foreign exchange. Agricultural exports from Jammu and Kashmir include apples, barley, cherries, corn, millet, oranges, rice, peaches, pears, saffron, sorghum, vegetables, and wheat, while manufactured exports include handicrafts, rugs, and shawls.
CONTEMPORARY SOCIAL SCIENCES, Vol. 24, Number 1 (January-March), 2015 * Research Scholar, School of Studies in Economics, Vikram University, Ujjain, Madhya
Pradesh (India) E-mail: <[email protected]>
it from the Great Plains of northern India. Along the northeastern flank of the Valley runs the main range of the Himalayas. This densely settled and beautiful valley has an average height of 1,850 meters (6,070 ft) above sea-level but the surrounding Pir Panjal range has an average elevation of 5,000 meters (16,000 ft).
Percentage growth rate in GDP of India and Jammu Kashmir (2009-10 to 2012-13)
Gross State Domestic Product (GSDP) of J&K state during 2012-13 (at current prices) has increased to Rs. 75574.31 crore (quick estimates) from Rs. 65758.52 crore (quick estimates) of 2011- 12 registering a growth of 14.93% during 2012-13. The growth as per advance estimates for the state during 2013-14 at current prices is projected at 15.54%. Similarly the State economy is expected to grow at 5.88% (advanced estimates at constant 2004-05 prices) during 2013-14 as compared to achievement of 5.51% in 2012-13 (quick estimates).
2.
Objectives of the Study
The objectives of this study are as follows :
1. To find out the Status, production and Productivity of Rice in Jammu and Kashmir from last one and half decade.
2. To find out the influence of area and irrigation (as variables) on the production of and productivity of rice in Jammu and Kashmir.
3. To find out the prevailing problems faced by the farmers in Jammu and Kashmir and finding out the possible solution to them.
3.
Research Methodology
multiple regression models used to find out the impact of area and irrigation on the production of rice in Jammu and Kashmir. Due to lack of data simple compound growth rate was used for to find out the area, irrigation and production for the year 2013 and 14.
4.
Status of Rice in the Jammu and Kashmir
Jammu and Kashmir has a unique distinction of introducing the land reforms. At that time about 1.82 lakh hectares of the land has been distributed. Out of which about 0.94 lakh hectares were distributed free of cost among the peasants with no much effort to be done. The state has abolished the absence of landlordism. Over the years a neo – land holders have come into existence which are comparable to absentee of land owners if not landlords holding large “jagirs”. The reform period in the Jammu and Kashmir has got twin objective of giving the cultivators his rightful place in the social system and also ensure more efficient utilization of state resources with an objective to achieve the self sufficiency in terms of rice production, although leaped forward from mere few lakh tones to 0.89 million tonnes.
(45) crore of rupees. Thus the cultivation of the rice in this region offers a great potential for its improvement, but at the same time there is a much worry to the State of J&K in terms of food grain deficiency as it has already touched to 40 percent which will grow in the future as the deficiency is the process which cannot be stopped, it is bound to happen as the farmers in the cash economy are more concerned about the benefits which derive them from investment in rice production to horticultural sector, it will be not surprising to see Kashmir growing Apples only and Bihar cultivating rice. The deficiency in food grains (Rice) can be reveled from the fact that the production of Rice in J&K is only seven (7) lakh metric tons where as the demand is eleven (11) metric tonnes hence there is a miss match in demand and supply which ultimately results in the inflation. The deficiency in the food grains has been attributed to rampant conversion of agricultural land and depleting efficiency of the land, as in Kashmir alone more than two lakh Kanals of agricultural land of the net sown area has been converted for commercial and other purposes, the only thing to cheer for the people of Jammu and Kashmir is that the net production of rice is increasing despite the land diversion as the methods of cultivation of rice has been shifted from traditional practices to the modern ones.
Table-1 : Production and productivity of rice Jammu and Kashmir (1999–2000 to 2013-14)
Year Production (000) lakh
tonnes
Area (ooo) lakh hectares
Productivity Growth rate In production
Growth rate in Area
1999-00 3915 250.63 15.62064 8.633461 -2.62538
2000-01 4253 244.05 17.42676 -0.70538 2.356075
2001-02 4223 249.8 16.90552 -0.21312 -5.44436
2002-03 4214 236.2 17.84081 19.79117 10
2003-04 5048 259.82 19.42884 -2.37718 -3.76414
2004-05 4928 250.04 19.70885 13.10877 3.587426
2005-06 5574 259.01 21.5204 -0.50233 -2.50569
2006-07 5546 252.52 21.96262 1.334295 4.249168
2007-08 5620 263.25 21.34853 0.302491 -2.13485
2008-09 5637 257.63 21.88022 -11.1052 0.877227
2009-10 5011 259.89 19.28123 4.490122 0.561776
2001-12 5325 262.16 20.31202 3.286385 -0.72856
2012-13 5500 260.25 21.13353 4.727273 -0.35735
2013-14 5760 259.32 22.21194 -100 -100
Source : Government of Jammu and Kashmir, Digest of Statistics (2010–11), Directorate of Economics & Statistics.5
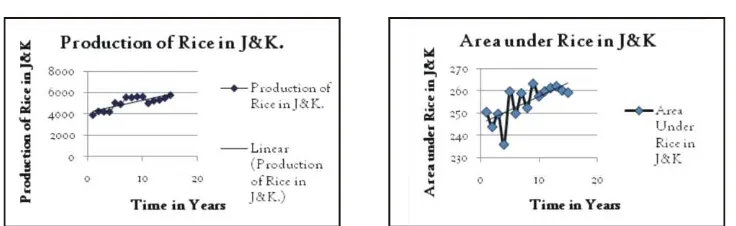
As has already being mentioned that with the passage of the time the production of rice in Jammu and Kashmir is increasing at an increasing rate as the Table 3.1 gives a clear idea behind that during the year 1999-00 the production of rice was 3915 lakh tonnes which has now increased to 5760 in 2013–14. But at the same time there is a continuous decline in the area under the rice in Jammu and Kashmir.
Graph-1 : Trend line in the Production and Area in Jammu and Kashmir (1999-2000 to 2012-13)
five districts under the area off 1.09 lakh hectares which is 42.7% of the average area under the state (2.55 lakh hectares). Whereas the production of rice under the group was 1.74 lakh tonnes which was 30.4% of the average production of rice under the state, the productivity of the rice under this group was 1,596 kg/ha as against the 2,241 kg/ha of the average production off the state.
Graph-2 : Production and Area under Rice in Jammu & Kashmir (1999-2000 to 2013-14).
u High Productivity group. (>2500 kg/ha) [four districts]
u Pulwama (3,418 kg/ha), Anantnag (3,418 kg/ha), Srinagar (3,207 kg/ha) and Budgam (2,617 kg/ha).
u Medium Productivity group (2000–2500) [one district] Baramula (2,239kg/ha).
u Medium low productivity Districts (1,500–2000 kg/ha)[five districts] u Poonch (1,750 kg/ha), Jammu (1,620 kg/ha), Kupwara (1,556 kg/ha),
Kathua (1,547 kg/ha) and Kulgam (1,496 kg/ha).
u Low productivity Districts (1,000–1500 kg/ha) [one District] Udhampur (1,235 kg/ha).
u Very low productivity Districts (<1000 kg/ha) [one district] Doda (992 kg/ha).
Table-2 : Production and Area under Rice in different districts of the State
Districts Area in ha Production in t Productivity t/ha
Anantnag 40375 105726 2.62
Baramula 32049 62904 2.03
Budgam 24734 40372 1.70
Doda 4203 4758 1.13
Jammu 54706 90148 1.68
Kathua 31611 51805 1.69
Kupwara 12013 17800 1.48
Poonch 3562 5225 1.47
Pulwama 23029 60261 2.62
Rajouri 5719 10231 1.79
Srinagar 11736 31402 2.68
Udhampur 10307 12100 1.17
Source : Gupta. B. B and Salgotra (2009), “Status Paper on Rice in Jammu and Kashmir”. [Rice Knowledge Management Portal], division of Plant Breeding and Genetics. pp. 1 – 19.
uncultivated land, including the waste land and fallow land as there is a large untapped land that needs to be addressed. At the same time there is a worst case that degrades the production of rice in the valley is that the farmers face the problem of dry and dismal picture owing to lack of rain and non availability of water for irrigation. Due to a major and most essential food staple in the valley there is a continuous rising problem of lack of rice production in the valley. The problem of land diversion and lack of timely availability of necessary inputs in the valley causes the mismatch in the demand and supply which results in inflation and hence the poverty class and middle class are deeply infected. 4.1 Calculation of trend line in the Production, Productivity and Area in
Jammu and Kashmir From last Fifteen (15) Years
Trends line in the production of Rice in Jammu and Kashmir (1999-2000 to 2013-14)
Trends line in the area under Rice in Jammu and Kashmir (1999-00 to 2013-14).
4.2 Multiple Regression Model explaining the Influence of different variables on the Production of Rice in Jammu and Kashmir
The production function is a statement of the functional relationship between inputs and outputs, in which an input is any good or service that goes into production and an output is any good or service that come out of production process. Thus the term Production function refers to the physical relationship between firm’s inputs and/or resources and its output of goods or service that comes out of production process. In economic terminology production implies the creation of utility for sales. The act of creating utility is possible by transforming inputs into outputs. In the context of agricultural it is of great importance as because of the peculiar nature of business itself. In finding out the effect of different variables (inputs) on the production of rice, we have employed the production in which we have taken area, irrigation and prices as the inputs and production of rice as output. The logic behind taking these variables into the process is explained as under.
Area : Area is an important variable which influence the production of rice to a large extent as we know that with the increase in area the production is bound to increase, weather it has also happened in the production of rice we have taken it.
Irrigation : As we know that like Indian, Jammu and Kashmir agricultural is also a gamble of monsoons; irrigation is growing to play an important role in the output of any agricultural process. So we have also taken this variable to explain the effect of irrigation in the production of rice so our production function becomes as P = f (Area, and Irrigation).
Production is the function of Area and Irrigation P = f (X1,X2) X1 is Area and X2 is irrigated area under rice.
The equation becomes Y =a + b1X1 +b2X2
The above equation can be solved by the following three normal equations åY = nb$1 +b$2 åX2 +b$3åX3 ...(1) åX Y = åX + åX22 + åX X
2 3
2 b$1 2 b$2 b$3 ...(2)
åX Y = åX + åX X2 3 + åX32
3 b$1 3 b$2 b$3 ...(3)
For calculating the value of b b2 1 and a we use the following three equations :
$ $ –$
a =Y –b2X2 b3X3 ...(4)
$ – –
a = 511.8467 0.01815 255.0613 8.09734 2.3063´ ´
$
a = 488.3904
$ –
– ( )
b1 = å å å å2
å å å
X y. X X X . X y
X X X X
2 3
2
2 3 2
$ . . – . .
.
b1 4483 130 0 05520695 5 87177 39 6224 826 1917734
= ´ ´
´0 5520695. – ( .5 87177)2 =1 01875.
$ – – – ( ) b2 2 = å å å å å å å
X y. X X X X . X y
X X X X
3 3
2 2 2
2 3 2
2 2 3 2 2 3 ...(6) $ . . – . . .
b2 39 6224 826 1917734 5 87177 4483 130 826 191773
= ´ ´
4 0 05520695´ . – ( .5 87177)2 =8 09734.
R X y + X y
y
2 2 3
2
= å å å
å
$
b1 b2
...(7)
R2 =0 01875 4483 130 8 09734 39 6224´ + ´ 59234 437
. . . .
.
For estimating the standard errors of b$1 and b$2 we need to estimate of su2
R ei yi 2 2 2 = å å
1 – where åei2 = åyi2( –1 R2)
R2
=1 8759 32
59234 4370 852123
– .
. . .
The standard errors of the estimates are
SE( ) = variance ofb$1 b$1 = .4870 ...(8) SE( ) = variance ofb$2 b$2 = 2.345 ...(9) Ho = there is no relationship between the production of rice and Area. Ho = there is no relationship between the production of rice and net irrigated area of rice.
To prove the null hypothesis we have used the Students t - test as :
t* = $ = =
$ . . . b b 1 1 1 01875
0 487 2 0918
SE( ) ...(10)
t* = $ = =
$ . . . b b 2 2 8 09734
2 345 3 4530
SE( ) ...(11)
If t* > t (tabulated), we reject the null hypothesis and accept that the alternative one, which follows the t –distribution with (n - k) degree of freedom is statistically significant. Thus greater the value of t* the stronger the evidence that is statistically significant.
S.E (b$) 0.487 2.2345
Hence we can conclude that there is a significant relationship between production of rice and Area under rice in Jammu and Kashmir at (15 – 3 =1.782) degree of freedom, and there exists a significant relationship between production of rice and total irrigated area under rice in Jammu and Kashmir at (15 – 3 =1.782) degree of freedom.
5.
Conclusion
Rice production in Jammu and Kashmir has virtually come down from last one and half decade, even though the government has taken some of the appropriate procedures in increasing it. Even though the green revolution has helped the state in increasing the production of rice but at the same time looking for the future of rice in Jammu and Kashmir will come under additional pressure from the intense competition of land and water due to changing climatic condition, high price for fertilizers. This requires a careful analysis for the current scenario and perspective with a view to identify researchable issues and the appropriate strategies to address them. However there is still a scope for improving rice production in this handicapped ecology through proper scientific intervention and policy decision
References
1. Directorate of Economics & Statistics, Government of Jammu and Kashmir, Digest of Statistics (2010 – 11), Directorate of Economics & Statistics.
2. Government of Jammu and Kashmir, Economic Survey, J & K 2013-14, Directorate of Economics & Statistics, p. 4.
3. “Farmers in Jammu and Kashmir apprehend lower rice production due to lack of rain”, Greater Kashmir, 19 July, 2013.
4. Gupta. B. B and Salgotra, Status Paper on Rice in Jammu and Kashmir.[Rice Knowledge Management Portal], Division of Plant Breeding and Genetics, 2009, pp. 1 – 19.
5. Harish Kunwar, “Train-Link for J & K Prosperity” Press Release, Press Information Bureau, Government of India, dated 16 October 2008.
6. Kennedy John and Maria. M, Advanced Micro Economic Theory, New Delhi : Himalayan Publishing House, 2000, pp. 276-279.
7. “Kashmir : the economy looks up”, The Economic Times, 18 June 2009. ê
2
Knowledge, Attitudes and Practices (KAP)
towards Family Planning among
Currently Married Women in
Major States of India
Pramod K. Gupta* and Sarita Verma**
This paper is an attempt to find out knowledge, practice and attitude related to family planning methods among currently married women. It is important to have broad knowledge about family planning all methods in the context of Indian population growth. Several studies show that there is long gap between knowledge and practices while using family planning methods. Unmet pregnancies are a best example to non use of family planning method. There is also gap between traditional method and modern method of family planning methods, peoples who are using family planning method is not able to use modern method they still depend on traditional and spacing method. Prevalence towards family planning method is either less or it is just unplanned among women and man too. There is not organized planned among the couples for using specific methods. Very few of them are using spacing method and sterilization and it is varied from state to state and strata to strata.
[Keywords : Met and Unmet need, Contraceptive Method, Abortion, Emergency Pills]
1.
Introduction
KAP is parameter to have information about specific population to gather what is known, believed and done in relation to a particular issue. Why it is that
CONTEMPORARY SOCIAL SCIENCES, Vol. 24, Number 1 (January-March), 2015 * Assistant Professor, Department of Sociology, Lucknow University, Lucknow, Uttar
Pradesh (India) E-mail: <[email protected]>
the place where most knowledge on structure organization and learning is allocated is also the place where the least of this knowledge gets put to use?
In 1952, the Indian Government was one of the first in the world to formulate a national family planning programme, which was further expanded to encompass maternal and child health, family welfare, and nutrition programmes.
India is committed to promoting a small family norm and supporting population control and development programmes. (Chandrasekhar, 1968 : 620-628) One of the fourteen Nations optimized their socio-demographic goals has to control over fertility regulation and contraception with a wide range of choices (Ministry of Health and Family Welfare, 2000). After 1976 government target young generation should
associate with programme KAP (Knowledge, attitude, practice). Knowledge is a familiarity with someone or something which can include facts, information, description or skills acquired through experience or education; it can refer to the theoretical or practical understanding of a subject or things. It can be implicit
(as with practical skill or expertise) or explicit (as with the theoretical understanding of a subject).
2.
Socio-Demographic Features of the selected States
In the present study six states of India has been chosen as major states on the basis of three parameters. Firstly, the states belong to north and central zone of India, secondly the states hold half of the population and thirdly the states covered maximum geographical area of India. The states were selected are as follows : Uttar Pradesh, Maharashtra, Bihar, West Bengal, Andhra Pradesh and Madhya Pradesh.
According to census of India 2011, these states are most populous with high decadal growth rate. Decadal growth rate of Uttar Pradesh, Bihar, Madhya Pradesh is more than 20 per cent, and another three populous state Maharashtra, West Bengal, Andhra Pradesh growth rate is below to 20 per cent, but as per as natural resources is concern it is too high in these states.
Information Communication Education Advocacy K N O W L E D G E
3.
Need of the Study
Need of the present study is to have an information about gap between Knowledge Attitude and Practices towards family planning method within a currently married women. Earlier study gives us theoretical information about KAP towards family planning. So the present study will bring some facts and figure about the level of Knowledge, commitment and attitude and intend to have practices according to their background and other socio-demographic characteristics.
4.
Objective of the Study
Broad Objective of the study is to find out the level of knowledge, attitude and practice (KAP) towards family planning methods among major states in India.
They are sub-divided into following four objectives :
1. To identify the family planning knowledge in all communities (Hindu, Muslims, Christians, Sikh, Jain, Buddhist/Neo Buddhist and other). 2. To identify the attitudes towards family planning I different religion. 3. To learn about the attitudes towards discussions and information about
family planning methods among unmarried and married women and men themselves.
5.
Methodology
This study is based on both primary and secondary data. Primary data has been collected for the fulfilling of above objectives thus an interview has been organized to using interview schedule. First of all, house listing were done in selected area (Babuganj, Aliganj and Nishatganj) of Lucknow then on the basis of pilot survey a list of respondents are being made. So, on the basis of list of the respondents, purposive sampling was adopted for the selection of the representative unit of the universe. And an interview has been conducted through well structured schedule. So, the total sample size of the study were 25 couples and as per norm of the objectives and study currently married of women were selected for the study, separate interview of female and their husband were conducted and try to maintain the standards of the interviews. A secondary data has been compiled to provide a comparative scenario on family planning. So, the data has also been taken from National Family Health Survey (NFHS-2 & 3) which has conducted by the Ministry of Health and Family Welfare, Government of India and access by the International Institute for Population Sciences (IIPS), Mumbai. So far, with the help of various statistical methods, graphs, diagrams and chart has been introduced to analyze the tables.
6.
Discussion
the stability of social order. Reincarnation requires that children pray for the souls of ancestors; how-ever, a cultural emphasis on party lineage has created tremendous emphasis on the need for male children. Hindu religion regards the decision to use contraception as a personal matter for women that is not usually within the scope of religious injunction (Ibid :133).The Buddhist attitude towards family planning allows both men and women the right to use any non-violent form of contraception. Family planning is permissible and encouraged when the intention to use contraception is wholesome or non-maleficent. The Buddhist attitude towards family planning allows both men and women the right to use any non-violent form of contraception. (Amirrtha Srikanthan, Robert L. Reid, 2007 : 134).
6.1 Knowledge of Family Planning Method
Family Planning method basically, refers to the practices that help individuals or couples to avoid unwanted births, bring about wanted births, regulate the intervals between pregnancies, control the time at which births occurs in relation to the age of parents and determines the number of children in the family.
Table-1: Knowledge of contraceptive methods by major state
Percentage of currently married women who know any contraceptive method by specific method according to state
State d o ht e m y n A d o ht e M nr e d o M y n A ll i
P DUI
m o d n o C n oi t a zi li r et S el a m e F n oi t a zi li r et S l a M d o ht e m l a n oi ti d ar T y n A m ht y h R l a w ar d ht i W d o ht e M r e ht O
NFHS-3
India 99.3 99.2 87.2 74.3 76.1 98.4 83.2 57.7 48.1 36.3 0.4 UP 99.5 99.5 95.1 88.0 93.5 98.9 91.2 73.2 69.0 42.4 0.4 Maharashtra 99.6 99.6 85.7 75.7 68.9 99.4 81.5 33.7 31.9 8.8 0.1 Bihar 100.0 100.0 95.7 79.1 81.9 99.9 92.3 75.3 50.8 51.4 0.2 WB 99.7 99.3 94.8 67.9 79.8 98.2 78.6 83.8 68.6 66.4 0.5 MP 99.8 99.8 92.7 71.3 83.6 99.7 97.0 71.3 60.9 46.6 0.0 AP 99.1 99.1 62.6 46.0 48.2 99.0 89.1 10.9 9.7 4.3 0.0
Source : NFHS-2 and NFHS-3, (India and State Report).
Inter-state variation in knowledge of contraception shows that knowledge of any contraception method as well as any modern method has been nearly universal in all states.
Graph-1 : Comparative knowledge of Any Modern Method: A Comparison
Since any modern method in NFHS-2 is nearly 99 per cent among currently married women and in NFHS-3 there is a substantially increased above 99 per cent. Data reveals that most of the states have more than 99 per cent knowledge regarding modern method in NFHS-3 and only Madhya Pradesh, Uttar Pradesh and Andhra Pradesh has less than 99 per cent of knowledge towards modern method.
In Uttar Pradesh, Maharashtra, and West Bengal, more than 70 per cent of women reported knowledge about IUD. Another important fact of these states having high density of population, and women are most likely to know about the pill and men are most likely to know about condom. In Maharashtra state knowledge about condom is decreasing but with high population growth rate Madhya Pradesh reported expansion in related knowledge.
Knowledge of male and female sterilization has been increasing since NFHS-2 to NFHS-3. Knowledge of female sterilization has been above to 95 per cent in NFHS-2, and became nearly universal with 99 per cent. Knowledge of male sterilization and any traditional method is less universalize as compared to the female sterilization and modern method. Only in West Bengal and Uttar Pradesh, currently married women have very precisely use the traditional method with 74.7 per cent 60.2 per cent respectively. Only in Andhra Pradesh, knowledge towards traditional method rates is decreasing.
Table-2: Use of Contraceptive Method by Major States NFHS-2 and NFHS-3
Currently married women with prevalence of contraceptive method according to major state, India,1998-99
State d o ht e m y n A d o ht e m nr e d o m y n A ll i
P DUI
m o d n o C n oi t a zi li r et s el a m e F n oi t a zi li r et s el a M d o ht e m l a n oi ti d ar t y n A m ht y h R l a w ar d ht i W d o ht e m r e ht O d o ht e m y n a g ni s u t o N
India 48.2 42.8 2.1 1.6 3.1 34.2 1.9 5.0 3.0 2.0 0.4 51.8 UP 28.1 22.0 1.2 1.0 4.2 14.9 0.7 5.7 4.1 1.6 0.4 71.9 Maharashtra 60.9 59.9 1.7 1.9 4.0 48.5 3.7 1.0 0.7 0.3 0.1 39.1 Bihar 24.5 22.4 1.0 0.5 0.7 19.2 1.0 1.6 0.9 0.7 0.5 75.5 WB 66.6 47.3 9.2 1.4 2.9 32.0 1.8 18.5 8.7 9.8 0.9 33.4 MP 44.3 42.6 1.0 0.8 2.9 35.7 2.2 1.4 1.0 0.4 0.3 55.7 AP 59.6 58.9 0.5 0.6 0.7 52.7 4.3 0.5 0.4 0.1 0.2 40.4
NFHS-3
UP 43.6 29.3 1.7 1.4 8.6 17.3 0.2 14.3 11.3 2.5 0.1 56.4 Maharashtra 66.9 66.9 2.4 3.0 6.2 51.1 2.1 1.9 1.4 0.4 0.0 33.1 Bihar 34.1 28.9 1.3 0.6 2.3 23.8 0.6 5.2 3.0 1.8 0.1 65.9 WB 71.2 49.9 11.7 0.6 4.3 32.2 0.7 21.3 12.3 8.4 0.1 28.8 MP 55.9 52.8 1.7 0.7 4.8 44.3 1.3 3.2 2.0 0.8 0.0 44.4 AP 67.6 67.0 0.3 0.5 0.5 62.9 2.9 0.6 0.3 0.1 0.0 32.4
Source : Reports of NFHS-2 &NFHS-3
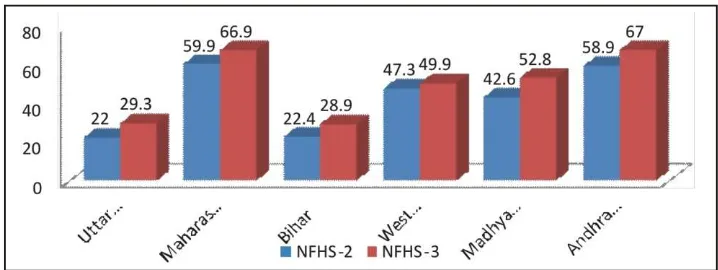
Graph-2 : Prevalence by contraceptive method in major states
Table no.2 provides comparative data reveals that over all India past 7 years there has been a steady increase in the Contraceptive Prevalence Rate (CPR) from 48 per cent in NFHS-2 (1998-99) and further to 56 per cent in NFHS-3 (2005-06). The use of any modern method is increase 6per cent between NFHS-2 to NFHS-3. In the same period, the share of the any traditional method has been increased 5.0 per cent in NFHS-2 to 7.8 per cent in NFHS-3. Women are much more likely to have used a modern method (42.8 per cent in NFHS-2 and 48 per cent in NFHS-3) than a traditional method (5.0 per cent in NFHS-2 and 7.8 per cent in NFHS-3).
The data reveals current use of any method among major states varies widely from 24.4 per cent in Bihar to 66.6 per cent in West Bengal from NFHS-2 and 34.1 per cent in Bihar to 71.2 per cent in West Bengal from NFHS-3. Low rates in these major states have important implications for future population growth in India because these states together account for more than 50 per cent of India’s population.
sterilization is by far the dominant contraceptive method. Female sterilization method in Andhra Pradesh continues to be highly skewed, with 63 per cent of users sterilized in NFHS-3, compared with 52.7 per cent in NFHS-2, as well as followed by Maharashtra, Madhya Pradesh, West Bengal, and Bihar have increased 3 to 9per cent users of sterilization between same period of time, and Uttar Pradesh continues to be lowest position with 14.9 per cent in NFHS-2 to 17.2 per cent in NFHS-3. Uttar Pradesh, Bihar, and West Bengal states except Maharashtra, Madhya Pradesh and Andhra Pradesh, also have current contraceptive use rates below to national average.
Percentages of not using any contraceptive method among same group another three states namely Uttar Pradesh, Bihar and Madhya Pradesh higher than India’s ratio. In these states majority (more than 50per cent) of currently married women has not used any contraceptive method. Population growth rate is very high in Bihar (decadal growth rate 25.07 per cent) due to 75.5 per cent women not using any contraceptive method in NFHS-2, followed by Uttar Pradesh with 71.9 per cent. Therefore these not users rate are decreasing gradually with 65.9 per cent in Bihar and 56.4 per cent in Uttar Pradesh from NFHS-3. People become aware towards family planning but thought that family planning is totally personal/individual matter so they do not want to talk about with outsiders even own family members. If we talk about women some social, religious factors are working behind their silence.
Table-3 : Knowledge of contraceptive method among respondents (Man & Women)
Contraceptive method Women (%) Man (%)
Any Method 100 100
Any Modern Method 100 100
Pill 100 100
IUD 84 92
Condom 100 100
Female sterilization 100 100
Male sterilization 72 100
Any Traditional method 56 68
Rhythm 48 32
Withdrawal 40 56
Any Other Method 24 32
The data reveals that 100 per cent of respondents (male and female both) have knowledge about any contraceptive method or it’s became universal. Knowledge related specific method like modern method or traditional method among the respondents; respondents have better knowledge about modern contraceptives in comparison of traditional method. Knowledge related spacing method(Pills, Condom) is nearly universal accept IUD, only 84 per cent women have well known about this method rest of 16 per cent women haven’t knowledge of IUD, as well as 92 per cent man have knowledge about IUD. All female and male respondents know about female sterilization but only 72 per cent female respondents know about male sterilization. Knowledge of any traditional method is less well known among all male and female respondents. Only 56 per cent female or 68 per cent male have knowledge about any traditional method. With 32 per cent, male respondents have better knowledge related any other method in the comparison of female with 24 per cent.
Table-4 : Use of Contraceptive Method in specific area of Lucknow among respondents (men & women)
Contraceptive method Women (%) Men (%)
Any Method 88
-Any Modern Method 88
-Pill 64
-IUD 28
-Condom - 24
Female sterilization 40
-Male sterilization -
-Any Traditional method 20
-Rhythm 12
-Withdrawal 16
-Any Other Method 12 32
Source : Reports of NFHS-2 & NFHS-3.
comparison of traditional method among user respondents. Only 20 per cent female users are adopting traditional method. Only 12 per cent female and 32 per cent male respondents use other method. Data reflect larger deference in knowledge, attitude and practice, because respondent have knowledge about contraceptive method but they do not prefer to use.
In present scenario couples prefer only one child, but most of couple want a male child if they select only one child, if they select two child then they prefer female child as second child, if their first child is female child they must want another male child but if first child is male child they have very less likely to choose another one. 80 per cent respondents have two children and 60 per cent respondent’s first child is female child. On this issue education level is not important because highly educated people think in same way as less educated people though.
Adoption of family planning method by a couple is subject to gender basis in Indian society. Study summaries that when a couple decides to choose a permanent method or spacing method, wife is more likely adopt. Adoption of family planning method viewed as a decision making process involving four stages. In the first step, a couple decides whether to practice family planning or not. Second step involves deciding between permanent methods and spacing method as a choice. In the third step, it is decided who among the two (husband and wife) will adopt family planning method. Finally, it is decided out of the available methods which one is the most appropriate to be adopted. Male respondents believe that family planning issue is totally female issue they do not prefer any type of male contraceptive method, that’s way in this area female contraceptive user is greater than male contraceptive user, only 24 per cent male respondents are using contraceptive method (condom user). Male user thought that spacing method (especially Pill which women prefer most) is not good for women health also 100 per cent not convinced some risk factor is work at there. Study suggests that age, education of wife and place of residence are important in selection of male or female specific methods of family planning. Selection of appropriate family planning method by a couple involves many factors together. Findings of the study is important addition to present existing knowledge in this regard play important role in selection process in all possible ways.
with the help of government family planning program. Respondents said that through these programs they became aware toward contraceptive method as well as their health.
As well as knowledge is increasing implementation of knowledge also increase. Study shows that as well as knowledge related family planning is increasing, people behavior willingly or unwillingly towards use of method is also increasing. Because knowledge will became change in human behavior. On the basis of several norms Indian society is not open society for example- family planning issues, sexual behavior, use of contraceptive etc. People having higher qualification and situated reputed post do not like talk about these issues openly due to their own norms, some community pressure, religious barriers etc. Less educated people have great hesitation for consulting doctor on family planning matter.
6.2 Socio-economic Differentials and Background Characteristics towards KAP
In India lots of different factor are working behind Knowledge attitude practice towards family planning method. These factors or background characteristics is education, age, age of marriage, Residence, Religion, Caste/ tribe, Standard of living, and number of living child etc.
The contraceptive use among currently married women generally increases with education, there is however, little difference in contraceptive use between literate women who have and have not completed middle school. In the case of spacing methods, use also tends to increase with education. Women with at least a high school education much more use modern spacing methods or contraceptive method according to illiterate women. On the other hand, as well as women literacy rate is increasing use of female sterilization declines sharply. However, Illiterate women have some lower prevalence of sterilization than literate women. Contraceptive use increased between NFHS-2 and NFHS-3 among women of every educational level. The increasing rate, however, was much more rapid among illiterate women than literate women between NFHS-2 to NFHS-3.
motherhood, and being more aware of available contraceptive methods helps in limiting family size. Low rate of child birth not only help the families in controlling their expenditures also helps women attaining the high level of health, and education facilities for their own.
The age of women is a very important factor to decide uses of contraceptive method, percentage of contraceptive users women are varies in different age group. Ever use of any method and any modern method increases with the woman’s age 15-17 up to age 35-39 and after age 39-40 decreases subsequently. At age 35-39 mostly currently married women reported ever use of any contraceptive method or ever use of a modern method and then decreases for older women. Age factor has been almost similar in NFHS-2 to NFHS-3. More than half of women are married before the legal minimum age of 18. Among women age 20-49, the median age at first marriage is 17.2 years. Earlier married women have long period of fertility and it is very important that this age group must follow family planning method. By residence, the pattern of ever use of any method by age is similar in urban and rural areas, although urban women are more likely to have used contraception than rural women at every age. The extent of ever use of female and male sterilization, the rhythm method, and withdrawal is quite similar for urban and rural women in all age groups.
followers of that religion have great respect towards it, like Hindu religion accept that there is a duty to have a family during the householder stage of life, and so are unlikely to use contraception to avoid having children altogether. As well as Sikhs have no objection to birth control, Jains views on birth control has been more willing to allow greater exceptions regarding its use to fit better within modern society. In Buddhism and Muslims there is no widely recognized policy on birth control. Traditional and orthodox families are not using contraceptive method. But gradually traditional belief are changing, NFHS-2 & 3 reports reveals increasing process in different religions. By caste or tribe, contraceptive prevalence is highest among women who do not belong to scheduled castes, scheduled tribes, or other backward classes, followed by women from scheduled cast and other backward classes. Education level and economic status play important role behind use of contraceptive prevalence among caste and tribes. Contraceptive use is lowest among women from scheduled tribes. The prevalence of female sterilization is highest among women from other backward classes, but use of modern and traditional spacing methods is highest among women from ‘other’ castes. By economic status, use of contraceptive method by the families as is directly linked to economic factors of family. Well earning family is able to use any method of family planning, and other hand some families have not enough resource to purchase things so they can’t use these methods or lower class people can’t purchase good quality of relative things.
7.
Concluding Remark
The main objective of this study is to investigate about knowledge, attitudes and practices towards family planning among Major States of India, also description about previous and ongoing changes in KAP between NFHS-2 to NFHS-3.
7.1 Knowledge of Family Planning Method
known method. The government family planning programme promotes three temporary methods: the pill, the IUD, and condoms. Of these three methods, women are most likely to know about the pill (85percnt in NFHS-3) and men are most likely to know about condoms (93per cent in NFHS-3) Knowledge about contraceptive method is increasing gradually in all selected states, specific knowledge like traditional method like rhythm and withdrawal is common between older age group of women comparatively any modern method is widely known among young age group women.
7.2 Attitude and Practice about Family Planning Method
The present study reflects towards the requirement of more awareness programmes/campaigns etc, which emphasizing on the positive effects of the use of contraception methods and clearing the misconceptions/doubts regarding the ill effects of the family planning Knowledge. This study reveals that education is one of the significant confounding factors to increase the knowledge and practice of family planning among women in India.
References
Chandrasekhran, S., “How India is tackling her population Problem”,Demography, 5(2), 1968, 620-650.
Das, Monica, The EUs Contribution to Women’s Right and Women’s Inclusion : Aspects of Democracy Building in South Asia with Special Reference to India, Sweden : International IDEA, 2010, 32-36.
Government of India, Census of India, 2011, New Delhi, India : Office of the Registrar General and Census Commissioner.
Ministry of Health and Family Welfare, 2000, Planning Commission, Government of India.
National Family Health Survey, India, 1992-93, International Institute of Population Sciences, India.
National Family Health Survey-2, State Report, India, 1998-99. International Institute of Population Sciences, India.
National Family Health Survey-3, State Report, India, 2005-06. International Institute of Population Sciences, India.
Srikanthan A, and L. Reid, “Religious and Cultural Influences on Contraception”,
Women’s Health, 30(2), 2008, 129–137. ê
3
Plasma Technology in Textile : A Step
towards the Green Environment
Arpita Kothari*
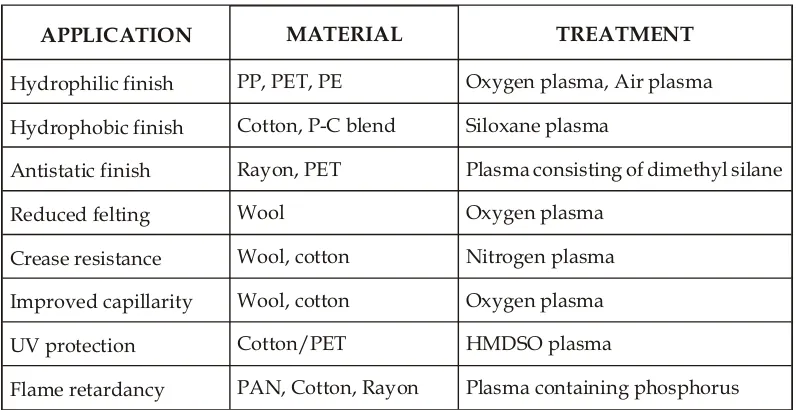
The textile industry is searching for innovative production techniques to improve the product quality, as well as society requires new finishing techniques working in environmental respect. Plasma surface treatments show distinct advantages, because they are able to modify the surface properties of inert materials, sometimes with environment friendly devices. The advantage of plasma treatments is that the modification turns out to be restricted in the uppermost layers of the substrate, thus not affecting the overall desirable bulk properties. The present paper is an attempt to explain plasma technology in textile. Its specific focus is on the plasma, its application, application techniques and recent undergoing development on the use of plasma physics. It has been shown that sputtering, etching, chemical functionalization, free-radicals generation and UV radiation are some of the most important effects conferred by plasma treatments to textiles. Plasma treatments are increasing their presence in the textile industry for several applications.
[Keywords : Plasma, Atmospheric pressure plasma, Corona Discharge, Textile Finishing, Hydrophobation]
1.
Introduction
The textile industry is searching for innovative production techniques to improve the product quality, as well as society requires new finishing techniques working in environmental respect. Plasma surface treatments show distinct advantages, because they are able to modify the surface properties of inert materials, sometimes with environment friendly devices. For fabrics, cold plasma treatments require the development of reliable and large systems. Such
CONTEMPORARY SOCIAL SCIENCES, Vol. 24, Number 1 (January-March), 2015 * Research Scholar, Department of Textile Technology, National Institute of Technology,
systems are now existing and the use of plasma physics in industrial problems is rapidly increasing. On textile surfaces, three main effects can be obtained depending on the treatment conditions: the cleaning effect, the increase of microroughness (anti-pilling finishing of wool) and the production of radicals to obtain hydrophilic surfaces. Plasma polymerisation, that is the deposition of solid polymeric materials with desired properties on textile substrates, is under development. The advantage of such plasma treatments is that the modification turns out to be restricted in the uppermost layers of the substrate, thus not affecting the overall desirable bulk properties. [7]
Plasma, the 4th state of matter is not so a strange thing, It had been first developed by M. Faraday in 1880s and plasma concept was first proposed by I. Langmuir in 1926. In the 1960s, the main industrial applications of (low-pressure) plasmas have been in the micro-electronic industries. In the1980s their uses broadened to include many other surface treatments, especially in the fields of metals and polymers. In 1980s,in the textile field, low-pressure plasma treatments of a variety of fibrous materials showing very promising results regarding the improvements in various functional properties in plasma-treated textiles. In recent times, commercial applicable atmospheric-pressure plasma processing of textiles is under research.[7]
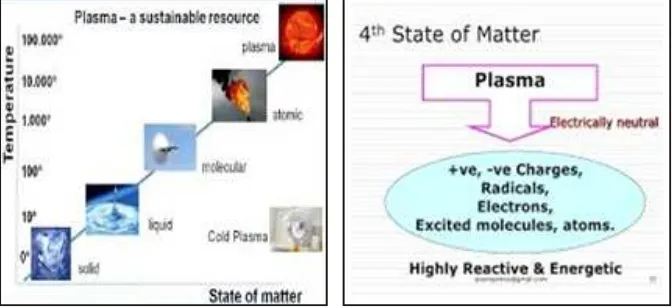
1.1 What is Plasma?
[image:35.612.141.477.475.629.2]Plasma is any substance (usually a gas) whose atoms have one or more electrons detached when heat is applied and therefore become ionised. The detached electrons remain, however, in the gas volume that in an overall sense
remains electrically neutral. Thus, any ionised gas that is composed of nearly equal numbers of negative and positive ions is called plasma.
The conventional wet treatments applied in textile processing for fibre surface modification and others are associated with many constraints. These treatments mainly concern with energy, cost and environmental issues. Application of Plasma technology at low temperature in textile processing can prove to be the best alternative for these issues. Unlike conventional wet processes, which penetrate deeply into fibres, plasma only reacts with the fabric surface that will not affect the internal structure of the fibres. Plasma technology modify the chemical structure as well as the surface properties of textile materials, deposit chemical materials (plasma polymerization) to add up functionality, or remove substances (plasma etching) from the textile materials for better applicability. The functional properties of the fabric can be modified by Nano scale etching of surface by plasma gas particles. In textile processing, this technology can be explored in various areas like pre-treatment, dyeing and finishing through different methodology vis-à-vis Glow-discharge method, Corona discharge method and Dielectric barrier discharge method to add functionality and modification of surface properties of textile materials. Plasma technology is applicable to most of textile materials for surface treatment and is beneficial over the conventional process, since it do not alter the inherent properties of the textile materials, It is dry textile treatment processing without any expenses on effluent treatment, It is a green process and it is simple process. This technology can generate more novel products to satisfy customer’s need and requirement.
1.2 Gases commonly used for Plasma Treatments
u Chemically inert (e.g. helium and argon).
u Reactive and non-polymerisable (e.g. ammonia, air, and nitrogen).
u Reactive and polymerisable (e.g. tetra fluoroethylene, hexamethyl disiloxane).
1.3 Principle of Plasma Processing
1.4 Types of Plasma
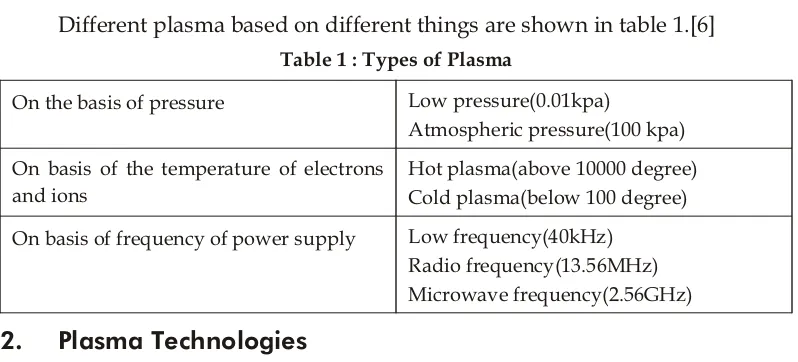
[image:37.612.108.507.102.283.2]Different plasma based on different things are shown in table 1.[6] Table 1 : Types of Plasma
On the basis of pressure Low pressure(0.01kpa)
Atmospheric pressure(100 kpa) On basis of the temperature of electrons
and ions
Hot plasma(above 10000 degree) Cold plasma(below 100 degree) On basis of frequency of power supply Low frequency(40kHz)
Radio frequency(13.56MHz) Microwave frequency(2.56GHz)
2.
Plasma Technologies
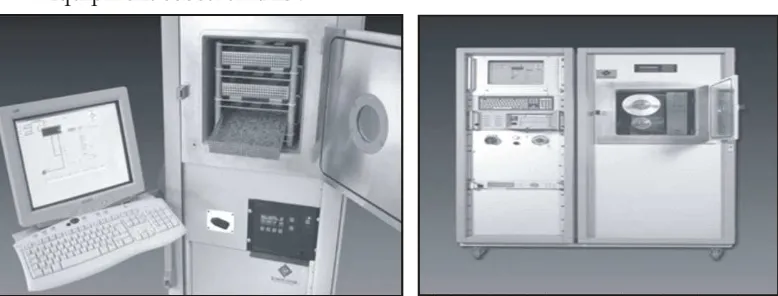
2.1 Low Pressure Cold Plasma Technology
Low-pressure cold plasma technology is also referred to as vacuum plasma technology. This technology has its origin in the processing of semiconductor materials and printed circuit boards (PCB). Soon after its introduction in the electronics industry, the path to incorporation into the textile and non-woven sectors has been and remains troublesome.
The plasma state of a gas–also considered as the fourth aggregation state of matter – can be reached if the gas is under sufficiently low-pressure and when electromagnetic energy is provided to the gas volume. Under those circumstances, the process gas will be partially decomposed into radicals and atoms and will also be partially ionised. Depending on the frequency of the electromagnetic energy, the pressure range in which equilibrium with a high density of charged particles is reached might be different. For the radio frequency range (typically 40 kHz or 13.56 MHz), normally the working gas pressure is kept in the lower 0.1 mbar range, whereas for microwave sources, a working pressure between 0.5 and 1 mbar is often used. In order to effect the plasma treatment in sufficiently pure process gas conditions, a base pressure in the lower 0.01 mbar needs to be reached. This can be done with two-stage roughing vacuum pumps (rotary vane type) or with a dry pump or with a combination of either of those pumps with a roots blower.
Equipment based on this :
Development of type of low pressure plasma is done by: 2.1.1 Glow Discharge
It is the oldest type of plasma technique. It is produced at reduced pressure (low-pressure plasma technique) and provides the highest possible uniformity and flexibility of any plasma treatment. The plasma is formed by applying a DC, low frequency (50 Hz) or radio frequency (40 kHz, 13.56 MHz) voltage over a pair or a series of electrodes. Alternatively, a vacuum glow discharge can be made by using microwave (GHz) power supply. [10]
2.2 Atmospheric-pressure Cold Plasma Processing Technology
Low pressure plasma processing has failed to make an impact in the textile sector because of a particular constraint, which is incompatible with industrial mass production. All the technologies developed to date are based on the properties of low-pressure plasmas.
The process must take place in an expensive, closed-perimeter vacuum system and cannot be used for continuous production lines operating at room temperature, with machines processing fabric 2 meter wide at high speed.
[image:38.612.106.495.97.245.2]To overcome these restraints, Atmospheric Pressure Plasma Techniques are being developed. This technique provides the highest possible plasma density (in the range of 1 to 5 x 10¹² electrons cm-3), without the associated high gas temperatures and the cold plasma chemically treats fabric and other substrates without subjecting them to damaging high temperatures. The Atmospheric Pressure Plasma is a unique, non-thermal, glow-discharge plasma operating at atmospheric pressure. The discharge uses a high-flow feed-gas
consisting primarily of an inert carrier gas, like He, and small amount of additive to be activated, such as O2, H2O or CF4.
The development of three types of APP that have relevance for textile treatment–the Corona Discharge, the Dielectric Barrier Discharge, the Atmospheric Pressure Glow Discharge.
2.2.1 The Corona Discharge
Corona discharges are plasmas that result from the high electric field that surrounds an electrically conductive spatial singularity when a voltage is applied. The high electric field around the singularity, i.e. the point of the needle or the wire, causes electrical breakdown and ionisation of whatever gas surrounds the singularity, and plasma is created, which discharges in a fountain-like spray out from the point or wire. Plasma types are characterized, inter alia, by the number, density and temperature of the free electrons in the system.
The discharge is so narrow that the residence time of the fabric in the plasma would be too short for commercial operation and, in addition, the power level that can be applied is extremely limited by the cross-section capacity of the wire and its ability to dissipate heat generated during treatment. Accordingly, in its pure form, corona is far from an ideal textile surface processing medium.
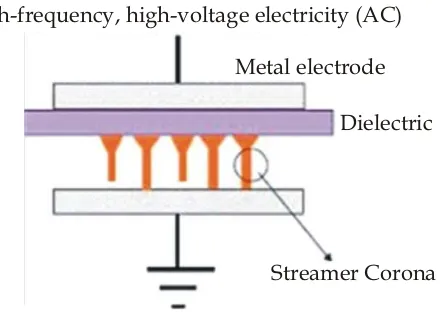
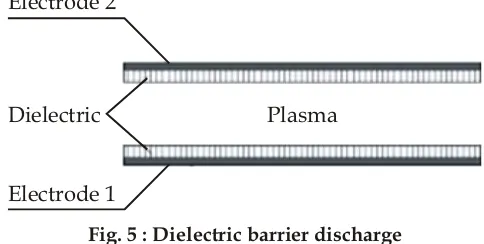
2.2.2 Dielectric Barrier Discharge
In contrast to the asymmetry of the corona system, if a symmetrical electrode arrangement is set up comprising two parallel conducting plates placed in opposition, separated by a gap of ~10 mm, and a high voltage, 1–20 kV,
High-frequency, high-voltage electricity (AC) Metal electrode
Dielectric
[image:39.612.207.428.398.560.2]Streamer Corona
is applied, the gas between the plates can be electrically broken down and a plasma discharge generated. Generally, however, that plasma takes the form of a hot thermal plasma arc less than a millimetre in diameter, which jumps from one spot on one electrode plate to a spot on the opposing electrode. This is useless for textile treatment and would do nothing except burn a hole in the fabric. If, however, one or both of the electrode plates is covered by a dielectric such as ceramic or glass, the plasma finds it much more difficult to discharge as an arc and, instead, is forced to spread itself out over the area of the electrodes to carry the current it needs to survive. This type of plasma is called a Dielectric Barrier Discharge (DBD) and is large area, non-thermal and uniform. Because of charge accumulation on the dielectric, this tends to neutralize the applied electric field thus choking off the plasma, the DBD must be powered by a.c. and is typically driven by high voltage power supplies running at frequencies of 1 to 100 kHz. It is denser than the corona with a typical free electron density of about 1010 electrons/cm3 but the free electrons are slightly cooler at temperatures of 20 000 to 50 000 K. This is a much more attractive candidate for textile processing than the pure corona.
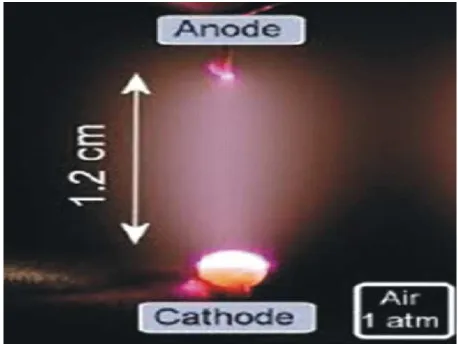
2.2.3 The Atmospheric Pressure Glow Discharge
The third APP type intrinsically capable of meeting the size and temperature constraints needed for textile processing is the Atmospheric Pressure Glow Discharge (APGD). This is analogous in its mode of generation and some key characteristics to the famous low-pressure glow discharge plasma that is the backbone of the global plasma industry and workhorse of a dozen major industries, in particular the omnipresent microelectronics industry, which would not exist without the glow discharge plasma. The APGD is generated by application of relatively low (~200 V) voltages across opposing symmetrical planar or curved electrodes, separated by mm at high frequency, or even very high frequency, radio frequencies 2–60 MHz, much higher than the other plasma
Electrode 2
Electrode 1
[image:40.612.175.417.349.471.2]Dielectric Plasma
types. The electrodes are not covered by dielectric but are bare metal, a feature that enables significantly higher power densities (up to 500 W/cm3) to be coupled into the discharge than can be achieved with corona or DBD.
The APGD is denser than the DBD, with typical free electron densities of 1011–1012 electrons/cm3, but the free electrons are slightly cooler at temperatures of 10 000 to 20 000 K. Textile treatment temperatures can run at 25–50 ºC. APGD plasma takes the form of a bright, uniform, homogeneous glow in the region between the electrodes. The application of voltage between metal plates would generally result in generation of a highly undesirable, very high current density and hot plasma arc. By control of the interelectrode gap and the frequency of the driving voltage and, above all, by the use of helium as ~99% of the generation gas, arcing is prevented and a large volume, non-thermal plasma is generated, which is both dense and a rich source of the chemical species needed to carry out textile processing. This amazing gas has several special properties that, in combination, make it uniquely suited for the generation of well-behaved, large volume, cool plasma at atmospheric pressure. Other gases, such as oxygen or nitrogen, are microscopically more complex with many different energetic modes.
All in all, helium has been and continues to be probably the best medium for non-thermal APP research as well as being technologically valuable as a route to useful large volume, cool plasmas.
3.
Effect of Plasma on Textile Surface
[image:41.612.191.420.395.567.2]There are five major effects of which three will be described in detail: fine cleaning, surface activation, and etching, cross-linking and coating deposition.
3.1 Surface Activation by Plasma
Surface activation by plasma is also referred to as chemical grafting (Terlingen, 1993). It never occurs alone, but always occurs during/after plasma cleaning. Indeed, in the case of a substrate subjected to a soft secondary plasma which contains reactive species (e.g. oxygen atoms), the effect of those atoms will be twofold: they will react with organic contamination which is present on the substrate surface. Such organic contamination consists, in many cases, of loosely bound hydrocarbons. Both H and C will react with oxygen and will leave the substrate surface in the form of volatile H2O and CO2. Once the surface molecules of a polymer are freed from contamination, they can react with the oxygen atoms which will form carbonyl-, carboxyl- or hydroxyl functional groups on the substrate surface. It is said that the polymer surface has been chemically functionalised.
The effect of grafting carbonyl-groups onto a surface of PP, polyethylene (PE), or polyesters such as polyethyleneterephthalate (PET) or polybuty-leneterephthalate (PBT) gives rise to an increase in surface energy to levels higher than 68 mN/m immediately after the plasma treatment. This effect is, however, not permanent: it has a certain shelf-life. Once the substrate has been removed from the plasma, and depending on the storage conditions, oxygen atoms will be released again from the surface molecules. This will happen slowly over time. After several days or even several months, the original surface energy of the substrate will have returned. The rate at which this happens depends on the type of substrate: e.g. PP has a fairly good shelf-life of a couple of weeks, whereas silicones show a shelf-life of less than one day. It further depends on the plasma conditions: an intensive plasma treatment will create a higher surface density of functional groups and, as such, the shelf-life will be longer.
Plasma activation is being used in several fabric and nonwoven applications in the textile industry:
u Fabrics for automotive and medical applications u Pre-treatment before dyeing
u Activation of transportation textile before application of flame-retardant chemistry
3.2 Etching by Plasma
particles (ions and electrons) and apart from a purely chemical effect; the substrate is subjected also to a physical sputtering effect. In the case of textiles and non-wovens, this effect of plasma treatment is not often used.
However, there is a certain potential even for fabrics. The textile market is trying to make deep, dark colours and this is not easy to achieve. One way to do this is to reduce the specular component of reflection of the fabric surface after dyeing. A plasma etching leads to a controlled Nano- or micro-roughness, increasing diffuse reflectance and minimizing the specular component. In consequence, the dyed fabric will have an intenser darker colour after plasma etching.
Etching requires the removal of several hundreds of nanometres and etching processes are therefore slow. Needless to say, this technique is only viable for very high-end textiles.
3.3 Thin Film Deposition by Plasma Polymerisation
A very important usage of low-pressure vacuum plasma technology is thin film coating deposition by plasma polymerisation. In this specific case, reactive precursor gases that can polymerise are being used as process gases (Yasuda, 1976). The precursor gases are broken into radicals that react with each other on the substrate surface. The nature of the precursor gases will very much determine the properties of the deposited coating. Coating thickness is normally in the 10–50 nm range (5–30 molecular layers).
The very first applications of plasma polymerisation were found in the medical device industry. There are many industrial applications of thin film deposition by plasma polymerisation in the technical textile and nonwoven industry. Roughly, the coatings deposited in those industries can be categorised under either (permanently) hydrophilic coatings or hydrophobic/oleo phobic coatings. In most cases, the deposited coatings give rise to unique products that are difficult or even impossible to produce using other technologies.
Application of deposition by plasma on textile:
u Hydrophobation of non-wovens for filtration applications u Hydrophilic coatings on non-woven PP for battery separators
4.
Application of Plasma Technology in Textile
regard, plasma technology shows distinct merits due to its environmental friendly and better treatment results.
Various eras where this technology can be explored includes pre-treatments, other wet processes of textiles, technical textile and non-woven. Plasma can modify the surface properties of textile materials, deposit chemical materials (Plasma polymerisation) to add up functionality, or remove substances (plasma etching) from the textile materials and used to produce innovative functional textiles.
4.1 Desizing of Cotton Fabric
Plasma technology can be used to remove PVA sizing material from cotton fibres. In conventional desizing process we use chemicals and hot water to remove size. But desizing with plasma technology we can use either O2/He plasma or Air/He plasma. Firstly the treatment breaks down the chains of PVA making them smaller and more soluble. X-ray photoelectron microscopy results reveal that plasma treatment introduces oxygen and nitrogen groups on the surface of PVA which owing to greater polarity increase the solubility of PVA.
Of the two gas mixtures that were studied, the results also indicate that O2/He plasma has a greater effect on PVA surface chemical changes than Air/He plasma.
4.2 Dyeing
Several studies have shown that dye ability or printability of textiles can be markedly improved by plasma treatments. This effect can be obtained on both synthetic and natural fibres. Capillarity improvement, enhancement of surface area, reduction of external crystallinity, creation of reactive sites on the fibres and many other actions can contribute to the final effect depending on the operative conditions. Also production of colours on fibres exploiting diffraction effects has been attempted.
4.2.1 Dyeability of Natural Fibres
It has been reported that plasma treatment on cotton in presence of air or argon gas increases its water absorbency which in turn increase both the rate of dyeing and the direct dye uptake in the absence of electrolyte in the dye bath.
also removes surface fiber impurities (e.g. cotton wax or any remaining warp size, etc.). iii. The chemical changes in the cotton fiber surface (leading to carbonyl and carboxyl groups in the fiber. iv. The possibility of the formation of free radicals on the cellulosic chains of cotton. v. Thus the action of oxygen and air plasma treatments modifies the surface properties of cotton and leads to an increase in the rate and extent of uptake of direct dye.
The dye exhaustion rate of plasma treated wool has been shown to increase by nearly 50%. It has been shown that O2 plasma treatment increases the wetability of wool fabric thus l