Asian Academic Research Journal of Social Sciences & Humanities
&
ISSN 2319-2801 (Online)
Asian Academic Research Journal of Multidisciplinary
Editorial Board
AL KHARJ, KINGDOM OF SAUDI ARABIADR. ANUKRATI SHARMA
VICE-PRINCIPAL & ASSOCIATE PROFESSOR
BIFF & BRIGHT COLLEGE OF TECHNICAL EDUCATION, JAIPUR (RAJ.) (AFFILIATED TO UNIVERSITY OF RAJASTHAN)
DR. SHIVAKUMAR DEENE
DEPT. OF COMMERCE AND MANAGEMENT,
GOVT. FIRST GRADE COLLEGE, CHITGUPPA TQ. HUMANABAD, DIST. BIDAR, KARNATAKA (INDIA)
DR. RAMESH CHANDRA DAS DEPARTMENT OF ECONOMICS KATWA COLLEGE, KATWA, BURDWAN, WEST BENGAL
DIPHU-782 460 KARBI ANGLONG, ASSAM, INDIA
DR.S.ELIZABETH AMUDHINI STPEHEN POONAMALLEE, CHENNAI – 600123
DR. BALASUNDARAM NIMALATHASAN DEPARTMENT OF ACCOUNTING,
FACULTY OF MANAGEMENT STUDIES & COMMERCE, UNIVERSITY OF JAFFNA,
JAFFNA, SRI LANKA
DR.SHOBANA NELASCO, ASSOCIATE PROFESSOR
FELLOW OF INDIAN COUNCIL OF SOCIAL SCIENCE RESEARCH (ON DEPUTATION)
DEPT. OF ECONOMICS,
BHARATHIDASAN UNIVERSITY, TRICHIRAPPALLI
DR.ARABI.U
ASSOCIATE PROFESSOR AND CHAIRMAN
DEPARTMENT OF STUDIES AND RESEARCH IN ECONOMICS, MANGALORE UNIVERSITY, MANAGALAGANGOTHRI,
DAKSHINA KANNADA DISTRICT KARNATAKA STATE, INDIA-574199
DR.T.CHANDRASEKARAYYA, ASSISTANT PROFESSOR,
DEPT OF POPULATION STUDIES & SOCIAL WORK, S.V.UNIVERSITY,
DR ARUN KUMAR BEHERA, ASST. PROF. POST DOCTORAL FELLOWSHIP EINSTEIN INTL UNIV-USA DEPT. OF ENGLISH,
SRI SATHYA SAI INSTITUTE OF HIGHER LEARNING, BRINDAVAN CAMPUS,KADUGODI POST, BANGALORE
DR. MOHAMMED ALI HUSSAIN PRINCIPAL & PROFESSOR,
DEPT. OF COMPUTER SCIENCE & ENGINEERING.
SRI SAI MADHAVI INSTITUTE OF SCIENCE & TECHNOLOGY, MALLAMPUDI, RAJAHMUNDRY, A.P, INDIA.
DR. TAMMA SURYANARAYANA SASTRY HEAD OF THE DEPARTMENT OF LAW, UNIVERSITY OF PUNE
PROFESSOR –VIT BUSINESS SCHOOL
VELLORE INSTITUTE OF TECHNOLOGY, VELLORE
DR. M. RAMESH KUMAR MIRYALA PROFESSOR
SWAMI RAMANANDA TIRTHA INSTITUTE OF SCIENCE & TECHNOLOGY, NALGONDA
DR.V.MOHANASUNDARAM
PROFESSOR AND HEAD, DEPARTMENT OF MANAGEMENT STUDIES,
VIVEKANANDHA INSTITUTE OF ENGINEERING AND TECHNOLOGY FOR WOMEN, NAMAKKAL DT
DR. M. RAMESH KUMAR MIRYALA PROFESSOR
SWAMI RAMANANDA TIRTHA INSTITUTE OF SCIENCE & TECHNOLOGY, NALGONDA
Asian Academic Research Journal of Multidisciplinary
www.asianacademicresearch.org Online ISSN : 2319 – 2801
INDEX PAGE
SNO ARTICLE TITLE PAGE NO
1. A COMPREHENSIVE STUDY ON ANTIMICROBIAL EFFECT OF SOME MEDICINAL PLANTS FARHINA PASHA
1 – 7
2. STUDY OF THE PERFORMANCE OF A PARALLEL VERTICAL JUNCTION SILICON SOLAR CELL UNDER THERMAL INFLUENCE NFALLY DIEME
8 – 16
3. TRANSITION CAPACITANCE OF SILICON PN JUNCTION UNDER THERMAL INFLUENCE
NFALLY DIEME 17 – 23
4. CEREBROSPINAL FLUID ADENOSINE DEAMINASE ACTIVITY IN PATIENTS WITH TUBERCULOUS AND NON TUBERCULOUS MENINGITIS N.RAJYA LAKSHMI ; JYOTSNA.V ; N.V.UMA LAKSMI
24 – 39
5.
DETERMINANT FACTORS FOR THE INTENSITY OF URBAN HEAT ISLAND IN RESIDENTIAL AREAS IN RURAL ENVIRONMENT
ZUBER ANGKASA ; FACHRURROZIE SJARKOWI ; DADANG H PURNAMA; DWI SETYAWAN ; NGAKAN PUTU SUECA
40 – 64
6. CONCEPTUAL AND HISTORICAL FRAMEWORK OF CONTINUOUS AND COMPREHENSIVE EVALUATION DR. NIMISHA BERI
65 – 78
7.
EVIDENCE OF DELTAIC SYSTEME, TYPE COLORADO, IN THE MIDDLE TERME OF THE PROTEROZOÏC BASIN OF SEMBE-OUESSO: NORTHWEST PART OF REPUBLIC OF CONGO
MIYOUNA T; MALOUGUILA-NGANGA D; ESSOULI O; KINGAMOUZEO; KAYA F.; SOW E. H. ; BOUDZOUMOU F
79 – 94
8. PERFORMANCE OF WEANER PIGS FED VARYING LEVELS OF BREWERS YEAST FERMENTED RICE MILLING WASTE (FRMW) OBIH T.K.O
95 – 103
9.
MEASUREMENT OF INFECTIOUS DOSE FOR AFTOSA VIRUS ISOLATED FROM IRAQI SHEEP BY INOCULATED THE CHORIO – ALLANTOIC MEMBRANE OF THE CHICK EMBRYO
SABAA HILAL HADI
104 – 111
10.
CAUSED BY IMPROPER INADVERTENT THERMAL BURN USE OF ENERGY SOURCE USED FOR COAGULATION OF BLOOD VESSELS DURING SURGERY
SUNIT KUMAR SINGH; ALOK TRIPATHI; DEEPAK MISHR
112 – 117
11.
INDUCTION OF THE GENES EXPRESSION OF ONION ENCODING FLAVONOIDS AND ANTHOCYANINE BIOSYNTHETIC ENZYMES AS DEFENSE REACTION AGAINST BOTRYTIS ACLADA INFECTION.
AHMED H.M. RAMADAN ; EL SHOBAKY AHMED; M. A. ABDEL-GAYED; SANAA. A. KABEIL; EMAD EL-DEIN H. WASFY; ELSAYED E. HAFEZ
118 – 132
12. UNIVERSITY-INDUSTRY COLLABORATION IN NIGERIA: ISSUES AND STRATEGIES
PETER ONWUALU ; ITOHAN OJEAGA 133 – 151
13. BEHAVIOUR OF SOFT SUBGRADE SOIL WHEN STABILIZED WITH ALKALINE SOLUTION AND REINFORCED WITH SISAL FIBER MANIKANTA K V; JYOTHI SWARUP D; DR.SURESH BABU T
Asian Academic Research Journal of Multidisciplinary
www.asianacademicresearch.org
14. PH LEVELS
KASHIFA NAGHMA WAHEED ; ZEHRA KHATOON; SIKENDER HAYAT; ZAID MEHMOOD ; SAJID ALI NAQVI
161 – 174
15. REPLACEMENT VALUE OF ENZYME SUPPLEMENTED MAIZE OFFAL FOR MAIZE ON THE PERFORMANCE OF FINISHER BROILERS T. K. O. OBIH
175 – 182
16.
PRODUCTION OF RHAMNOLIPIDS BY PSEUDOMONAS AERUGINOSA PAO1 FROM FOOD WASTES: PURIFICATION, DETECTION AND PROTEOMIC ANALYSIS
SANAA SA KABIL ; ABDELAAL SHAMSELDIN; AMIRA SA HASSAN; WAEL A SABRA ; SORAYA A SABRY
183 – 205
17. MOLECULAR, SEROLOGICAL AND PATHOLOGICAL STUDY ON BROILER BREEDERS AFFECTED WITH INFECTIOUS BRONCHITIS VIRUS ALAA ABDUL AZIZ ABED
206 – 221
18. CURRICULUM ON MEDICAL PROFESSIONALISM FOR UNDERGRADUATES.
SUNEEL. I. MAJAGI; ARA TEKIAN 222 – 243
19. PEDIATRIC PULMONARY HYPOPLASIA WITH HORSE SHOE KIDNEY REPORT. – A CASE B B SHARMA
244 – 250
20. PET-CT IMAGING - HOW TO RESOLVE THE RADIATION PROTECTION ISSUE? SHILPA SINGH ; MONU SARIN ; B B SHARMA ; SARITA JILOWA ; YASHVANT SINGH 251 – 256
21. RADIOACTIVE NUCLIDES AND CONTAMINATION IN FOODSTUFFS
ASIA H. AL-MASHHADANI1; ABDUL-JABBAR ABBAS OUDH 257 – 270
22. STUDY ON FUNCTIONAL PROPERTIES OF REGENERATED BAMBOO AND ERI SILK BLENDED FABRIC DR. SMITARANI SAIKIA ; DR. BINITA BAISHYA KALITA
271 – 277
23.
RHIZOTROGINI LARVAE OF NORTH AFRICA (COLEOPTERA SCRABAEIDAE, MELOLONTHINAE). UTILIZATION OF SILKS ANAL ECUSSION FORM TO THE DETERMINATION OF SPECIES AND COMPARISON BETWEEN MORPHOLOGICAL PARAMETERS IN LARVAE’S STAGES IN THE REGION OF CONSTANTINE-ALGERIA MADACI BRAHIM; CHENOUF FADILA, DERRADJ LOTFI
278 – 293
24. SEQUENCING BATCH REACTOR FOR TREATING PHARMACEUTICAL EFFLUENTS SAREDDY RAVI SANKARA REDDY ;VARA SARITHA ;BHAVYA KAVITHA DWARAPUREDDI
294 – 304
25. SHERAZ SCHOOL OF MINIATURE
MARIA ANSARI; FARJAD FAIZ; AMNA ANSARI 305 – 314
26. ADAPTIVE NETWORK DESIGN PARAMETERS FOR EFFICIENT SYSTEM DESIGN L.SUDHA; DR.P.THANGARAJ 315 – 325
27. WOMEN AND WORKING OF CONSTITUTIONAL PROVISIONS IN INDIA: A CRITICAL LEGAL STUDY HARI SHANKAR PANDA
326 – 342
28.
EVALUATION GEOTECHNICAL FOR SITE COMMERCIAL COMPLEX BUILDING PROJECT IN AL-SAMAWA DISTRICT , AL- MUTHANNA GOVERNORATE
PROF. DR.MOHSEN ABD ALI ; DR. KADHIM NAIEF TAAE ; MOHANAD MOUSA AL-FARHAN ; PROF. DR.AMER ATYAH LAFTAH
343 – 368
29.
CLINICAL EVALUATION OF MASHABALADI KWATH IN THE MANAGEMENT OF ARDITA (FACIAL PARALYSIS)
DR. SWAPNIL S. SINGHAI
Asian Academic Research Journal of Multidisciplinary
www.asianacademicresearch.org
40
A Peer Reviewed International Journal of Asian Academic Research Associates
AARJMD
ASIAN ACADEMIC RESEARCH
JOURNAL OF MULTIDISCIPLINARY
DETERMINANT FACTORS FOR THE INTENSITY OF URBAN HEAT ISLAND IN RESIDENTIAL AREAS IN RURAL ENVIRONMENT
ZUBER ANGKASA1; FACHRURROZIE SJARKOWI2; DADANG H PURNAMA3; DWI SETYAWAN4; NGAKAN PUTU SUECA5
1
Ph.D Student of Environmental Science, Sriwijaya University, Indonesia 2
Department of Environmental Science, Sriwijaya University, Indonesia 3
Department of Environmental Science, Sriwijaya University, Indonesia 4
Department of Environmental Science, Sriwijaya University, Indonesia 5
Department of Architecture, Udayana University, Denpasar , Indonesia.
Abstract
There is a potential adverse impact of housing construction in rural areas that arise due to the
increased heat of the housing population trends to produce various kinds of heat. This article
focuses on the roughness of the roof, energy density, and house height home that
may contribute to the development of the Urban heat island (UHI). Researchers compared the
variation of UHI on 125 homes in a residential village in South Sumatra. By using multiple
linear regression, researchers found indications that the highest UHI intensity arise when the
house have slippery roofs, tall, small ratio of green to built area, and a large home electricity
consumption. Natural factors also become important determinants, especially the weather.
Based on these findings, a number of policies to prevent heat buildup in housing outside the
city recommended.
Keywords: energy density, green to built ratio, roof roughness, rural housing, urban heat
Asian Academic Research Journal of Multidisciplinary
www.asianacademicresearch.org
41 1. Introduction
This article aims to analyze the factors that determine Urban Heat Island (UHI) in
housing in the area outside the city in a tropical country. Additional purpose, which is
essentially drawn from the research findings, is to providethe right policy that could allow
local governments to develop more environmentally friendly housing.
UHI is the most important features of urban climate (Blazejczyk et al., 2012). UHI -
and its effects - in urban areas has become an important issue, particularly in developing
countries after the issue of global warming. It reduces the community ability to live
comfortably in the environment for their activities. UHI has the potential to generate
discomfort during activity that would require additional electrical energy for cooling the
room and increase the comfort (Valsson and Bharat, 2009), especially in the tropics (Fischer
and Schär, 2010). In addition, the increase in urban temperatures can cause human becoming
increasingly aggressive and temperamental. This triggers an increase in the crime of murder
and violence. Itis estimated that there were 4.58 cases per hundred thousand people for
increase of 1oF (United States Department of Energy, 2009; Anderson et al., 1997). The study
also found that the UHI accounted for 2-4% of global warming (Jacobson and Ten Hoeve,
2011). Because of the magnitude of the problem that it can caused, perhaps surprising that
few studies examine the factors that influence the UHI in urban areas in Indonesia
(Tursilowati, 2009; Hidayati, 1990; Karyono, 1995). Fewer still focuses exclusively on
residential areas as micro urban in the rural environment, or how rural housing increasing
temperature through its presence in the middle of rural area. This article contributes to the
literature by analyzing the determinants of UHI in rural residential areas in
Palembang. Analysis done by comparing the houses are close together and be part of the
same housing and measurable having the UHI effect is significantly higher than other
housing in the region. This situation results from the residential areas for long times and high
variation on the residents who live in it. The implications of the housing area in
the UHI context explored further in section 2. Section 3 of this article then concentrate on
theoretical concepts and review of the literature. The author developed a theoretical
framework, in particular from the pioneering work of Zhao et al (2014). The author
then review the literature to build a concrete hypothesis that will tested, with a focus on the
types of factors that explains the UHI. In section 4, the researchers present
a methodology to determine the factors that explain the UHI in the study sample, followed by
Asian Academic Research Journal of Multidisciplinary
www.asianacademicresearch.org
42
Data collected through field observations and interviews with residents in February 2013.
Field observations provide details on the volume of home, type of roof used, the current
weather measurement, and the ratio of green to built areas of the house. The interview
provides data on population size of the household.
It is quite difficult to create the perfect measurement of UHI with only measure the
temperature in the housing area. The dependent variable in this study is the increase of air
temperature becomes compared to the surrounding area (Unger et al., 2001). This definition
is essentially for a city. Even so, there is no obstacle when it to apply to the housing sphere in
rural areas. This is due to the housing has characteristics similar to the city. It structurally
organized, population density that is larger than the rural areas, and generally have a variety
of self-support system. UHI measurements done by creating a temperature difference
between the temperature measured in the house individually with the temperature in the
reference point. The temperature at the reference point outside the city are at Indonesian
Agency for Meteorological, Climatological and Geophysics station in Kenten within about 2
km from the housing. One disadvantage of this method is the need for an approach to match
data because the temperature of the reference point is only available in four periods of time
while the temperature at the measuring point is available in real-time resolution. However,
assuming no extreme weather changes, this approach has been able to reflect the UHI in the
area under study.
The results of the study presented in section 5 with the aim of helping to understand
the important aspects of theUHI in a residential area in the outer region of the city.
Researcher initially determining factors from five sources of heat (radiation, convection,
evaporation, storage, and anthropogenic) before examining this relationship in the model of
linear regression analysis. The findings suggest two factors strongly associated with UHI: the
surface roughness of the roof and the home population. There are also indications that the
volume of the house is also important in explaining the UHI in residential areas. The findings
are then described in section 6 of the policy implications of local government to
the UHI mitigation efforts, particularly in the context of developing residential areas outside
the city. Section 7 providing conclusion of the study.
2. Development of Settlements in the Outer City Area
Urban Heat Island in Indonesia is increasingly widespread. Tursilowati (2009) stated
that some of the major cities in Indonesia increased air temperature. Expansion of UHI (areas
Asian Academic Research Journal of Multidisciplinary
www.asianacademicresearch.org
43
around 12 606 ha or 4.47% per year, in Semarang 12 174 ha or 8.4% per year, in Surabaya
1,512 ha or 4.8% per year. In 1990, the air temperature Jakarta City detected 0,02-1oC higher
than the sub-urban areas, (Hidayati, 1990; Karyono, 1995).
UHI expansion due to urbanization accompanied with change in various native
landforms with urban land (Lo and Quattrochi, 2003), increasing the density structure (Wong
et al., 2010), and housing and infrastructure (Upchurch, 2005). The areas most vulnerable
to UHI is growing cities and suburban areas (urban fringe). According to Ernawi (2010),
cities suburban area in Indonesia spread and packed even beyond the boundaries of the
administrative area of the city. Villages quickly became the center of a new urban activities.
Land that was originally in the form of open land, swamp, or forest land converted into solid
building resulting in a change in land use, demographic, and ecological balance (Yoyok et al.,
1997).
From all the cities in the world, new housing on the outskirts of the city estimated to
20-30% (Robinson, 2005). Approximately 8-19% of the population major cities in Indonesia
live in housing (Hoek-Smit, 2005). Housing is an area which has its own environmental and
sociological characteristics, generally do not bring a sense of ownership and personal
identity, do not have clear boundaries of personal and public life, and have a weak
relationship with the open space (Woehr, 2007). It is increasingly seen in developing
countries, such as Indonesia, that the high-quality housing is quite expensive (Bloom and
Khanna, 2007). The size of housing in major cities getting bigger, but the distance between
house increasingly narrow. It resulted in a narrowing of the space and replacing natural
spaces into artificial space (Upchurch, 2005).
Palembang is a city that is growing rapidly from a swamp land. Febriana (2008) wrote
that Palembang which has an area of 400.610 km2 originally consisted of 54% of the swamp
area. In 1999, the swamp area becomes 30.35%. The swamp land area continued to decline
until in 2007 the only remaining 15.3%. Recent data in Palembang Urban Land Use Planning
2010-2020 show that wetlands in Palembang only remaining 5835.19 ha or about14.58%.
That is, in the period 1999-2010, Palembang has lost swamp of 5713.60 ha
or approximately 14.26%.
Although Palembang increasingly crowded with buildings and the land conversion,
studies to find the effects of the heat generated from such a situation has not been addressed
until now. This situation if left unchecked will have negative effects for the people of
Asian Academic Research Journal of Multidisciplinary
www.asianacademicresearch.org
44
the building continued rising 7.12% in 2009, 8.03% in 2010, and 12.92% in 2011 (Juliantina,
2012). Therefore, this research is very important to give least effect for the people of
Palembang.
3. Theoretical Literature and Hypotheses
Theoretical foundation of this research is mainly related to the results of Zhao et al
(2014) study. Some reviews from other literature also added, with a focus on factors that
developed from Zhao et al (2014).
3.1. Theoretical Concept and UHI Components
Core discussion about the factors that influence the UHI assumed that the green area
is the main factor that lowers the UHI (Taha, 1997; Peng et al., 2012). However, this
assumption questioned by Zhao et al (2014). Zhao et al (2014) conducted a study on a
number of cities in Canada and the United States which spread across three climatic regions:
cold, temperate, and dry climate. If the hypothesis holds true, UHI in cold and dry climate
will be very high because almost no trees in this area. However, their study actually found the
opposite. UHI in cold and dry climates are even lower than in temperate region.
The main explanation to this finding is actually not plants that reduces the UHI, but
the roughness factor. In the temperate region, rural areas are more rugged than urban areas.
As a result, UHI is higher. Conversely, in a dry and cool area, it is urban which more rugged
than rural. UHI in this area can even negative. Green land apparently lowering UHI because
trees and various types of plants have a high roughness. In the temperate region and tropical
region, rural areas have far more trees than the city. Consequently, the resulting effect is
high UHI in town that does not have a tree. But in the cold and dry climate, rural areas are
very smooth. There are no trees and there is only desert or snow. Area of the city, although
also devoid of trees, but have buildings that increase the surface roughness. As a result there
is a negative impact on the heat in urban areas in the climate.
UHI equation developed in the simulation by Zhao et al (2014) using the method of
Lee et al (2011) is a non-linear equation. The linear form of the equation is as follows:
(1)
Where T is the temperature, C is the contribution, R is the radiation, H is convection, LE is
evaporation, S is storage, AH is anthropogenic heat, and e is the error rate arising from the
nonlinear form transformation. Simply put, this equation states that the UHI is the result of
the amount of heat by radiation, convection, evaporation, heat savings, and anthropogenic
Asian Academic Research Journal of Multidisciplinary
www.asianacademicresearch.org
45
heat convection is higher than the other heat in contributing to the UHI, and convection heat
donated by the surface roughness. Green land itself contributes heat through evaporation and
its contribution is smaller than the heat storage and heat radiation. Anthropogenic heat give
smallest contribution.
3.2. Contributors Variables for Each UHI Component
The first part in equation (1) is the radiation component. In the form of non-linear, the
radiation component of UHI expressed through the following equation:
(2)
Where λ0 is the local climate sensitivity, expressed through the equation
(3)
Where ε is the surface emissivity, σ is the Stefan-Boltzmann constant, and T is the surface
temperature.
f is the energy redistribution factor, expressed through the equation
(4)
Where ρ is air density, Cp is the specific heat of air at constant pressure, ra is the aerodynamic
resistance to heat diffusion, expressed through the equation
(5)
Where Ta is the temperature at the reference height and H is the sensible heat flux, and β is
the Bowen ratio, which is expressed through the equation
(6)
Where LE is the latent heat flux.
R*n is the apparent net radiation, expressed through the equation
(7)
Where is the albedo, is the incoming solar radiation, and is a long-wave radiation
coming.
In the above equation, ra, β, and R*n are parameters that come from human socio-technical
nature. The main component of the equation (2) is R*n because this term gives the
characteristics of the interaction between the material and the coming radiation. This
Asian Academic Research Journal of Multidisciplinary
www.asianacademicresearch.org
46
considered essential for UHI mitigation (Akbari et al., 2009). Even so, it determined again by
the sum of the radiation coming from the sun. In turn, this radiation determined by
meteorological factors, especially weather (Rong, 2006). On cloudy days, the radiation
coming less and therefore reduce the surface heating. Hence, UHI typically higher under
clear skies (Gosling et al., 2014). Furthermore, the weather effect is stronger than the surface
properties in developing UHI (Rosenzweig et al., 2006). Weather therefore, determinehow
much radiation coming from the sun to then interact with the material and apparent net
radiation. Based on these considerations, it can formulated the following hypothesis:
Hypothesis 1: The weather is negatively related to UHI intensity.
The second term in equation (1) is the rate that describes heat convection. This heat is
rarely studied in the earlier UHI studies (Arnfield, 2003). In non-linear, the second term
expressed as follows:
(8)
Where QS is the heat generated by the storage, QAH is the heat generated by anthropogenic
source, and Δf1 is the difference in energy redistribution factor, which is expressed through
the equation:
(9)
Δf1 is an important term in this equation because it contains the aerodynamic resistance to
heat diffusion. This term is the sum of the characteristics of the surface layer of the
atmosphere and the characteristics of the material at the lower limit. It determines the
material's ability to inhibit heat diffusion. Smooth material less able to inhibit heat diffusion,
and unable to prevent heat buildup.
Although it has elements of atmospheric, aerodynamic resistance can vary more
because of the materials used. In earlier studies using MODIS, this factor was not considered
because of methodological difficulties (Marpaung, 2009). Tursilowati (2007) see more
aerodynamic resistance to meteorological element to declare it as wind speed function. Even
so, should it be viewed as a factor determined by the roughness of roofing materials
that determinethe behavior of the wind as an agent convection (Voogt and Grimmond, 2000).
Asian Academic Research Journal of Multidisciplinary
www.asianacademicresearch.org
47
largest component of UHI. Therefore, a more rational put roughness characteristics of
materials as a major factor in determining the UHI.
Hypothesis 2: Surface roughness of roof coverings negatively related to the intensity of the
UHI.
The third term of equation (1) is a heat rate of evaporation. It formulated by the
following non-linear:
(10)
Where
(11)
This term called evaporative heat rate for Bowen ratio (β) which reduced due to more
radiation energy channeled through the surface latent heat flux (Zhao et al., 2014), especially
during post-rain. Traditionally, this is the most powerful heat effect due to the denser
vegetation in wetlands will have a high evaporation rate compared to other materials.
Evaporation can come from soil or cover material from the blue land such as ponds and pools
(Golden, 2004). However, the main factor is the vegetation (Brazel et al., 2009). In addition
to providing an increased rate of evaporation, the vegetation is also useful to prevent
radiation coming to the surface so it is also relevant to the radiation rate (Valsson and Bharat,
2009). However, this research carried out in the context of the housing with the rest of the
land is very limited. In contrast to urban areas which can grow large trees, mainly for
sidewalks shade and parks, housing does not have this ability. As a result, the green land area
will be very little and negligible to the UHI. Because the author conducted a study on
housing, the author suspect the absencerelationship between the ratio of green areas to the
built areas.
Hypothesis 3: The ratio of green to built areas not related to the intensity of the UHI
The fourth term is the rate of heat storage equation. Non-linear equation for storage
rate is as follows:
(12)
Heat storage material associated with the ability to absorb energy. In urban areas, the
storage of heat coming from the broad opaque area and narrow view of the sky (Jahan, 2013).
This heat stored in buildings and the roof and walls (Hamdi and Schayes, 2008). In addition,
Asian Academic Research Journal of Multidisciplinary
www.asianacademicresearch.org
48
and Chow, 2013). Of a number of factors, roads and buildings is the strongest (Dodman,
2009). This study conducted in a residential neighborhood where the main factor is
the building. Building factor in this case is high because of the housing tends to have the
same size in length x width dimensions but not the height dimension. The higher the building,
the greater the heat storage ability of the building. Therefore, the author suspect that a large
building will show greater intensity of the UHI.
Hypothesis 4: House height is positively related to the intensity of the UHI
Last term associated with anthropogenic heat. The underlying equation is:
(13)
The equation shows that in general the contribution of anthropogenic heat to the UHI is
linear, straight from the magnitude of the anthropogenic heat.
Anthropogenic heat comes from human activities such as energy use, Air
Conditioning, and respiratory (van Ooststroom, 2011). In addition, motorized vehicle can
also be viewed as a source of anthropogenic heat (Chow and Roth, 2006). Nelson (2011) uses
the energy density, which defined as the ratio of energy consumption to the building area. In
three dimensions, it can expressed as the ratio of the energy consumption to the building
volume. This makes sense because the energy density reflects the amount of energy used in a
home by humans. This makes the researcher suggest that there is a relationship between
energy density and intensity of the UHI.
Hypothesis 5: Energy density is positively related to the intensity of the UHI
4. Methodology
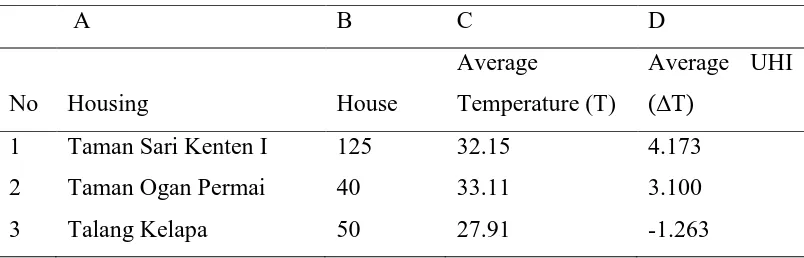
This analysis based on survey results in Taman Sari Kenten I, outside Palembang. The
coordinates of the location is 2°54'4.46"S and 104°46'4.95"E. This settlement chosen
because it reflects high UHI profile than the two other housing included in the first survey:
Talang Kelapo (2°56'31.27"S; 104°41'17.38"E) and Taman Ogan Permai Jakabaring (3°
1'36.98"S; 104°46'42.05"E). The residential site are also closer to rural areas than two other
housing.
Information gathered through field measurements, observations, and interviews with
residents. Samples taken covering the house in Taman Sari Kenten include 231 homes. By
removing the house that has not been occupied and not allow to collect the data, the total
Asian Academic Research Journal of Multidisciplinary
www.asianacademicresearch.org
49
Researcher first peforming temperature measurements at three meters from the front
door of the house and a height of 2 meters above ground level. This would characterie the
CLUHI (Canopy-Layer UHI) (Martin et al., 2014). After the measurement, the researcher
collect the dimensions of the house, the weather measurement, identify the type of roof
covering, and the area of green areas and the house. Researcher asked residents about the
number of occupants in the house and monthly energy consumption on average.
The total sample of 125 homes have enough adequacy for regression using the effect
size of 0.20; alpha 0.05; power 0.95; and the number of predictors 5 using G * Power 3.0.10
software.
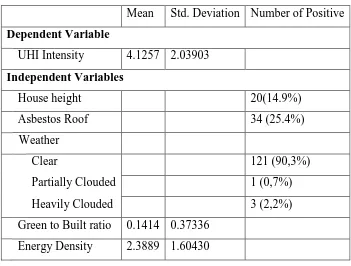
Table 1 presents the descriptive statistics related to the study variables.
Majority homes (78.4%) have only one level. This measure reflects the average house height
in similar housing. Looking at this size, the ratio of green to built quite surprising: half
(55.2%) of the house has a ratio of 0 which means it has no green space at all.
Type of roof covering measured in this study reflects asbestos cover. Actually there
are four types of roofing inTaman Sari Kenten: asbestos, tile, multiroof, and zinc. However,
observations show that asbestos have different roughness of the other three types of roof
coverings. Asbestos, even if thin, has a rougher surface than tile,multiroof, and zinc. It shown
from moss inability to cover the asbestos roof. Tile, multiroof, and zinc, have a waving
pattern and the same shape. All three wave-shaped and has a high surface smoothness. On the
old tile roof, moss can stick because basically the raw material of this roof is ground and this
adds to the smoothness of the surface. At the time of rain, dirt in the tile, multiroof, and
zinc can be immediately washed and updated surface becomes even more slippery than
before. This does not apply to asbestos which has more micro roughness, although that also
have a wavy pattern. Therefore, the researcher decided asbestos as the most rugged roof.
25.4% of homes have asbestos cover.
Most of the houses occupied by 5 people (32.8%). There are 3 houses inhabited by
seven people and six houses inhabited by only two people. Energy units in this study used
rupiahs because respondents more easily stated their energy use based on the average
monthly payment for their electricity consumption. In the total population, the average energy
Asian Academic Research Journal of Multidisciplinary
www.asianacademicresearch.org
50
Table 1. Descriptive Statistics
Mean Std. Deviation Number of Positive
Dependent Variable
UHI Intensity 4.1257 2.03903
Independent Variables
House height 20(14.9%)
Asbestos Roof 34 (25.4%)
Weather
Clear 121 (90,3%)
Partially Clouded 1 (0,7%)
Heavily Clouded 3 (2,2%)
Green to Built ratio 0.1414 0.37336
Energy Density 2.3889 1.60430
4.1. Operationalization of Variables
The main strength of this study is perform a direct measurement of the
study location and carried out by providing clear and micro boundaries. The dependent
variable is the UHI intensity expressed as the difference between the temperature of the
measurement site with a temperature at the reference point in rural area provided by
Indonesian Agency for Meteorological, Climatological and Geophysics Station.
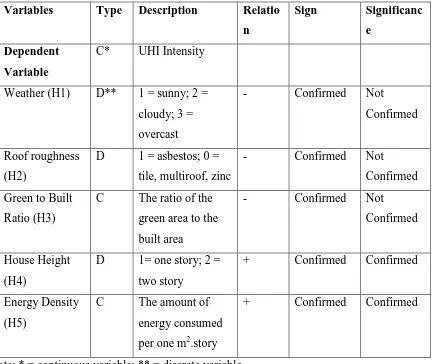
Table 2 describes the key variables tested and the sign hypothesized about their
relationship with the UHIintensity (analysis results are also summarized in this table);
relationships tested using multiple linear regression model. Correlation analysis showed that
there is no multicollinearity between the independent variables of the study. The independent
variables consist of five groups. The first is the weather. The weather coded 1 for sunny
weather, 2 to cloudy, and 3 to overcast. The weather is known by observation simultaneously
with temperature measurement. The second is the roof surface roughness. Asbestos
surface coded 1 and non-asbestos coded 0. This roof surface roughness indicator is known by
observation when the temperature measurement. Third is the ratio of green space to
built space. The ratio calculated by dividing the land area covered by extensive plant and the
built environment such as house, roads, and ceramics or cement covered veranda. Fourth is
house height. Building with one level codenamed 1 and two-story building coded 2. These
Asian Academic Research Journal of Multidisciplinary
www.asianacademicresearch.org
51
energy density. Energy density measured by dividing the monthly electricity consumption by
the volume of the house (length x width x height).
Table 2. Variables Description and Summary of the Research
Variables Type Description Relatio
n
Note: * = continuous variable; ** = discrete variable
5. Results, Findings, and Discussion
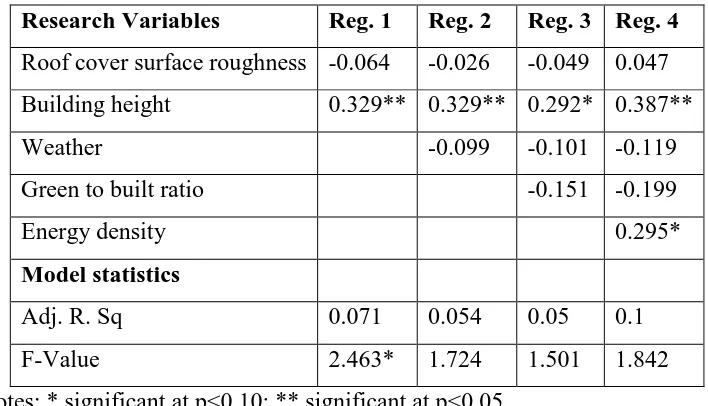
The results of the four models to explain UHI intensity presented in Table 3.
Researchers using stepwise selection method. Variables entered in line with the findings
of Zhao et al (2014) on the level of influence of the factors of the UHI. The regression model
showed statistical evidence of a relationship between UHI intensity and the array of factors
that presented before by the theory. Only the first model significant at the level of p <0.10.
Three other models are at are not significant.
Regression 1 test hypothesis that roof roughness and house height influence
the UHI intensity. Only height showing significant effect. However, the two variables show
the expected sign. In the second step, the weathervariables included in the model, but found
Asian Academic Research Journal of Multidisciplinary
www.asianacademicresearch.org
52
regression 3 did not show significance of green to built radio, but did show the expected sign.
Finally, regression 4 examines the relationship between energy density with the dependent
variable. Energy density is found to relate positively and significantly (p <0.10) to
the UHI intensity.
Table 3. Linear Regression Model
Research Variables Reg. 1 Reg. 2 Reg. 3 Reg. 4
Roof cover surface roughness -0.064 -0.026 -0.049 0.047
Building height 0.329** 0.329** 0.292* 0.387**
Weather -0.099 -0.101 -0.119
Green to built ratio -0.151 -0.199
Energy density 0.295*
Model statistics
Adj. R. Sq 0.071 0.054 0.05 0.1
F-Value 2.463* 1.724 1.501 1.842
Notes: * significant at p<0.10; ** significant at p<0.05
Against the second hypothesis, the researcher investigated the relationship of
roughness roof coverings with UHI intensity. All regression showed no significant correlation
and regression 4 even showing signs change. This result is important, because it shows that
the heat convection is not a major factor contributing to the UHI in the housing area. These
characteristics distinguish between residential areas with urban areas dominated by
convection.
High house provide large heat storage because it doubled the size of the home and the
ability to accommodate heat. Hypothesis 4 confirmed; the higher the house, the
greater the UHI intensity. These results are consistent with earlier studies in the urban context
(Ng, 2011; Alcoforado and Andrade, 2006; Chan et al., 2007). High-building is an important
factor in explaining the UHI intensity, especially in providing storage UHI.
Accordance the results of earlier studies (Chow and Roth, 2006 and Elsayed, 2012)
and the first hypothesis, the researcher found a negative relationship between weather
with UHI intensity. However, this relationship was not significant. These results indicate that
heat radiation does not contribute strongly to the UHI on housing.
Researchers did not find a significant association between green to built ratio
with UHI intensity; although the sign of the corresponding correlation confirmed; and hence
Asian Academic Research Journal of Multidisciplinary
www.asianacademicresearch.org
53
diversity on these ratios. 55.2% have a ratio of 0 which indicates the house did not have a
green land. Therefore, there is a strong bias in the house that has a green land. Therefore, it
may not deserve to tested statistically.
Hypothesis 5 confirmed, in line with the results of earlier studies. The research found
a significant relationship between energy density and intensity of the UHI.
6. Policy Implications
Overall, two variables was found in this study are significant effect on UHI intensity:
building height and energy density. However, we must understand the weaknesses of research
due to the small sample size and the tentative nature of these policy discussions. The
argument can put forward to focus on key areas that must addressed and further studied both
by policy makers as well as by researchers.
The first significant variable is the height of the building. High building reflects heat
savings in the urban context is actually just became the second strongest contributor
to the UHI intensity, weaker than convection heat. Housing characteristics with narrow
distance and functions as residence make it a perfect place for large heat storage.
Contributions of heat stored by this house is greater than heat convection due to high roof
coverings in two-storey houses. The second significant variable is the energy density. This
variable is anthropogenic and, in the urban context, is a negligible factor in causing the UHI.
However, because housing is a residence and thus become the center of human activity on an
ongoing basis, the anthropogenic heat becomes very meaningful. Combined with tall houses
and large energy contained in it, houses in a residential area is a large heat source in rural
areas. We don't even take into account the heat from the heat caused by the highway.
A number of policy implications for local government can drawn from the above
findings, especially since the growth rate of housing in the area outside the city continues to
grow in regions outside Java.
6.1. Implications on Building Height
Most homes in residential areas outside the city built standardized with a permanent
roof. However, homeowners have the freedom to add the roof. This indicated by grow houses
type, built by temporary cement roof to increase the level. Options to increase the home are
even more likely when there is no way to extend the house to the side due to the distance in
the adjoining residential houses. This study found that by increasing the level of the house,
the house became a source of heat because it absorbs more heat from the environment. A
Asian Academic Research Journal of Multidisciplinary
www.asianacademicresearch.org
54
and it absorb heat without hindrance. This is probably because in general the house built after
the soil covered and it means no more trees covering the ground, while the tree serves to
prevent heat exposed to the level of the house. Therefore, researcher suggest that:
1. Local governments need to build local laws that prohibit home in a residential area
to add height to increase the level. If you want to increase the level, then there
must exist a heat convection solvers such as roof with rough surface or protrusion
in many levels, planting greenery on the outskirts of the level, or not to use a level
to the source of electrical energy which is greater than the original level of the
building.
2. Housing developers must provide a large tree that can prevent the heat stored in
the building level. This tree needs to installed on the roadside so that the heat from
the sun blocked to enter the second level.
3. Residents should plan carefully when adding the level of their home. This plan is
not only economical but calculating environmental impact that can provided
by new level addition, both for residents and for the community.
6.2. Implications for Energy Density
As a place to live, houses in residential areas provide great
anthropogenic heat contribution to UHI formation. This leads to the houses in a residential
area as a large heat storage box where heat comes not only from the outside, but from the
activity in the building itself. This heat leak out and enhancing the temperature in housing
area, adding that the existing heat from the sun. Therefore, researcher suggest:
1. Local governments should implement energy policies by providing electricity
consumption limit allowed for a certain volume of the house. This will encourage
residents to increase the level if greater energy consumption inevitable. To that
end, the policy of the addition rate must also be given.
2. Housing developers can consider the power restrictions for the size of a particular
house not to exceed the limits that can improve the overall ambient temperature.
3. Residents need to consider more about power consumption, especially that
generate heat such as Air Conditioning.
7. Conclusion
UHI phenomenon that occurs in a residential area outside the city is still far from the
attention in the academic literature. This is due to the region seen as micro in size and
Asian Academic Research Journal of Multidisciplinary
www.asianacademicresearch.org
55
heat island compared to the surrounding rural areas where they located. This paper examines
this aspect further using housing profiles with significant UHI intensity in the tropics.
One of the strengths of this analysis is the uniqueness of the data source that collected
from residential areas. Previous studies, especially Zhao et al (2014) found that based on the
strength of its contribution, a source of heat for the urban area is the convection, heat storage,
radiation, evaporation, and anthropogenic heat. This study found that in the context of
housing, the main source of heat is the heat storage, anthropogenic heat, evaporation,
radiation, and finally convection. These results show the characteristics of housing outside
the city which is different from the urban characteristics. Heat storage and anthropogenic heat
become the main source of reasonableUHI in housing because this region is a place where
human activities take place in a sustainable and comprehensive way.
Future studies need to develop a study of anthropogenic heat contribution on the UHI,
included the heat of the vehicle and human activities outside the home, but still in the
residential complex. Future studies also need to learn more about the mechanisms that lead
more tall buildings generate more heat than short buildings. Various mechanisms can
proposed and in this study, the mechanism proposed is the heat storage mechanism. Given the
nature of the non-linear equation of UHI, we needs further examination of other mechanisms
that contribute to the increase in temperature due to level addition.
Finally, in line with the rapid growth of housing in the area outside the city, local
authorities and housing developers need to pay attention to policies in sustainable
development of housing, so it not become a large source of heat that can reduce the feeling of
comfortable living in rural areas. If the suggestions accepted and applied, housing outside the
city can become a main attraction for urban residents and provide great added value for the
residents of the city who want to reside outside the city.
Appendices
Table 3. UHI Profile of Three Housing in Palembang
A B C D
No Housing House
Average
Temperature (T)
Average UHI
(ΔT)
1 Taman Sari Kenten I 125 32.15 4.173
2 Taman Ogan Permai 40 33.11 3.100
Asian Academic Research Journal of Multidisciplinary
www.asianacademicresearch.org
56
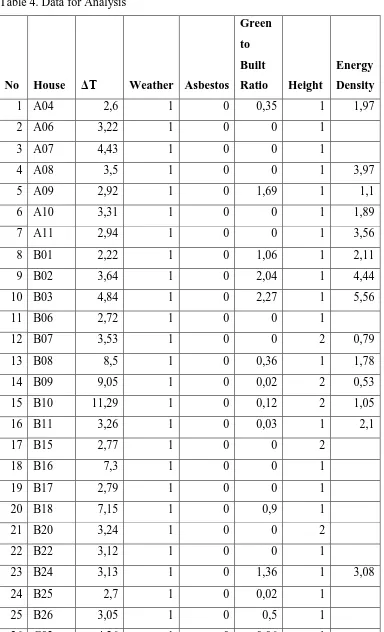
Table 4. Data for Analysis
No House ΔT Weather Asbestos
Green
to
Built
Ratio Height
Energy
Density
1 A04 2,6 1 0 0,35 1 1,97
2 A06 3,22 1 0 0 1
3 A07 4,43 1 0 0 1
4 A08 3,5 1 0 0 1 3,97
5 A09 2,92 1 0 1,69 1 1,1
6 A10 3,31 1 0 0 1 1,89
7 A11 2,94 1 0 0 1 3,56
8 B01 2,22 1 0 1,06 1 2,11
9 B02 3,64 1 0 2,04 1 4,44
10 B03 4,84 1 0 2,27 1 5,56
11 B06 2,72 1 0 0 1
12 B07 3,53 1 0 0 2 0,79
13 B08 8,5 1 0 0,36 1 1,78
14 B09 9,05 1 0 0,02 2 0,53
15 B10 11,29 1 0 0,12 2 1,05
16 B11 3,26 1 0 0,03 1 2,1
17 B15 2,77 1 0 0 2
18 B16 7,3 1 0 0 1
19 B17 2,79 1 0 0 1
20 B18 7,15 1 0 0,9 1
21 B20 3,24 1 0 0 2
22 B22 3,12 1 0 0 1
23 B24 3,13 1 0 1,36 1 3,08
24 B25 2,7 1 0 0,02 1
25 B26 3,05 1 0 0,5 1
26 C02 4,26 1 0 0,06 1
Asian Academic Research Journal of Multidisciplinary
www.asianacademicresearch.org
57 No House ΔT Weather Asbestos
Green
to
Built
Ratio Height
Energy
Density
28 C05 4,55 1 0 0 1
29 C06 3,43 1 0 0 1 1,95
30 C08 2,91 1 0 0,18 1
31 C09 2,83 1 0 0 1
32 C14 3,17 1 0 0,02 1
33 C15 4,68 1 0 0,11 1
34 C16 4,12 1 0 0 1
35 C17 4,51 1 0 0,44 1
36 D02 2,94 1 0 0,43 1
37 D03 3,89 1 0 0,16 1
38 D06 3,06 1 1 0,08 1 1,85
39 D07 3,17 1 0 0 2
40 D09 2,88 1 0 0,28 1
41 D10 3,52 1 0 0,1 1
42 D11 4,31 1 0 0,03 1
43 D13 4,18 1 0 0 1 2,36
44 D15 6,83 1 1 0,09 1 1,9
45 D16 2,91 3 1 0,1 1 1,9
46 D17 2,73 3 0 0,06 1
47 D18 1,91 1 0 0,02 2 1,81
48 D20 2,3 1 0 0 1 2,09
49 D21 2,25 1 0 0 1 2,16
50 D22 1,92 1 0 0 1
51 D23 2,02 1 0 0,17 1
52 D24 1,97 1 0 0,07 1 1,03
53 D25 2,54 3 0 0,05 1
54 D26 2,89 1 0 0 1
Asian Academic Research Journal of Multidisciplinary
www.asianacademicresearch.org
58 No House ΔT Weather Asbestos
Green
to
Built
Ratio Height
Energy
Density
56 D28 2,72 1 0 0,27 1
57 E01 2,67 1 0 0,07 1
58 E02 8,76 1 0 0,07 1
59 E06 3,52 1 0 0 2
60 E07 3,2 1 0 0 2
61 E12 2,5 1 0 0 1
62 E15 8,74 1 0 0 2 2,53
63 E16 9,23 1 0 0,09 1
64 E17 9,02 1 0 0 2 0,71
65 E18 8,31 1 0 0,1 1
66 E20 1,28 2 1 0 1
67 E22 9,15 1 0 0,18 1 1,79
68 E24 9,51 1 0 0,17 1 3,27
69 E28 9,16 1 0 0 1 2,82
70 E29 9,23 1 0 0 1 7,36
71 F02 6,18 1 0 0,02 1
72 F03 6,02 1 0 0,02 1
73 F05 6,8 1 0 0 1 6,88
74 F07 5,5 1 0 0,02 1 2,11
75 F09 7,17 1 0 0,04 1 1,35
76 F12 5,81 1 0 0 2 2,03
77 F14 3 1 0 0,36 2
78 F15 2,59 1 0 0,14 1
79 F17 4,15 1 0 0 1
80 F18 3,93 1 0 0 1
81 F19 3,06 1 0 0 1
82 F20 4,85 1 0 0 1
Asian Academic Research Journal of Multidisciplinary
www.asianacademicresearch.org
59 No House ΔT Weather Asbestos
Green
to
Built
Ratio Height
Energy
Density
84 F24 4,1 1 0 0 1
85 F26 4,32 1 0 0 1
86 G03 3,91 1 0 0 1 1,62
87 G04 4,41 1 0 0,02 2
88 G09-10 3,33 1 1 0,02 1
89 H01 5,3 1 0 0,07 2
90 H02 3,95 1 0 0 2
91 H03 3,05 1 1 0 1
92 H04 3,31 1 1 0 1
93 H05 2,87 1 1 0 1
94 H06 3,61 1 1 0 1
95 H10 3,18 1 1 0,52 1 0,62
96 H11 2,44 1 1 0 1
97 H15 4,17 1 0 0 1
98 H18 3,32 1 1 0 1
99 I01 4,52 1 1 0 1
100 I02 2,67 1 1 0 1
101 I03 3,96 1 0 0 2
102 I04 3,24 1 1 0 1 0,92
103 I05 4,28 1 1 1,38 1
104 I09 1,9 1 1 0 1
105 I10 3,26 1 1 0,05 2
106 I12 1,9 1 1 0 1
107 I17 2,09 1 1 0,09 2
108 I19 3,15 1 0 0 1
109 I20 6,58 1 1 0 1 1,18
110 I21 4 1 0 1 5,52
Asian Academic Research Journal of Multidisciplinary
www.asianacademicresearch.org
60 No House ΔT Weather Asbestos
Green
to
Built
Ratio Height
Energy
Density
112 J03 3,56 1 1 0 1
113 J05 1,84 1 1 0 1
114 J07 1,96 1 0 0 1
115 J09 4,19 1 0 0,02 2
116 J11 3,49 1 1 0 1
117 J13 4 1 1 0 1
118 J14 3,66 1 1 0 1
119 J15 3,98 1 1 0 1
120 J16 2,28 1 1 0 1
121 J17 4,44 1 1 0 1
122 J18 5 1 1 0 1
123 L04 2,57 1 1 0,3 1
124 L06 2,18 1 1 0 1
Asian Academic Research Journal of Multidisciplinary
www.asianacademicresearch.org
61 References
Akbari, H., Menon, S. & Rosenfeld, A. 2009. Global cooling: increasing world-wide urban
albedos to offset CO2. Climatic Change, 95 (3-4), 275-286
Alcoforado, M-J. & Andrade, H. 2006. Nocturnal urban heat island in Lisbon (Portugal):
main features and modelling attempts. Theor. Appl. Climatol. 84, 151–159
Anderson, C.A., Bushman, B.J. & Groom, R.W. 1997. Hot Years and Serious and Deadly
Assault: Empirical Tests of the Heat Hypothesis. Journal of Personality and Social
Psychology, 73(6), 1213-1223
Arnfield, A.J. 2003. Two Decades of Urban Climate Research: A Review of Turbulence,
Exchanges of Energy and Water, and the Urban Heat Island. Int. J. Climatol. 23, 1–26
Blazejczyk, K., Epstein, Y., Jendritzky, G., Staiger, H. & Timz, B. 2012. Comparison of
UTCI to Selected Thermal Indices. Int J Biometeorol 56, 515-535
Bloom, D.E. & Khanna, T. 2007. The Urban Revolution. Finance and Development, 44 (3),
9-14
Brazel, A., Gober, P., Clarke, S.G., Myint, S., Quay, R., Miller, A.Q., Rossi, S. & Grimmond,
S. 2009. Mitigating Urban Heat Island Effects with Water- and Energy-Sensitive
Urban Designs. (Paper presented at the 89th American Meteorological Society Annual
Meeting, Phoenix, Arizona)
Chan, C.F., Lebedeva, J., Otero, J. & Richardson, G. 2007. Urban Heat Islands: A Climate
Change Adaptation Strategy for Montreal. (CCAP Final Report for Montreal Services
des Infrastructures, Transport et Environnement)
Chow, W.T.L. & Roth, M. 2006. Temporal Dynamics of the Urban Heat Island of Singapore.
International Journal of Climatology, 26, 2243-3360. DOI 10.1002/joc.1364
Connors, J.P., Galletti, C.S. & Chow, W.T.L. 2013. Landscape configuration and urban heat
island effects: assessing the relationship between landscape characteristics and land
surface temperature in Phoenix, Arizona. Landscape Ecol 28, 271–283. DOI
10.1007/s10980-012-9833-1
Dodman, D. 2009. Urban Form, Greenhouse Gas Emissions and Climate Vulnerability. (In
J.M. Guzman, G. Martine, G. McGranahan, D. Schensul, & C. Tacoli (Eds.),
Population Dynamics and Climate Change (pp. 64-79). New York: UNFPA; London:
Asian Academic Research Journal of Multidisciplinary
www.asianacademicresearch.org
62
Elsayed, I.S.M. 2012. Mitigation of the Urban Heat Island of the City of Kuala Lumpur,
Malaysia. Middle-East Journal of Scientific Research 11 (11), 1602-1613. DOI
10.5829/idosi.mejsr.2012.11.11.1590
Ernawi, I.S. 2010. Morfologi – Transformasi dalam Ruang Perkotaan yang berkelanjutan
(Transformation-Morphology in Sustainable Urban Space). (Paper presented at
Indonesian Graduate Program National Seminar, Semarang)
Febriana, E. 2008. Kinerja Pengendalian Pemanfaatan Lahan Rawa Di Kota Palembang
(Swamp Land Use Control Performance in Palembang). Master Thesis, Universitas
Diponegoro
Fischer, E.M. & Schär, C. 2010. Consistent geographical patterns of changes in high-impact
European heatwaves. Nature Geoscience. DOI: 10.1038/NGEO866
Golden, J.S. 2004. The Built Environment Induced Urban Heat Island Effect in Rapidly
Urbanizing Arid Regions – A Sustainable Urban Engineering Complexity.
Environmental Sciences, 1(4), 321-349. DOI 10.1080/15693430412331291698
Gosling, S.N., Bryce, E.K., Dixon, P.G., Gabriel, K.M.A., Gosling, E.Y., Hanes, J.M.,
Hondula, D.M., Liang, L., Lean, P.A.B.M., Muthers, S., Nascimento, S.T., Petralli,
M., Vanos, J.K., Wanka, E.R. 2014. A Glossary for Biometeorology. Int J Biometerol.
58:277-308. DOI 10.1007/s00484-013-0729-9
Hamdi, R. & Schayes, G. 2008. Sensitivity study of the urban heat island intensity to urban
Characteristics. Int. J. Climatol. 28, 973–982. DOI 10.1002/joc.1598
Hidayati. R. 1990. Kajian Iklim Kota Jakarta, Perubahan dan Perbedaan dengan daerah
Sekitarnya (Climate Studies of Jakarta, Changes and Differences with the
Surrounding Area). Master Thesis, Institut Pertanian Bogor
Hoek-Smit, M.C. 2005. The Housing Finance Sector in Indonesia. (Philadelphia: University
of Pennsylvania)
Jacobson, M.Z. & Ten Hoeve, J.E. 2011. Effects of Urban Surfaces and White Roofs on
Global and Regional Climate. J. Clim 25, 1028–1044
Jahan, K.N. 2013. Spatial Analysis of Transect Zone and Land Surface Temperature: A Case
Study on Hamilton County, Ohio. Master Thesis, University of Cincinnati
Juliantina, I. 2012. Peran Peningkatan Infrastruktur Jalan dalam Pertumbuhan Perekonomian
Kota Palembang (Role of Road Infrastructure Improvement in Economic Growth of
Asian Academic Research Journal of Multidisciplinary
www.asianacademicresearch.org
63
Karyono, T.H. 1995. Higher PMV causes higher energy consumption in air conditioned
buildings: A case study in Jakarta, Indonesia. (In F. Nicol, M. Humphreys, O. Sykes,
& S. Roaf (Eds.), Standard for Thermal Comfort: Indoor air temperatures for the 21st
century. London: E&FN Spon and Chapman & Hall
Lee, X. et al. 2011. Observed increase in local cooling effect of deforestation at higher
latitudes. Nature 479, 384–387
Lo, C.P. & Quattrochi, A. 2003. Land-Use and Land-Cover Change, Urban Heat Island
Phenomenon, and Health Implications: A Remote Sensing Approach.
Photogrammetric Engineeering and Remote Sensing, 69(9), 1053-1063
Marpaung, F. 2009. Urban Thermal Analysis of MODIS Images for Examining Heat Island
Effects in Jakarta, Indonesia. Master Thesis, China National Central University
Martin, P., Bandomin, Y. & Gachon, P. 2014. An Alternative Method to Characterize the
Surface Urban Heat Island. Int J Biometeorol DOI 10.1007/s00484-014-0902-9
Nelson, C.S. 2011. Influences of Landscape and Lifestyle on Home Energy Consumption: A
Case Study of Raleigh, NC. Master Thesis, North Carolina State University
Ng, E. 2011. Towards planning and practical understanding of the need for meteorological
and climatic information in the design of high-density cities: A case-based study of
Hong Kong. Int. J. Climatol. DOI 10.1002/joc.2292
Oleson, K.W. et al. 2010 Technical Description of Version 4.0 of the Community Land Model
(CLM) 257. Report No. NCAR/TN-4781STR (NCAR)
Peng et al. 2012. Surface Urban Heat Island Across 419 Global Big Cities. Sci. Technol., 46,
696−703
Robinson, W.H. 2005. Handbook of Urban Insects and Arachnids. (Cambridge: Cambridge
University Press)
Rong, F. 2006. Impact of Urban Sprawl on U.S. Residential Energy Use. Dissertation,
University of Maryland
Rosenzweig, C., Solecki, W.D. & Slosberg, R.B. 2006. Mitigating New York City’s Heat
Island with Urban Forestry, Living Roofs, and Light Surfaces. (New York City
Regional Heat Island Initiative Final Report 06-06)
Taha, H. 1997. Urban climates and heat islands: albedo, evapotranspiration, and
anthropogenic heat. Energy and Buildings 25, 99-103
Tursilowati, L. 2007. Use of Remote Sensing and GIS to Compute Temperature Humidity
Asian Academic Research Journal of Multidisciplinary
www.asianacademicresearch.org
64
(LULC) in Surabaya. (Paper presented at the 73rd International Symposium on
Sustainable Humanosphere, Bandung).
Tursilowati, L. 2009. Urban Heat Island dan Kontribusinya pada Perubahan Iklim dan
Hubungannya dengan Perubahan Lahan (Urban Heat Island and Its Contribution to
Climate Change and Its Relationship with the Land Amandment). (Paper presented at
National Seminar of Global Warming and Climate Change – Facts, Mitigation, and
Adaptation, Malang)
Unger J., Sümeghy Z., Gulyás Á., Bottyán Z, & Mucsi L. 2001. Land-use and meteorological
aspects of the urban heat island. Meteorol Appl 8, 189–194
United States Department of Energy (USDE). 2009. Review and Critical Analysis of
International UHI Studies. Washington DC: USDE
Upchurch, M.C. 2005. Green Infrastructure: The Landscape of Urban EcoHousing. Master
Thesis, Virginia Polytechnic Institute
Valsson, S. & Bharat, A. 2009. Urban Heat Island: Cause for Microclimate Variations.
Architecture – Time Space and People, 20-25
van Ooststroom, H. 2011. Urban Heat Island adaptation through Urban Planning and Design:
the struggle of the city of Los Angeles. Master Thesis, Vienna University of
Economics and Business
Voogt, J.A. & Grimmond, C.S.B. 2000. Modeling Surface Sensible Heat Flux Using Surface
Radiative Temperatures in a Simple Urban Area. Journal of Applied Meteorology, 39,
1679-1699
Woehr, M. 2007. DownHome: Accommodating Identity, Ownership and Permanence in
Urban Housing. ARCH 549 University of Oregon
Wong, M.S., Nichol, J.E., To, P.H. & Wang, J. 2010. A Simple Method for Designation of
Urban Ventilation Corridors and its Application to Urban Heat Island Analysis.
Building and Environment, 45, 1880-1889
Yoyok, T.W.S., Setiawan, B. & Setiadi. 1997. Proses Transformasi Spasial dan
Sosio-Kultural Desa-Desa di Daerah Pinggiran Kota di Indonesia (Spatial Transformation
and Socio-Cultural Process of Villages in Suburbs in Indonesia). Yogyakarta:
University of Gadjah Mada Press
Zhao, L., Lee, X., Smith, R.B. & Oleson, K. 2014. Strong contributions of local background