DOI: http://dx.doi.org/10.21609/jiki.v7i2.257
MACULAR EDEMA CLASSIFICATION USING SELF-ORGANIZING MAP AND GENERALIZED LEARNING VECTOR QUANTIZATION
Rizal Adi Saputra, Yuwanda Purnamasari Pasrun, and Amalia Nurani Basyarah
Department of Informatics, Faculty of Information Technology, Institut Teknologi Sepuluh Nopember, Kampus ITS Sukolilo, Surabaya, 60111, Indonesia
E-mail: [email protected] Abstract
Macular edema is a kind of human sight disease as a result of advanced stage of diabetic retinopathy. It affects the central vision of patients and in severe cases lead to blindness. However, it is still difficult to diagnose the grade of macular edema quickly and accurately even by the medical doctor's skill. This paper proposes a new method to classify fundus images of diabetics by combining Self-Organizing Maps (SOM) and Generalized Vector Quantization (GLVQ) that will produce optimal weight in grading macular edema disease class. The proposed method consists of two learning phases. In the first phase, SOM is used to obtain the optimal weight based on dataset and random weight input. The second phase, GLVQ is used as main method to train data based on optimal weight gained from SOM. Final weights from GLVQ are used in fundus image classification. Experimental result shows that the proposed method is good for classification, with accuracy, sensitivity, and specificity at 80%, 100%, and 60%, respectively.
Keywords: Fundus Image, GLVQ, Macular Edema, SOM
Abstrak
Edema makula adalah jenis gangguan penglihatan sebagai akibat dari diabetik retinopati stadium lanjut. Penyakit ini mempengaruhi pusat penglihatan pasien dan dalam kasus yang parah dapat menyebabkan kebutaan. Namun, diagnosis tingkatan penyakit edema makula secara cepat dan akurat masih sulit, meskipun dilakukan oleh dokter. Makalah ini mengusulkan sebuah metode baru klasi-fikasi citra fundus penderita diabetes dengan menggabungkan Self-Organizing Maps (SOM) dan Ge-neralized Vector Quantization (GLVQ) untuk menghasilkan bobot optimaldalam klasifikasi kelas pe-nyakit edema makula. Metode yang diusulkan terdiri dari dua tahap proses pelatihan. Pada tahap per-tama, SOM digunakan untuk mendapatkan bobot optimal berdasarkan dataset dan masukan bobot se-cara random. Tahap kedua, GLVQ digunakan sebagai metode utama untuk melatih data berdasarkan bobot optimal yang diperoleh dari SOM. Bobot akhir dari GLVQ akan digunakan dalam klasifikasi citra fundus. Hasil pengujian menunjukkan hasil klasifikasi yang baik, dengan akurasi, sensitivitas, dan spesifisitas masing-masing 80%, 100%, dan 60%.
Kata Kunci:Citra Fundus, GLVQ, Makula Edema, SOM
1. Introduction
Fundus examination is widely used in detection of diseases whose symptoms related to human eyes. Digital fundus images can provide information on pathological changes caused by eye’s abnormality and systemic diseases. Common diseases that can be identified from the changing of pathologies of the human eye are Diabetic Retinopathy (DR), Macular Edema (ME) and Glaucoma [1].
Macular Edema (ME) is a common eye dise-ase, an advance stage of diabetic retinopathy (DR) caused by the increasing amount of insulin in blo-od. It is one of the leading cause of blindness in industrialized countries [2]. ME is a progressive disease but early detection and diagnosis of ME
can save vision loss. Skills of a medical doctor are necessary to measure diabetic macular edema gra-de, but within a short time, it is still difficult to di-agnose the condition of many examinees accura-tely. Therefore, a quick and reliable diagnosis me-thod is needed. Meme-thods to diagnose diabetic ma-cular edema have been proposed by some recent research. [3] used a detailed feature set and Gaus-sian mixtures model based classifier, new hybrid classifier. [4] used bayesian decision rule to class-ify ME grade.
Optimal weight is important in classification phase, because of its representation of data sample from each class. Optimal weight can be obtained from learning phase or input by user. The learning method with high accuracy have been proposed
Image Training
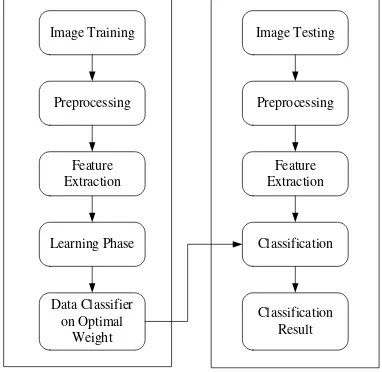
Figure 1. The Proposed Methodology
by some recent research using different data. [5] developed LVQ2.1 and made GLVQ algorithm to recognize chinese character and yields the accu-racy of 100%.GLVQ along with last mean square used by [6] to generate confidence maps for each feature point in facial feature detection and has accuracy of 99.1%. SOM and LVQ combined to classify fundus image in glaucoma disease classi-fication by [7] with 69.7% of accuracy. [8] also proposed combination of SOM method with LVQ 3 to diagnose fault on motor based on its sound and the result was 100% for its accuracy.
Because of good performance from the result of previous research, this paper proposes a new method combining SOM and GLVQ to train im-age. This combination is hoped to handle fundus image classification to diagnose macular edema and make good classification.
2. Methods
This paper proposes learning phase to classify ma-cular edema disease class based on fundus image includes preprocessing and feature extraction pro-cess as shown in Figure 1.
Dataset
Fundus image dataset as shown in Figure 2 were downloaded from Messidor digital retinal images database [9]. There are 40 images segmented from different labeled fundus image sized 256 x 256. Fundus image is divided into two labels, class one and class two. Since hard exudates have been used to grade the risk of macular edema, data is labeled based on the size of apparent hard exudates. Data is labeled as class one, if the size of hard exudates is big enough to be seen and labeled as class two, if the size of hard exudates is small or hard to be
seen.
Preprocessing
Image preprocessing was used to remove part of image that was not used in classification phase, focused on exudates part. There are four steps in preprocessing phase. Those are closing grayscale, invert, and thresholding.
Closing [3,10] was used to fill contour of exudates in fundus image. Exudates in fundus im-age were composed by bright lesion which have variety of size. For big or medium size lesion, the gap or interspace between spot of lesion are small and often have no space at all. But for small size of lesion that consisted of tiny spots of lesion, the distance between spot is bigger, tend to spread and not just assembled in one area. The holes cre-ated between spots of lesion can make exudates becomes too small to be recognized. Thus, it nee-ded to be smoothed. By using closing, holes bet-ween adjacent spot of lesion could be filled and make contour of exudates became more apparent.
Closing itself consisted of process of dilation followed by erosion. The closing of set A as ima-ge input by structuring element B, denoted𝐴𝐴 • 𝐵𝐵 defined as the following equation(1).
𝑨𝑨 ∙ 𝑩𝑩= (𝑨𝑨 ⊕ 𝑩𝑩)⊝ 𝑩𝑩 (1)
After applying closing method, Green chan-nel grayscale was used because red chanchan-nel of the fundus image mostly on diabetic retinopathy was oversaturated, especially in the central region and the optic nerve. While blue channel could be low saturation in result (under saturated) and there is a lot of noise [1]. Therefore, green channel was us-ed for processing the image because this channel is the only channel that has right composition of saturation. Green channel is obtained by taking original green pixel Igreenchannel value from original RGB image.
In order to make the vessels brighter than the background, green channel of the image Igreenchannel was inverted (see equation(2)) [11]. Pixel result of invert operation is obtained from maximum pixel
Imaximum(𝑖𝑖,𝑗𝑗) of Igreenchannel minus each of pixel
Igreenchannel(𝑖𝑖,𝑗𝑗).
𝑰𝑰𝒊𝒊𝒊𝒊𝒊𝒊𝒊𝒊𝒊𝒊𝒊𝒊𝒊𝒊𝒊𝒊(𝒊𝒊,𝒋𝒋) =𝑰𝑰𝒎𝒎𝒎𝒎𝒎𝒎𝒊𝒊𝒎𝒎𝒎𝒎𝒎𝒎(𝒊𝒊,𝒋𝒋)
− 𝑰𝑰𝒈𝒈𝒊𝒊𝒊𝒊𝒊𝒊𝒊𝒊𝒊𝒊𝒈𝒈𝒎𝒎𝒊𝒊𝒊𝒊𝒊𝒊𝒈𝒈(𝒊𝒊,𝒋𝒋) (2)
Thresholding [12] is the last step in prepro-cessing phase. This method changed the 𝐼𝐼𝑖𝑖𝑖𝑖𝑖𝑖𝑖𝑖𝑖𝑖𝑖𝑖𝑖𝑖𝑖𝑖 into a binary image 𝐼𝐼𝑖𝑖ℎ𝑖𝑖𝑖𝑖𝑟𝑟ℎ𝑜𝑜𝑜𝑜𝑖𝑖 to differentiate exu-date area and background of the image. Then the two levels were assigned to pixels that were be-low or above the specified threshold value T as defined in equation(3).
𝑰𝑰𝒊𝒊𝒈𝒈𝒊𝒊𝒊𝒊𝒕𝒕𝒈𝒈𝒕𝒕𝒈𝒈𝒊𝒊(𝒊𝒊,𝒋𝒋) =�𝟏𝟏𝟎𝟎𝒊𝒊𝒊𝒊𝒊𝒊𝒊𝒊𝑰𝑰𝑰𝑰𝒊𝒊𝒊𝒊𝒊𝒊𝒊𝒊𝒊𝒊𝒊𝒊𝒊𝒊𝒊𝒊(𝒊𝒊,𝒋𝒋) ≥ 𝑻𝑻 𝒊𝒊𝒊𝒊𝒊𝒊𝒊𝒊𝒊𝒊𝒊𝒊𝒊𝒊𝒊𝒊(𝒊𝒊,𝒋𝒋) <𝑻𝑻 (3) Using T=127 as value threshold. Rated T
held an important role in the flotation process. The quality of the binary image is highly depend-ent on the value of T used. Images that have been preprocessed are shown in Figure 3 as binary ima-ge.
Feature Extraction
Total of feature obtained from preprocessing was 65536 features consisting of pixel 0 and 1. The number of features was really large and could ma-ke computation became complex. In order to pre-vent the complexity, then feature extraction meth-od was used to get features containing exact char-acteristic of the image.
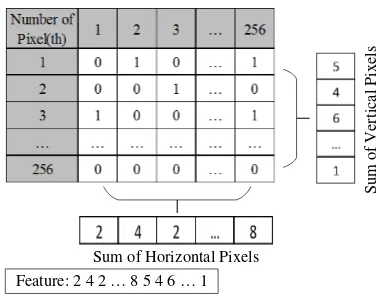
Integral projection [12] was used to extract the feature of fundus binary image by enumera-ting the feature from horizontal h(j) and feature from vertical h(i) using equation(4) and equation (5). After enumerating, feature was placed in one row as feature identity for each data. Ilustration of in-tegral projection is shown at Figure 4.
𝒈𝒈(𝒋𝒋) = � 𝑰𝑰𝒊𝒊𝒈𝒈𝒊𝒊𝒊𝒊𝒕𝒕𝒈𝒈𝒕𝒕𝒈𝒈𝒊𝒊(𝒊𝒊,𝒋𝒋)
𝑵𝑵𝒊𝒊𝒕𝒕𝒓𝒓
𝒊𝒊=𝟏𝟏 (4)
𝒈𝒈(𝒊𝒊) = �𝑵𝑵𝒊𝒊𝒕𝒕𝒈𝒈𝒎𝒎𝒎𝒎𝒊𝒊𝒊𝒊𝑰𝑰𝒊𝒊𝒈𝒈𝒊𝒊𝒊𝒊𝒕𝒕𝒈𝒈𝒕𝒕𝒈𝒈𝒊𝒊(𝒊𝒊,𝒋𝒋)
𝒊𝒊=𝟏𝟏 (5)
Learning Phase
Learning phase is used to adjust weights and bias-es of data based on characteristic of feature in ea-ch class. There are two processes in learning pha-se. First, finding input weight by SOM and then the result from SOM is used in GLVQ as input weight that would be learned with training data.
Self-Organizing Maps
Self-Organizing Maps is a clustering and data sualization technique based on neural network vi-ewpoint [13]. Input dataset in this phase used fea-ture from feafea-ture extraction result (integral projec-tion). Self-Organizing Maps obtain the optimal weight based on input dataset and random weight input. The distance between each input data in da-taset and random weight is computed to find out the minimal distance value. Resultant data that has minimal value would be updated.
In SOM Algorithm [14], firstly define initial weight (wij) randomly from each class, learning parameter such as learning rate (𝛼𝛼) and maximum epoch. For each data (xi) compute distance of neu-ron j (𝐷𝐷𝑗𝑗) using equation(6).
𝑫𝑫𝒋𝒋=� (𝑾𝑾𝒊𝒊𝒋𝒋− 𝑿𝑿𝒊𝒊)𝟐𝟐
𝒊𝒊=𝟏𝟏 (6)
xi is input and wij is weight consisting of feature image from integral projection operation, with i = 1,….,N where N is dimension of data. The next step is finding index of neuron distance (𝐷𝐷𝑗𝑗) whi-ch have minimum value. 𝐷𝐷𝑗𝑗 with minimum value then will updated using equation(7).
𝒓𝒓𝒊𝒊𝒋𝒋(𝒊𝒊𝒊𝒊𝒓𝒓) =𝒓𝒓𝒊𝒊𝒋𝒋(𝒕𝒕𝒈𝒈𝒊𝒊) +𝜶𝜶(𝒎𝒎𝒊𝒊− 𝒓𝒓𝒊𝒊𝒋𝒋(𝒕𝒕𝒈𝒈𝒊𝒊)) (7)
with𝑤𝑤𝑖𝑖𝑗𝑗(𝑛𝑛𝑛𝑛𝑤𝑤) is new weight and 𝑤𝑤𝑖𝑖𝑗𝑗(𝑜𝑜𝑜𝑜𝑜𝑜) is previous weight that yet been updated. The next
Figure 3. Threshold image (a) Class 1 and (b) Class 2
Sum of Horizontal Pixels
S
um
of V
e
rt
ic
a
l P
ixe
ls
Feature: 2 4 2 … 8 5 4 6 … 1
step is updating learning rate value 𝛼𝛼. As long as the maximum number of iterations has not been reached, previous step from computing distance (𝐷𝐷𝑗𝑗) until updating learning rate value 𝛼𝛼 will be done continuously.
Generalized Learning Vector Quantization
Input dataset in this phase also used feature from feature extraction result (integral projection) with the weight 𝑤𝑤𝑖𝑖𝑗𝑗(𝑛𝑛𝑛𝑛𝑤𝑤) was taken from SOM wei-ght calculation. In GLVQ, reference vectors were updated based on steepest descent method in order to minimize the cost function. The cost function was determined so that the obtained learning rule could satisfy the convergence function [5].
In GLVQ we define initial weight (𝑤𝑤𝑖𝑖𝑗𝑗(𝑛𝑛𝑛𝑛𝑤𝑤)
is optimal weight in SOM), learning parameter su-ch as learning rate 𝛼𝛼, maximum epoch, ratio slo-pe, and minimum learning rate. GLVQ compute two distances between input and weight. For input is equal to target class, compute the distance 𝑜𝑜𝑗𝑗 as in equation(8).
𝒊𝒊𝒋𝒋=�� (𝒎𝒎𝒊𝒊− 𝒓𝒓𝒊𝒊𝒋𝒋)𝟐𝟐 𝑵𝑵
𝒊𝒊=𝟏𝟏
(8)
Moreover, distance between input and other weight that is not its target 𝑜𝑜𝑘𝑘class, can be com-puted using equation(9)
𝒊𝒊𝒌𝒌=�� (𝒎𝒎𝒊𝒊− 𝒓𝒓𝒊𝒊𝒌𝒌)𝟐𝟐 𝑵𝑵
𝒊𝒊=𝟏𝟏
(9)
From dj and dk which is the distance of x fr-om w1(the correct weight of input)andw2(the ot-her weight) respectively, the relative distance dif-ferent, 𝜇𝜇𝑥𝑥 is computed, defined as the following equation(10).
𝝁𝝁𝒎𝒎=𝒊𝒊𝒊𝒊𝒋𝒋− 𝒊𝒊𝒌𝒌
𝒋𝒋+𝒊𝒊𝒌𝒌 (10)
Updating weight are processed as long as epoch has not reached the maximum epoch yet. The weight that been updated is not only input’s weight but also both of weight. The weights are updated using equation(11) and equation(12).
𝒓𝒓𝟏𝟏(𝒊𝒊𝒊𝒊𝒓𝒓) =𝒓𝒓𝟏𝟏+𝜶𝜶𝒊𝒊𝒊𝒊𝒊𝒊𝒎𝒎𝒊𝒊 𝒊𝒊𝒋𝒋
𝒋𝒋+𝒊𝒊𝒌𝒌 (11)
𝒓𝒓𝟐𝟐(𝒊𝒊𝒊𝒊𝒓𝒓) =𝒓𝒓𝟐𝟐+𝜶𝜶𝒊𝒊𝒎𝒎𝒊𝒊𝒊𝒊𝒊𝒊 𝒊𝒊𝒋𝒋
𝒋𝒋+𝒊𝒊𝒌𝒌 (12) 𝑖𝑖𝑑𝑑
𝑖𝑖𝑑𝑑 is a kind of gain factor for updating and its value depends on x. Learning rate value 𝛼𝛼 is up-dated and all of step above are repeated until rea-ch maximum eporea-ch and minimum learning rate.
Classification
Fundus image were classified using distance cal-culation 𝑜𝑜 based on data testing feature x and opti-mal weight feature 𝑤𝑤𝑖𝑖𝑗𝑗 from GLVQ result. Distan-ce calculation is often used to determine similarity degree or dissimilarity degree of two vectors. Si-milarity level is a score and used to determine whether two vectors were similar or not [9].
The core of GLVQ neural network is calcu-lating Euclidean distance. Distance between each input vectors and competitive layer neural nodes could be calculated, and the output node which was minimum distance designated as a winning node. Euclidean distance 𝑜𝑜 calculated the differ-rences between two as the following equation(13).
𝒊𝒊=�� (𝒎𝒎𝒌𝒌− 𝒓𝒓(𝒊𝒊𝒊𝒊𝒓𝒓))𝟐𝟐
𝒊𝒊
𝒌𝒌=𝟏𝟏 (13)
with 𝑥𝑥𝑘𝑘 is testing input and 𝑤𝑤(𝑛𝑛𝑛𝑛𝑤𝑤) is weight op-timal from GLVQ training process.
3. Results and Analysis
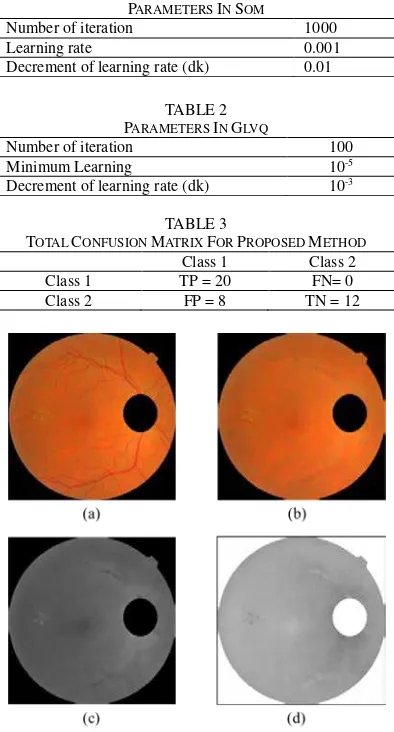
Fundus image does not only contain bright focus in exudate area, but also optic disc. Optic disc ar-ea must be cropped before preprocessing because it has almost same intensity values as exudate of diabetic. If the area is not cut, it will affect the ex-traction of the image and characteristics of each grade. Cropping optic disc area used ImageJ app-lication 1.47 version. Figure 5 and Figure 6 show preprocessing result from optic disc cropping until inversion.
The detailed evaluation of proposed system was performed using different statistical evaluate-on parameters such as sensitivity (sen), specifi-city (spec), and accuracy (acc) to form k-fold. Th-ose statistical evaluations can be computed using equation(14), equation(15), equation(16) respecti-vely.
𝑺𝑺𝒊𝒊𝒊𝒊𝒕𝒕𝒊𝒊𝒊𝒊𝒊𝒊𝒊𝒊𝒊𝒊𝒊𝒊𝑺𝑺(%) = 𝑻𝑻𝑻𝑻
𝑻𝑻𝑻𝑻+𝑭𝑭𝑵𝑵 (14)
𝑺𝑺𝑺𝑺𝒊𝒊𝒊𝒊𝒊𝒊𝒊𝒊𝒊𝒊𝒊𝒊𝒊𝒊𝒊𝒊𝑺𝑺(%) = 𝑻𝑻𝑵𝑵
𝑭𝑭𝑻𝑻+𝑻𝑻𝑵𝑵 (15)
𝑨𝑨𝒊𝒊𝒊𝒊𝒎𝒎𝒊𝒊𝒎𝒎𝒊𝒊𝑺𝑺(%) = 𝑻𝑻𝑻𝑻+𝑻𝑻𝑵𝑵
𝑻𝑻𝑻𝑻+𝑭𝑭𝑻𝑻+𝑭𝑭𝑵𝑵+𝑻𝑻𝑵𝑵 (16)
TP is amount data testing from class 1 and classified correctly as grade 1, FN is amount data
testing from class 1 and incorrectly classified as grade 2. TN represent amount of data testing from class 2 classified incorrectly as grade 1 and FP is amount data from class 2 and correctly classified as grade 2. The total confusion matrix for propo-sed method is shown in Table 3.
For training and testing requirement, data was split into 10 folds. In every 10-fold cross vali-dation, data was divided into 16 training data and 4 testing data where each class had 8 data as train-ing data and 2 data as testtrain-ing data respectively. All the result gained from 10-fold cross validation were summed to obtain confusion matrix
.
This experiment also compared proposed method with another classification method, LVQ, to observe which method would had better result to classify fundus image in ME classification. The result can be seen in Table 4 and Figure 7. Data-base used in this experiment, Messidor was also used in other experiments for grading Macular Edema. Table 5 shows result of other experiments. Figure 5. Preprocessing sample class 1 result (a) Opticdisc
Cropped, (b) Closing, (c) Green channel, (d) Invert
Figure 6. Preprocessing sample class 2 result (a) Optic disc Cropped, (b) Closing, (c) Green channel, (d) Invert TABLE 1
PARAMETERS IN SOM
Number of iteration 1000
Learning rate 0.001
Decrement of learning rate (dk) 0.01
TABLE 2 PARAMETERS IN GLVQ
Number of iteration 100
Minimum Learning 10-5
Decrement of learning rate (dk) 10-3
TABLE 3
TOTAL CONFUSION MATRIX FOR PROPOSED METHOD
Class 1 Class 2
Class 1 TP = 20 FN= 0
Class 2 FP = 8 TN = 12
TABLE 4
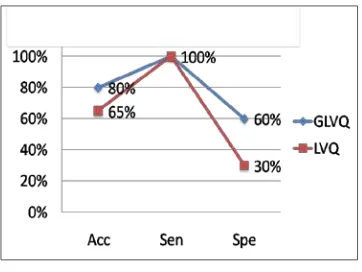
COMPARISON OF CLASSIFICATION RESULT USING GLVQ
AND LVQ
GLVQ LVQ
Accuracy (%) 80 65
Sensitivity(%) 100 100
Specificity(%) 60 30
TABLE 5
COMPARISON OF OUR PROPOSED METHOD WITH
EXISTING TECHNIQUES FOR GRADING OF ME
There are two main stages in this experiment that focused in training process. SOM and GLVQ combined to train the data.
Training Using SOM
SOM (Self-organizing Map) as training process used feature data which was the sum of 512 fea-tures of each images from integral projection ex-traction to handle some of data which contained feature value 0. These feature values 0 will give bad influence in searching of ideal weights. In this process, some data were found having cluster wh-ich was not belong to its actual cluster.
Noted that from 20 data in class 1, 19 data were clustered correctly as grade 1 while 1 were clustered wrongly as grade 2. In class 2, from 20 of its data, 12 data were clustered correctly as gra-de 2 and the remaining 8 were clustered wrongly as grade 1. The reason of this incorrectly clustered data was because of similar feature of some data to class 1 so that some data were more inclined to class 1 than class 2.
Training Using GLVQ
In this experiment, total accuracy using proposed method is 80%. The sensitivity or accuracy of cla-ss 1 attained 100% where the specificity or accu-racy of class 2 is 60%. The reason of specificity from this proposed method only reached 60% was because some data labeled as grade 2 from the expert did not indicate enough exudate to be la-beled as grade 2, so instead of lala-beled as grade 2, those data were inclined and labeled as grade 1.
K-fold cross validation method was used in this experiment because amount of data in this ex-periment were not sufficient. Data retrieved from Messidor database actually has 1200 fundus ima-ge which 135 of them can used for ME classifi-cation. But only 40 of them were used as the rest of them have highly different quality as the result of bad acquisition like less exposure. Because of
that, the resultant of preprocessing were not opti-mal and could not be used in this experiment.
This experiment also compared proposed method and other classification method like LVQ. From accuracy of the resultant in Figure 7, it can be seen that GLVQ has better accuracy which is 80% than LVQ which is only 65%. This indicates that GLVQ as the classifier is better used in this case, because in GLVQ weight updating process does not only use class from data which was cla-ssified. Instead of that, GLVQ also used weight fr-om data which is close frfr-om correct class. In this case, 2 weights was used in learning process, so that its classification has better result.
Table 5 show performance of Messidor data-base used in various techniques for grading Ma-cular Edema. Our proposed method has best result in sensitivity with 100% but doesn’t have a better performance in specificity and accuracy than oth-er methods. But this can’t be compared directly to judge one classification method is better than oth-ers because all of those experiments have different method in preprocessing and feature extraction.
4. Conclusion
Diabetic macular edema is an advanced level of retinal abnormalities, which may be present in di-abetes sufferers. This may cause total blindness if not detected and treated in right time. In this pa-per, we proposed a two-stage classification system consisted of SOM and GLVQ for diabetic macular edema diagnosis of fundus images. First stage, data that have been preprocessed is trained using SOM to gain ideal weight then used it to initialize weight in the next stage. GLVQ used in the next stage to train and classify fundus image either it’s categorized as grade 1 or grade 2. The experi-mental result shows that proposed method have accuracy of 80% with sensitivity and specificity of 100% and 60% respectively. It proved that our proposed method is better than using LVQ which only have accuracy of 65%, sensitivity of 100% and specificity of 30%.
Future work can be done by adding another feature like distance of exudates from fovea in or-der to see the effectiveness of this method. Using another training method which is developed from GLVQ such as GRLVQ can be considered to be applied in future research.
References
ng Publicly Available Datasets”, Medical Image Analysis. pp. 216– 226, 2012
[2] Kohner, E. M., Aldington, S. J., Stratton, I. M., Manley, S. E., Holman, R. R., Matthews, D. R., & Turner, R. C, “United Kingdom Prospective Diabetes Study, 30: Diabetic Re-tinopathy at Diagnosis of Non–Insulin-Depe-ndent Diabetes Mellitus and Associated Risk Factors”, in Archives of Ophthalmology, 116
(3), 297-303, 1998
[3] Akram, M. Usman., Anam Tariq, Shoab A. Khan, & M. Younus Javed, “Automated De-tection of Exudates and Macula for Grading of Diabetic Macular Edema”. Computer Me-thods and Program in Biomedicine. pp 141– 152, 2014
[4] Aftab, U., & Akram, M. U., “Automated ide-ntification of exudates for detection of ma-cular edema”, In Biomedical Engineering Conference (CIBEC), 2012 Cairo Interna-tional, pp. 27-30, 2012
[5] Sato, A., & Yamada, K, “Generalized Learn-ing Vector Quantization”, Advances in neu-ral information processing systems, pp. 423-429, 1996
[6] Morishita, Yusuke and Imaoka, Hitoshi, “Facial Feature Detection using Generalized LVQ and Facial Shape Model”. MVA2011 IAPR Conference on Machine Vision Appli-cations, pp. 410-413, 2011
[7] Matsuda, N., Laaksonen, J., Tajima, F., & Sato, H. “Classification of Fundus Images for Diagnosing Glaucoma by Self-Organi-zing Map and Learning Vector Quantiza-tion” inAdvances in Neuro-Information Pro-cessing, pp. 703-710, 2009
[8] Germen, E., Başaran, M., & Fidan, M. “Sound Based Induction Motor Fault Diagnosis Usi-ng Kohonen Self-OrganiziUsi-ng Map”.
Mecha-nical Systems and Signal Processing, Vol 46 pp.45–58, 2014
[9] Messidor Database available http://www.ad cis.net/en/Download-Third-Party/Messidor. html
[10] Gonzalez & Woods, Digital Image Proces-sing, 2nd Edition, Prentice Hall, New Jersey, pp. 554-555, 2002
[11] Soares, J. V., Leandro, J. J., Cesar, R. M., Je-linek, H. F., & Cree, M. J. “Retinal vessel segmentation using the 2-D Gabor wavelet and supervised classification” in Medical Im-aging, IEEE Transactions on, 25(9), pp. 1214-1222, 2006
[12] Prasetyo, Eko, Pengolahan Citra Digital dan Aplikasinya Menggunakan Matlab, Penerbit Andi, Yogyakarta, pp. 221-222. 2011 [13] Tan, Pang-Ning, Michael Steinbach, &
Vi-pin Kumar, Introduction Data Mining, Pear-son Education Inc, Boston, pp 594-597, 2006 [14] Prasetyo, Eko, Data Mining Konsep dan
Ap-likasinya Menggunakan Matlab, Penerbit
Andi, Yogyakarta, pp. 276-277. 2012 [15] S.T.Lim, W.M.D.W. Zaki, A. Hussain, S.L.
Lim, S. Kusalavan, “Automatic Classifica-tion of Diabetic Macular Edema Indigital Fundus Images”, In 2011 IEEE Colloquium on Humanities, Science and Engineering (CHUSER), pp. 265–269, 2011.
[16] K.S. Deepak, J. Sivaswamy, “Automatic As-sessment Ofmacular Edema from Color Re-tinal Images”, inIEEE Transactionson Me-dical Imaging 31 (3), pp. 766–776, 2012 [17] Aquino, A., Gegundez, M. E., & Marin, D.