P-ISSN.2503-0817, E-ISSN.2503-0825
CrossMark
Abstract
Objective:Color matching technique is one of the requirement in clinical dentistry. Using dental shade selection can help the dentist to determine the suitable color for the patients during fabrication of prosthesis. However the lack of dentists’ knowledge in color science due to many kinds of shade guide becomes a problem in the field of dentistry. So color matching technique by using digital images are feasible solution when suitable color features have been properly manipulated.
Material and Methods:Separating the color features of digital images into RGB and HSV feature spaces are the first step of this
system. Due to many features in this step, it requires some classifier algorithm according to the shade type of teeth. In this paper, we proposed color teeth classification for dental shade selection using DT, NN and K-nearest neighbors algorithm based on color histogram feature spaces.
Results: The result showed that on using the KNN algorithm it achieved 96.67% in learning process and 90% in testing process which had error level (0.183).
Conclusion:It proves that our proposed system have high similarity in color matching according to the learning and testing process.
Keywords:Color matching, Dental shade selection, Decision tree, Neural network and K-nearest neighbors
Cite this Article:Justiawan, Sigit R, Arief Z, Wahjuningrum DA. 2017. Performance analysis of color matching technique for teeth classification based on color histogram. Journal of Dentomaxillofacial Science 2(2): 95-99. DOI:10.15562/jdmfs.v2i2.525
Performance analysis of color matching technique
for teeth classification based on color histogram
Justiawan,1Riyanto Sigit,2Zainal Arief,2Dian A. Wahjuningrum3
Intro
d
uction
The dental shade selection has always been a problem for dentists who typically select suitable shade tabs from a shade guide by using manual visual selection.1,2 Successful shade matching of
a prosthesis is an essential aspect and a require-ment of restorative and esthetic dentistry.3 The
understanding of color shade guide is important for accurate shade matching. However the lack of dentist’ knowledge in color science due to many kinds of shade guide have become a new problem in the field of dentistry. Color matching technique by using digital images are feasible solution when suitable color features have been properly identified based on type of patient’s teeth color images.
Identifying the images according to their content is known by classification technique or method. Classification methods can be applied to the image processing application which can be described appropriately.4One of the image
process-ing application is the color matchprocess-ing system in clinical dentistry that requires high accuracy level. The accuracy level in matching shades by visual selection is only slightly better with about 48%.5
A color description should described in detail the color distribution of tooth surface. The central area of tooth are chosen for matching color on natural teeth, which will be used as an effective source for shade comparison.
Basically the teeth is white in color with different value. A color can be produced by a combination of its basic elements which is called “color space parameter”. Each color has at least three basic elements as RGB, CMY, HSV, CIE XYZ, Lab, LUV and YcrCb.6 However the color space properties
of teeth are nonuniform and involves a complex layering of tooth structure,3,4and it requires adding
technique for determining specific feature of each tooth. An analytical technique using color histogram can be applied for determining the These fixed list of color ranges is suitable for color matching system which can be influenced by many factors, such as lighting environment, other properties in patient (clothes, skin and lips color) and etc.
According to the many features from color analysis result, it requires additional algorithm to classify the features based on shade guide. In this paper we proposed a color matching technique for teeth classification using DT, NN and KNN algorithms. There were 16 types of dental color images which had been matched earlier with dental 1Department of Electrical
shade guide and Indonesians’ teeth condition from Dental Hospital, Airlangga University, Surabaya, Indonesia. Teeth images were taken by using digital camera with 288 LUX lighting condition. From RGB and HSV color spaces, the color feature using color histogram could be obtained. After determining the color features from the teeth, we measured the similarity level between color image database from dental image shade guide and input image from patient using direct euclidean distance.
All output from similarity check will be classified based on teeth type using classification algorithm. This system analyzed the accuracy of performance based on the kind of color space, kind of algorithm, and the number of bins which was related to the color histogram.
Material an
d
Metho
d
s
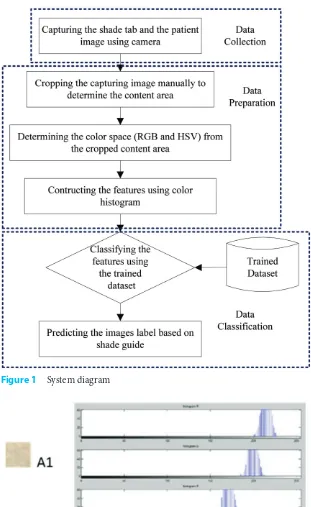
The camera on a smartphone iPad mini 2 with 5 mega pixels from apple, and an USA brand was used for capturing the image with 288 lux lighting. The distance between the camera and the object was at a range of 0.2–0.3 meter. The system flow diagram, as depicted in figure 1, comprised four major parts: image collection involved cropping of images content, feature determination such as RGB and HSV, feature vectors construction using color histogram, and classification using DT, NN and KNN as the last step which were trained and tested for the feature vectors.
Image collection
There were two kinds of images which were to be captured using iPad mini 2 camera at the dental clinic. They were shade guide images as the database of this system and tooth of each patient as input images from the clinic. We had collaborate with Dental Hospital Universitas Airlangga, Surabaya, Indonesia for obtaining the data. According to the patients’ tooth images, there were 16 types of teeth that were matching with the shade guide database, which will be processed to the next step of this system. Each image must be cropped to obtain the content of the color area with 40x40 pixel size. It was divided into three parts in horizontal and vertical direction. The middle part of its intersection was used to determine the color space, as depicted in figure 2.
Data Preparation
We determined the color distribution by observing sample areas. Subsequently, there were two kinds of color space models used in this system. They are RGB and HSV color space models. The RGB color model has three basic primary colors: red, green, and blue. Combination from these three basic color can be used to produce all other colors. The HSV color model is represented as a cone: for a given point h and sv are the angular and radial coordinates of the point on a disk with the coordinate range at 0–1.7
After determining each part of RGB and HSV color model, we could construct the color features using color histogram. The color histogram is defined as a distribution of colors in an images, which counts the number of pixels from each color
Figure 1 System diagram
spaces. The high distribution level shows that the value of pixels have larger intensity data. The color histogram value can be calculated using the follow-ing equation.8
hi =ni A
Where ni is the pixel’s number from the intensity of images. The normally histogram is at a range of 0–1. The intensity of images can be derived from mining the distribution of color intensity.
In this system, we require 8 bins and 16 bins for presenting RGB and HSV color models using color histogram. Bins (n) are the feature parameter of color histogram which shows the number of pixels of each image. From the shade guide of images the images of the patient can be calculated from the similarity value using euclidean distance:9
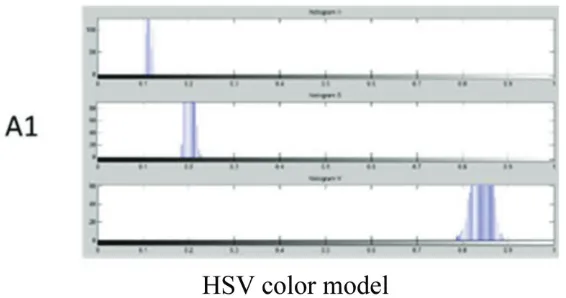
S hi k hi k histogram level of patient images (hi = 2). The illus-tration of color histogram graph from RGB and HSV color model for A1 teeth type is illustrated in figure 3.
The result shows that each type of color space model has different pattern in color histogram for A1 teeth type. The result of this section was color histogram pattern of 16 teeth type for HSV and
There were 320 features data that was classified in this section. About 240 features data were used for the learning process and 80 features data were used for the testing process.
A decision tree is a flowchart structure that resembles a tree, where each internal node denotes a test on an attribute, each branch represents the results of the test and the leaf node represents a class or class distribution. The chronology of the decision tree from the root node to the leaf node holds the prediction. A C45 algorithm that could handle numeric data was used to gain ratio calcu-lation. It also required information value in bits unit from the object using entropy concept. The entropy (S) was the number of bit unit which had been predicted for extracting the class (+ or -) from several random data at the sample S. The value of entropy could be used for measuring the inauthen-ticity of S. The equation of entropy calculation at the S sample was derived as:10
D The calculation of gain was derived as:10
Gain S A Entropy S si number of partisis of A attribute. |Si| is the number of sample from pertisi-i and |S| is the sample of S.
The second classification algorithm of this system is the NN, the adaptive system that could modify its structure based on external and internal information of its network. The NN could be used for modeling the complex relation among input and output system for finding the data pattern. The neuron is the basis of learning process from NN. It has interconnected basic processing system called neuron. The network is learned using weight modi-fication that has relation between neuron during the training process.11
The last algorithm is KNN which is included at the instance-based learning group.12The KNN
algo-rithm was utilized for finding the group of k object in data training, which is the nearest data to the new data or testing data. There are many method for measuring the distance among the testing data as the new data and the training data as the old data. One of them is by using euclidean distance:10
distance= (a1−b1) +(a −b) + +(an−bn) two records. When the attribute values of two records are compared, and if the value is 0 its means the data is almost same or same. While the value is 1, it means the data is not same. The similarity value of attribute can be calculated using the following equation:10
All classification of algorithm of this system was applied to the rapidminer simulator based on the feature from color analysis, which have been calcu-lated before using matlab. The performance system was automatically shown from the output of rapid-miner simulator.
Results
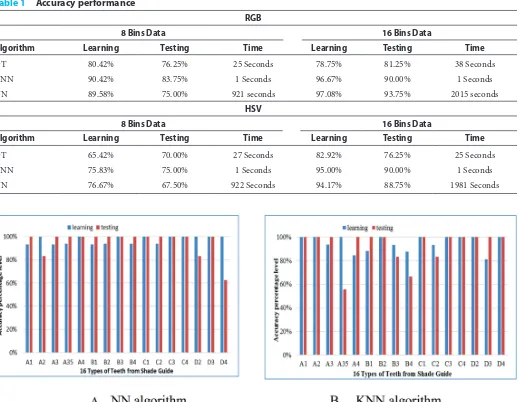
There are two kinds of parameter performance result of this system. They are accuracy level perfor-mance and computation time. The perforperfor-mance result was compared based on kinds of color model system, kinds of classification algorithm, and the number of bins from color histogram. The accuracy level performance was shown using percentage level which are listed in table 1 that involved computa-tion time performance. According to the accuracy level result, the RGB color model achieved better performance than HSV color model. It was proved
from the successful classification result, which was illustrated in figure 4 using bar chart. The successful classification results showed the number of teeth types that had achieved 100% accuracy level in learning and testing process.
Discussion
In this section, we describe performance analysis of this system based on accuracy percentage from learning and testing process of each algorithm. The kind of color models also influence the performance result. Increasing the bins value from color histogram calculation will be analyzed in this section.
According to the data preparation phase, there were 320 total data which were classified using DT, KNN, and NN for every color model. The number of bins from color histogram’s calculation influenced the accuracy level of performance. There were two bins number applied to this system,
Table 1 Accuracy performance
RGB
8 Bins Data 16 Bins Data
Algorithm Learning Testing Time Learning Testing Time
DT 80.42% 76.25% 25 Seconds 78.75% 81.25% 38 Seconds
KNN 90.42% 83.75% 1 Seconds 96.67% 90.00% 1 Seconds
NN 89.58% 75.00% 921 seconds 97.08% 93.75% 2015 seconds
HSV
8 Bins Data 16 Bins Data
Algorithm Learning Testing Time Learning Testing Time
DT 65.42% 70.00% 27 Seconds 82.92% 76.25% 25 Seconds
KNN 75.83% 75.00% 1 Seconds 95.00% 90.00% 1 Seconds
NN 76.67% 67.50% 922 Seconds 94.17% 88.75% 1981 Seconds
are 8 bins data and 16 bins data. The accuracy level performance was influenced by these 8 bins and 16 bins.
The percentage of learning accuracy from RGB color model was shown using KNN model achieved the best performance at 90.42 % for learning process and 83.75% for testing process. While with the HSV color model, the best accuracy level was shown using NN algorithm which is 76.67% for learning process and 67.5%. According to the kind of color model, the RGB had better performance than using HSV color model which was proved from RGB accuracy level was higher than 80% for learning process and higher than 75% for testing process. It was because the RGB color model had high stability in constant light condition (288 lux). When the number of bins from color histogram was increased, the accuracy of performance level would also be increased. It is proved from the simulation result data using 16 bin. Using RGB color model the accuracy level was larger than 96%, which was achieved by using NN algorithm at 97.08% for learning process. In testing process the accuracy level of performance was also increased up to 93.75%. On comparing the kind of color models, using the RGB color still had better performance thanHSV color model in this system.
Using RGB color model had better perfor-mance, which was proved from the accuracy level of performance in determining each type of teeth as depicted. Comparing the successful number of types of teeth classification with RGB color model, using KNN algorithm can be successfully classified as 8 number types of teeth which have 100% in learning and testing process. While using NN algo-rithm is only classified as 6 number types of teeth.
The accuracy level of performance will influence the computation time, which is caused by the kind of algorithm used for calculation. In RGB color models, the NN achieves best performance for accuracy level. However, the NN takes long compu-tation time up to 2015 seconds. This condition is not suitable when this system is applied to the real hardware. The suitable algorithm is using KNN having smallest computation time of only 1 second. The advantage of KNN algorithm is still stable when the number of bins are increased, the computation time is still 1 second.
Conclusion
In this paper we proposed the color matching tech-nique for teeth classification using color histogram.
The compatible algorithm and color model can influence the performance analysis of this system. The best performance of color matching technique at the stable lighting condition at 288 lux is achieved by using 16 bins RGB color with KNN algorithm. Our proposed system showed that it can increase the accuracy level up to 2 times better than using manual shade selection.
Conflict of Interest
The authors report no conflict of interest
References
shade system. J Prosthet Dent 2014;111: 247–253. 3. Gokce HS, Piskin B, Ceyhan D, et al. Shade matchingperformance of normal and color vision-deficient dental professional with standard daylight and tungsten illumi-nants. J Prosthet Dent 2010;103: 139–147.
4. Riri HA, Elmoutaouakkil, Beni-Hssane A, et al. Classification and recognition of dental images using a decisional tree. 13th International Conference on Computer Graphics Imaging and Visualization (CGIV). Beni Mellal 2016. p. 390–393. custom dental porcelain shade system for computer color matching. J Dent 2013;41: e3–e10.
8. Pandey KK, Mishra N, Sharma HK. Enhanced of color matching algorithm for image retrieval. IJCSI 2011;8: 529–532.
9. Li W, Wang W, Liu M. New color cluster algorithm for image retrieval. Third International Symposium on Intelligent Information Technology Application 2009: 561–564.
10. Aprilla D, Baskoro DA, Ambarwati L, et al. Belajar data mining dengan rapidminer. Jakarta: Gramedia Pustaka Utama; 2013.
11. Veeraprasit S, Phimoltares S. Neural network-based teeth recognition using singular value decomposition and color histogram. In 2nd ed. International Conference of Information Engineering and Computer Science 2010: 1–4.
12. Liu J, Zhao N, He R. Study of color matching system for porcelain teeth. In IEEE International Conference of Medical Imaging Physics and Engineering2013: 310–314.