Selection and Recommendation Scholarships Using
AHP-SVM-TOPSIS
M. Gilvy Langgawan Putra1, Whenty Ariyanti 2, Imam Cholissodin3 1,2,3Faculty of Computer Science, University of Brawijaya, Indonesia 1[email protected], 2[email protected], 3[email protected]
Received 21 February 2016; received in revised form 18 March 2016; accepted 25 March 2016
Abstract. Gerakan Nasional Orang Tua Asuh Scholarship offers a number of scholarship packages. As there are a number of applicants, a system for selection and recommendation is required. we used 3 methods to solve the problem, the methods are AHP for feature selection, SVM for classification from 3 classes to 2 classes, and then TOPSIS give a rank recommendation who is entitled to receive a scholarship from 2 classes. In testing threshold for AHP method the best accuracy 0.01, AHP selected 33 from 50 subcriteria. SVM has highest accuracy in this research is 89.94% with Sequential Training parameter are λ =0.5, constant of γ =0.01 , ε = 0.0001, and C = 1.
Keywords: Selection, Recommendation, Scholarships, AHP-SVM-TOPSIS
1 Introduction
Education is a basic requirement for all Indonesian citizens. Educational benefits for the people of Indonesia vary from careers, In paragraph 4 of the 1945 constitution of the Republic of Indonesia which reads “In order to form a government of Indonesia that protects the entire nation of Indonesia and the entire homeland of Indonesia and to promote the general welfare, national life..”. Based on those values Gerakan Nasional Orang Tua Asuh (GNOTA), an independent, transparent, non-profit social organization was founded on May 29, 1996 [1]. Since its creation GNOTA has provided 2.3 million scholarship packages. Due to a high amount of participants, many experienced problems during the selection process and in giving eligible recipients recommendations. A system is needed to assist the process of classification and recommendation.
based on AHP found that the AHP weight for each class can reduce accuracy if the weight of each document term is insufficient [4]. A research on a Qualitative Recruitment System using SVM and MCDM Approach, found that MCDM using TOPSIS, has difficulties in the disposition of employees and needed SVM for (kelebihan SVM) [5]. To help in the selection process and the recommendation of scholarship grantees GNOTA needs a system that can speed up the computation of classifying results in deciding the scholarship grantees of GNOTA Kediri. This paper will analyze the method of AHP-SVM-TOPSIS, in which AHP will select the sub-criteria needed to speed up the process of computation with a threshold parameter, SVM will select 3 classes from very sufficient, sufficient, insufficient. After using SVM, TOPSIS will recommend two classes from very sufficient and sufficient categories.
2 Analytical Hierarchy Process (AHP)
AHP is a system analysis approach introduced first by researches from the U.S, T. L. Saaty, in 1970 [3]. AHP takes into account every weight for each criteria, or subscriteria. Originally developed to solve problems in complex institutions that do not possess the structure to do so. As AHP makes a hierarchical thinking process it is better for analyses that combine quantitative and qualitative aspects [6][7].
2.1 Step by Step of AHP
The basic process of the AHP calculation is as follows:
Create A Hierarchical Structure Model
After studying the analysis of the cases discussed, the most important stage of building a hierarchical structure of the AHP is divided into several levels such as that of a modeling tree. The level of modeling ranges from high, medium, to low. The level of some top level is an achievement of the target to be achieved in decision-making, the middle level is the measure if the target is reached or not, and the bottom level is the level of the index assessment.
Create A Judgment Matrix Group
The hierarchy of the previous modeling\ the upper level and lower level, on the basis of the modeling assessment, needs to be made on each of the relatives important of the various kind of factors, which are useful to measure the scale of assessment to be made of a matrix M.
M = m21
mn1
m22
mn2
m2n
mnn
... ... ... ... ...
Calculate the Weight Vector
In calculating the weight vector by using judgment matrix group, judgment matrix is group M = [mij]nxn , and if mik = mij, mjk for ∀i, j, k = 1, 2,...,n, that is to say, M as
consistency matrix, element consistency from matrix M can be assumed mij = wi / wj,
general judgment of the matrix M does not always give good results, while to overcome these problems there are methods of looking for value weighting vector that can be followed Eq. (1).
wi =
n
j a ij
1
i = 1,2,3,...,n (1)
And the weight for vector can be followed Eq. (2).
wi =
n
k n
j akj
n
j aij
1 1
1
(2)
3 Support Vector Machine (SVM)
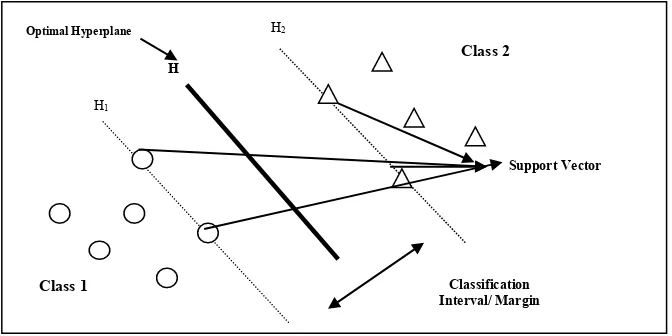
SVM is a set of machine learning methods in theory statistics from C.Cortez and V.Vapnik in 1995. A SVM technique performed with analysis based on mathematical calculation to determine the best hyperplane [8],[9]. Fig.1. shows how SVM works to find the best hyperplane.
Fig. 1. Concept of Support Vector Machine
H1
H2
H
Class 1
Class 2
Classification Interval/ Margin
Support Vector
3.1 Linear CLassification
Explicit data mapping to learn linear classification directly in new space [9]. Linear Support Vector Machine that uses SVM method is divided into two types consisting of Separable and not Separable data10][11].
We first consider the case when data is linearly separable. The classification problem can be formulated as one offending a hyperplane f (w,b) = xi.w+b. For example,
separate the positive and negative:
xi . w + b ≥ 1 for yi = 1, (3)
xi . w + b ≤ -1 for yi= -1. (4)
and then for obtain equivalent to
yi(xi . w + b) -1 ≥ 0 for i = 1, 2, 3, ..., l (5)
where a . b = Ʃiai bi represents the dot product. Eq. (3) for (I don’t understand) on
the hyperplane H : xi . w + b = 1, w with normal and perpendicular to the point of
origin. margin dH1 =
w b) 1 (
, The same as with Eq.4 for for (I don’t understand)
hyperplane. to hyperplane of the distance between the two margins H1 and H2, we can use Eq. (6).
Margin = | d H1- d H
2 | = w 2
(6)
In cases, where data is not separable, slack variables ξ ≥ 0 will be introduced. Slack variables are followed by Eq. (7).
yi (xi . w + b) – 1 + ξi ≥ 0 for i = 1,2,..., l. (7)
To minimize the margin value as well as to reduce the number of missing classification; parameter C for problems in optimizing the value of margin such as:
Minimize
J
2[
w, ξ
i]
=
l
i i
C w
1 2
2 1
(8)
3.2 Nonlinear Classification
transformed by the maximizing the value of the function hyperplane with the objective attributes and every issue is considered as a collection of geometric systems consisting m points and n-dimensionally space [12]. That method takes into consideration of both of the distances to the positive ideal and negative ideal solution.
4.1 Step by Step Of TOPSIS
Normalizing The Decision Matrix
Normalizing the decision matrix serves to be the matrix D has a scale comparable value with other values.
rij =
Weighting Matrix Normalized
v
ij= r
ijx
w
j , i = 1, 2, .., m j = 1, 2, ..., n, (12)where wj representative as importance relative with respect to xj, and w1, w2, ..., wn
should satisfied for:
n
j 1wj= 1.
Determine The Positive and Negative Ideal Solution.
A+ = , solution, and calculated as below:
denotes the Euclidean Distance between the alternatives and NIS.Count the Relative Strength of Ideal Solution
All alternatives are ranked to find the best solution to the problem from a sufficient alternative, however for positive index (PI+) and negative index (NI) are calculated as below:
5 AHP-SVM-TOPSIS
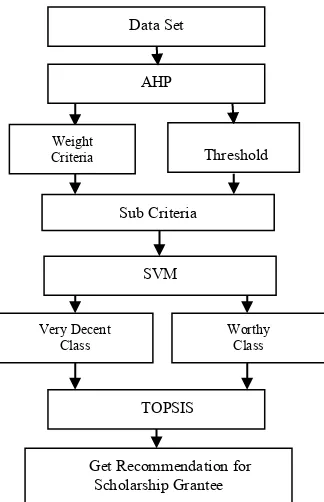
The proposed AHP-SVM-TOPSIS model removes some aspects of AHP, SVM; from three classes into two classes, uses TOPSIS for process recommendation. AHP is used to determine weight criteria and subcriteria as it assists in process computation and to determine the main criteria [15]. Classification using SVM because SVM has advantages like the curse of dimensionality to solve the problem for have few data like in this case [16]. TOPSIS is used to determine recommendations as it is the most simple method in maximizing the distance from negative ideals and in minimizing the distance for positive ideals [17]. Step by Step for AHP-SVM-TOPSIS are as follows: 1. The total data set is 111, 50 subcriteria, 13 criteria and 3 classes.
2. AHP will process weight of criteria and selection to minimize 50 subcriteria by a threshold.
3. SVM process to selection three classes to two classes using subcriteria by AHP process.
4. Class very decent and worthy will selection process by SVM method.
5. TOPSIS will process only two classes from 3 classes, and get a recommendation for each class, and then sorting from highest value TOPSIS for on the top rank. 6. GNOTA will get recommendation who will receive a scholarship.
Following major steps AHP-SVM-TOPSIS method as shown in Fig.2
Fig. 2. General Process Selection and Recommendation Using AHP-SVM-TOPSIS
Data Set
AHP
Weight Criteria
Sub Criteria
SVM
Very Decent Class
Worthy Class
TOPSIS
Get Recommendation for Scholarship Grantee
6 Result
The total of the dataset used is 111 data from registered in 2015 as students, this classification has 3 classes with 13 criteria and 50 subcriteria. The all of the criteria show in TABLE I.
TABLE I. Criteria Initialization
No Criteria Initialization
1 Parents Income C1
2 Total Dependents C2
3 Parents’ Job C3
4 Electrical Power C4
5 Electricity Cost C5
6 Total Home C6
7 House Status C7
8 Wall Condition C8
9 Floor Condition C9
10 Land & Building Tax C10
11 Total of Motorcycle C11
12 Total of Car C12
13 Scholarships Program C13
Testing is done in three scenarios, they are:
1. Testing of ratio from training data and testing data. 2. Testing of the threshold.
3. Testing of parameter Sequential Training λ, constant of γ, ε value and complexity (C).
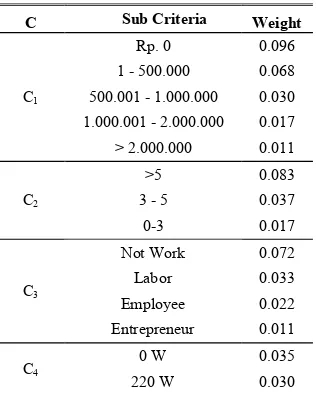
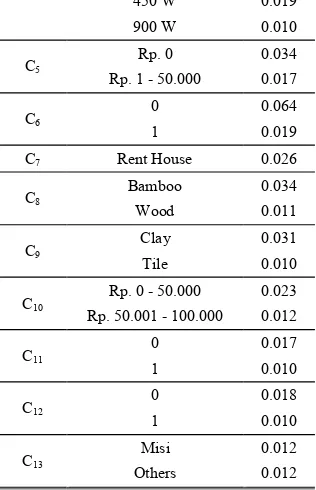
Before the result show, this is for the weight of 50 subcriteria to cut off by threshold shown in TABLE II.
TABLE II. Weight Of Subcriteria By Threshold
C Sub Criteria Weight
C1
Rp. 0 0.096
1 - 500.000 0.068
500.001 - 1.000.000 0.030
1.000.001 - 2.000.000 0.017
> 2.000.000 0.011
C2
>5 0.083
3 - 5 0.037
0-3 0.017
C3
Not Work 0.072
Labor 0.033
Employee 0.022
Entrepreneur 0.011
C4
0 W 0.035
450 W 0.019
TABLE II show of weight subcriteria by the threshold, in this case, have 50 criteria and by the best value of threshold 0.01, the criteria cut off 17 subcriteria and totally has 33 criteria.
6.1 Testing of Ratio from Training Data and Testing Data
The result of ratio from training data ad testing data shown in Fig.3. The result is if training data has a big data ratio than testing data because training data will be assisted for system recognize a pattern, and get high accuracy.
0,00
Ratio of Training and Testing Data
Fig. 3. Average of Accuracy from Ratio Training and Testing Data Using Kernel Polynomial Degree d ( d
6.2 Testing of Threshold
The result of testing the threshold in Fig 4. Shows that the best average value of the threshold are 0.001, 0.0035 and 0.01. We will choose the best average accuracy is 0.01 has 33 features, because that threshold value faster than the other in 23.55 seconds, The larger the threshold value of the selected feature becomes less and resulted in decreasing the level of accuracy that is generated by the system.
0,00 20,00 40,00 60,00 80,00 100,00
0.001 0.0035 0.01 0.015 0.02 0.025 0.03 0.035 0.04 0,07
Ac
curacy
(%
)
Value Of Threshold
Fig. 4. Average of Accuracy from Threshold Using Kernel Polynomial Degree d (d =2, Ratio = 90% : 10%,
d = 2, λ =0.5 , γ =0.01 , ε = 0.0001, IterMax = 100, C = 1).
6.3 Testing of Parameter Sequential Training λ, Constant of γ, ε Value and Complexity (C)
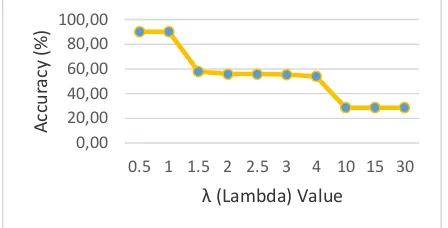
Sequential Training testing is used to find the best parameter for training a system, in this testing testing ratio data set training and testing in 90% : 10%, threshold = 0.01 and the result the best accuration is 89.94% with Sequential Training SVM λ = 0.5, γ = 0.003, ε = 0.001, Maximum Iteration = 100 and C = 1. Fig.5. show the result of λ testing, if values of λ greater, the accuracy tend to fall, because λ also affect to Augmented Vector.
0,00 20,00 40,00 60,00 80,00 100,00
0.5 1 1.5 2 2.5 3 4 10 15 30
Ac
curacy
(%
)
λ (Lambda) Value
Fig. 5. Average Accuracy Result of Testing λ Value in Sequential Training SVM ( γ =0.01 , ε = 0.0001,
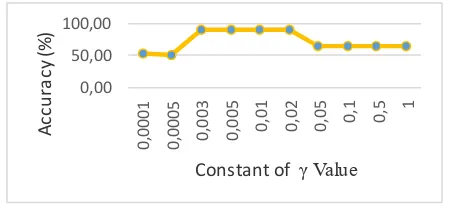
Fig.6. show the result of constant of γ values, in this testing γ has an impact to iteration, because if constant γ has small value the process learning not stable and will reach a maximum number of iterations.
0,00 50,00 100,00
0
,0
0
0
1
0
,00
0
5
0,00
3
0,005 0,01 0,02 0,05
0,1 0,5 1
A
c
c
u
ra
c
y
(
%
)
Constant of γ Value
Fig. 6.Average Accuracy Result of Testing Contant γ Values in Sequential Training (λ =0.5, ε = 0.0001,
IterMax = 100, C = 1).
Fig.7. Show testing result of ε values, ε values has an impact to maximum iteration, because if ε value bigger than max (|δα|), iteration will be stopped and in the next ε value will be has a stagnant accuracy value
0,00 20,00 40,00 60,00 80,00 100,00
0,
0000
0000
1
0.00000001 0.0000001
0.00
00
01
0.00001 0.0001
0.00
1
0.
01 0.1 1
Ac
curacy
(%
)
ε Value
Fig. 7. Average Accuracy Result of Testing ε Values in Sequential Training (γ =0.01 , λ =0.5, IterMax =
100, C = 1).
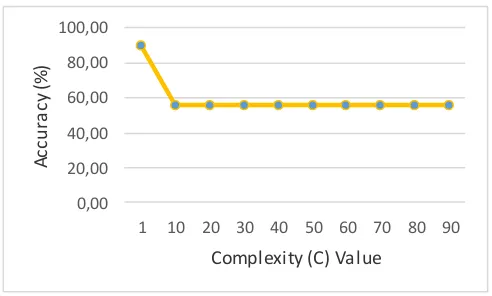
0,00 20,00 40,00 60,00 80,00 100,00
1 10 20 30 40 50 60 70 80 90
A
c
c
u
ra
c
y
(
%
)
Complexity (C) Value
Fig. 8. Average Accuracy Result of C (Complexity) Values in Sequential Training (γ =0.01 , λ =0.5 ε
= 0.0001, IterMax = 100).
7 Conclusion
The Result using implementation three methods for selection and recommendation are has a good combination. Firstly for AHP, AHP can help solve the problem for a lot of criteria and subcriteria in this problem we have a problem to cut subcriteria for next step to SVM, using AHP can solve that problem with a threshold. The best threshold is 0.01, from 50 subcriteria can be 33 criteria for classification SVM. for SVM result, we can see from the ratio shown in Fig.2, that show the best accuracy in 90% : 10%, and Sequential Training the result shown in Fig.7 the highest accuracy is 89.94% with sequential parameter are λ =0.5, constant of γ =0.01 , ε = 0.0001, and C = 1. In SVM we classify 3 classes to 2 classes for next step in TOPSIS method, and TOPSIS give a recommendation who receive scholarships from 2 class, the class is very decent and worthy.
Acknowledgment We thank the Government of Kediri District, Chariman of GNOTA Kediri District Mr. Dr. Mokh. Muhsin M.Pd for giving us the permission to conduct our research.
References
[1] Gerakan Nasional Orang Tua Asuh (GNOTA). (2016, May). “GNOTA | About Us”. [Online]. Available: http://gn-ota.or.id/.
[3] Y. Yang, Q. Du, and J. Zhao, “The Application of Sites Selection Based on AHP-SVM in 500Kv Substation”, Logistics Systems and Intelligent Management, 2010 International Conference on Vol. 2. IEEE, pp. 1225-1229, 2010.
[4] I. Cholissodin, M. Kurniawati, Indriati and I. Arwani, “Classification of Campus E -Complaint Documents Using Directed Acyclic Graph Multi-Class SVM Based on Analytic Hierarchy Process”, Advanced Computer Science and Information Systems, IEEE, pp. 247 -253, 2014.
[5] Yung-Ming Li, Cheng-Yang Lai, Chien-Pang Kao, “Building a qualitative recruitment system via SVM with MCDM approach”, Appl Intell, Institute of Information Management National Chiao Tung University, Hsinchu, Taiwan, 2010.
[6] S. Nikou, J. Mezei and H. Bouwman,”Analytic Hierarchy Process (AHP) Approach for Selecting Mobile Service Category (Consumers’ Preferences)”, International Conference on Mobile Business, IEEE, pp. 119-128, 2011.
[7] K. Shahroodi, K. Amin, S. Amini, and K. S Haghighi, “Application of Analytical Hierarchy Process (AHP) Technique To Evaluate and Selecting Suppliers in an Effective Supply Chain”, Arabian Journal of Business and Management Review, Vol. 1, pp. 119-132, 2012. [8] S. Vijayakumar and Si Wu, “Sequential Support Vector Classifiers and Regression”,
Proc.International Conference on Soft Computing, SOCO’99, Genoa, Italy, pp. 610-619, 1999.
[9] C. Cortez and V.Vapnik, “Support Vector-Network”, Machine Learning, Kluwer Academic Publisher, Boston, Netherlands, vol.20, pp. 273-297, 1995.
[10] P. Florent, S. Jorge and X. L. Yan, “Large-Scale Image Categorization with Explicit Data Embedding”, Computer Vision and Pattern Recognition, IEEE, pp. 2297-2304, 2010. [11] L. Auria and R. A. Moro, “Support Vector Machines (SVM) as a Technique for Solvency
Analysis”, German Institute for Economic Research, Mohrenstr, Berlin, Germany, 2008. [12] D. L. Olson, “Comparison of Weights in TOPSIS Models”, Mathematical and Computing
Modelling, Elsevier, Vol. 40, pp. 721-727, 2004.
[13] S. Sembiring, M. Zarlis, D. Hartama, S. Ramliana and E. Walni, “Prediction od Student Academic Performance by an Application of Data Mining Technique” International Conference on Management and Artifical Intelligence, IPEDR, Vol. 6, pp. 110-114, 2011. [14] J. Thor, S. H. Ding and S. Kamaruddin, “Comparison of Multi-Criteria Decision Making
Method From the Maintenance Alternative Selection Perspective”, The International Journal Of Engineering And Science, IJES, Vol. 6, pp. 27-34, 2013.
[15] E. Triantaphyllou and S. H Mann,”Using the Analytic Hierarchy Process for Decision Making in Engineering Application: Some Challenges”, International Journal Of Industrial Engineering, Vol. 2, pp. 35-44, 1995.
[16] D. Anguita, A. Ghio, N. Greco, L. Oneto and S. Ridella,”Model Selection for Support Vector Machines: Advantages and Disadvantages of the Machine Learning Theory”, International Joint Conference on Neural Networks, IJCNN, IEEE, pp. 1-8, 2010.