TNP2K
W
ORKING
P
APER
THE POWER OF TRANSPARENCY:
INFORMATION, IDENTIFICATION CARDS AND
FOOD SUBSIDY PROGRAMS IN INDONESIA
TNP2K WORKING PAPER 24-2015 February 2015
TNP2K WORKING PAPER 24-2015 February 2015
Abhijit Banerjee, Rema Hanna, Jordan Kyle, Benjamin A. Olken, Sudarno Sumarto
The TNP2K Working Paper Series disseminates the findings of work in progress to encourage discussion and exchange of ideas on poverty, social protection, and development issues.
Support for this publication has been provided by the Australian Government through the Poverty Reduction Support Facility (PRSF).
The findings, interpretations, and conclusions herein are those of the author(s) and do not necessarily reflect the views of the Government of Indonesia or the Government of Australia.
You are free to copy, distribute, and transmit this work for noncommercial purposes.
Suggested citation: Banerjee, A., R. Hanna, J. Kyle, B.A. Olken and S. Sumarto. 2015. ‘The Power of Transparency: Information, Identification Cards and Food Subsidy Programs in Indonesia’. TNP2K Working Paper 24-2015. Tim Nasional Percepatan Penanggulangan Kemiskinan (TNP2K). Jakarta, Indonesia.
To request copies of the paper or for more information, please contact the TNP2K Knowledge Management Unit ([email protected]). This and other TNP2K publications are also available at the TNP2K website (www.tnp2k.go.id).
THE POWER OF TRANSPARENCY:
INFORMATION, IDENTIFICATION CARDS AND
FOOD SUBSIDY PROGRAMS IN INDONESIA
TNP2K
The Power of Transparency:
Information, Identification Cards and Food Subsidy Programs
in Indonesia
1Abhijit Banerjee, Rema Hanna, Jordan Kyle, Benjamin A. Olken, Sudarno Sumarto
February 2015
ABSTRACT
Can governments improve aid programs by providing information to beneficiaries? In our model, information can change how much aid citizens receive as they bargain with local officials who implement national programs. In a large-scale field experiment, we test whether mailing cards with program information to beneficiaries increases their subsidy from a subsidized rice program. Beneficiaries received 26 percent more subsidy in card villages. Ineligible households received no less, so this represents lower leakage. The evidence suggests that this effect is driven by citizen bargaining with local officials. Experimentally adding the official price to the cards increased the subsidy by 21 percent compared to cards without price information. Additional public information increased higher-order knowledge about eligibility, leading to a 16 percent increase in subsidy compared to just distributing cards. In short, increased transparency empowered citizens to reduce leakages and improve program functioning.
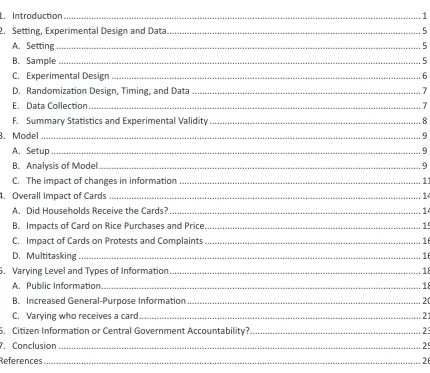
Table of Contents
1. Introduction ... 1
2. Setting, Experimental Design and Data ... 5
A. Setting ... 5
B. Sample ... 5
C. Experimental Design ... 6
D. Randomization Design, Timing, and Data ... 7
E. Data Collection ... 7
F. Summary Statistics and Experimental Validity ... 8
3. Model ... 9
A. Setup ... 9
B. Analysis of Model ... 9
C. The impact of changes in information ... 11
4. Overall Impact of Cards ... 14
A. Did Households Receive the Cards? ... 14
B. Impacts of Card on Rice Purchases and Price ... 15
C. Impact of Cards on Protests and Complaints ... 16
D. Multitasking ... 16
5. Varying Level and Types of Information ... 18
A. Public Information ... 18
B. Increased General-Purpose Information ... 20
C. Varying who receives a card ... 21
6. Citizen Information or Central Government Accountability? ... 23
7. Conclusion ... 25
References ... 26
List of Figures
Figure 1: Experimental Design ... 38Figure 2: Raskin Cards ... 38
Figure 3: Project Timeline ... 39
List of Tables
Table 1: Effect of Card Treatment on Card Receipt and Use ... 28
Table 2: Effect of Card Treatment on Rice Purchases and Price ... 28
Table 3: Effect of Card Treatment on Protests and Complaints ... 29
Table 4: Effect of Card Treatment on Rice Purchases and Price, by Consumption ... 29
Table 5A: Effect of Public Information Treatment on Seeing the Eligibility List and Knowledge about Own Status ... 30
Table 5B: Testing for High Order Beliefs ... 31
Table 6A: Effect of Public Information Treatment on Card Receipt and Use ... 32
Table 6B: Effect of Public Information Treatment on Rice Purchases and Price ... 33
Table 7: Effect of Printing Price on Cards on Rice Purchases and Price ... 34
Table 8: Effect of Distributing Cards Only to the Bottom 10 Percent on Rice Purchases and Price ... 35
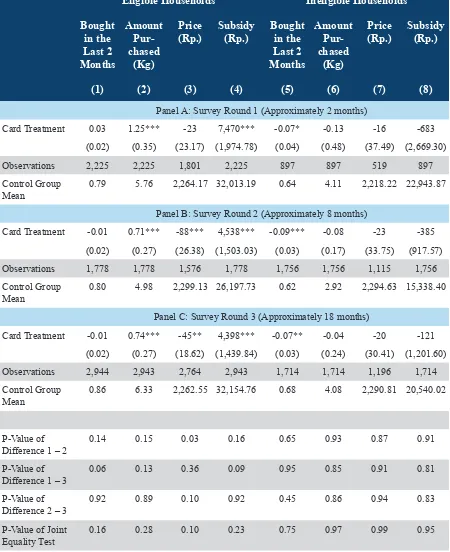
Table 9: Effect of Card Treatment on Rice Purchases and Price, By Survey Round ... 36
1. Introduction
Throughout the developing world, governments face the problem of ensuring that rules and laws that they enact are implemented as conceived. These rules typically need to be administered by someone who lives closer to the beneficiaries—such as a local politician or bureaucrat—who has his own interests, ranging from preventing conflict in his jurisdiction to promoting his career to lining his own pockets. To the extent that the implementing officials’ interests differ from the government’s intentions, the rules and policies that citizens experience might differ considerably from those on the books.
Consider, for example, a local official in charge of administering a transfer program, such as a subsidized food program or a work-fare scheme. There are a myriad of rules: who is eligible, what benefits they should receive, what they need to do to receive them, etc. In practice, the local official may have substantial leeway in how these rules are implemented. Citizens can challenge him, perhaps by appealing to an outside authority, like the central government, if they believe that they have been cheated. However, it is hard to effectively do so if the citizens do not fully understand what they are entitled to under the official rules. The fact that it is costly to complain—with no guarantee of redress— may further exacerbate this problem.
This sets up a simple bargaining game between the local official and the program beneficiary, where providing information to beneficiary households could change their mean beliefs as to what they are entitled to, the spread of said beliefs, or both. How the bargaining game plays out (i.e. what happens to the share that either eligible or ineligible households receive) depends upon how information changes beliefs, as well as the initial conditions and strategic behavior of the village leaders. Our model also allows us to analyze under what conditions we would expect changes in complaints and protests by citizens in response to information, allowing us to more directly understand the channels through which the negotiations between the village officials and citizens occur.
We experimentally test these ideas within Indonesia’s subsidized rice program, known as “Raskin” (“Rice for the Poor”). The program is designed—in theory—to provide 15 kg of subsidized rice per month to eligible households. With an annual budget of US$1.5 billion, and a targeted population of 17.5 million households, Raskin is Indonesia’s largest targeted transfer program. In practice, local officials appear to have substantial leeway in implementation, as program outcomes often fail to match the national rules: our survey reveals that while 79 percent of eligible households bought subsidized Raskin rice, they seldom received their full entitlement. Some of the rice was diverted to others, with nearly 63 percent of ineligible households also purchasing Raskin rice in the same period; other rice simply goes missing (Olken, 2006; World Bank, 2012). Beneficiaries pay over 40 percent more than the official copay. As a result, on net, eligible households received only about one-third of the intended subsidy.1
Working with the Government of Indonesia, we designed an experiment to provide information to eligible households. In 378 villages (randomly selected from among 572 villages spread over three provinces), the central government mailed “Raskin identification cards” to eligible households to inform them of their eligibility and the quantity of rice that they were entitled to. To unbundle the mechanisms through which different forms of information may affect program outcomes, the government also experimentally varied how the card program was run along three key dimensions—whether information about the beneficiaries was also made very public, whether an additional rule (the copay price) was also listed on the card, and whether cards were sent to all eligible households or only to a subset.
We then surveyed both eligible and ineligible households in all villages, two months, eight months, and eighteen months after the cards were mailed. Since the cards could affect both the amount of rice received and the price, we focus on understanding the impacts on the total subsidy received, defined as the quantity of rice purchased multiplied by the difference between the market price of rice and the copay that the household paid. We also measure individual beliefs about the program, as well as the protests and complaints to local leaders, to understand whether citizens gained and used the information and to shed light on the mechanisms that we outline in the model.
The beneficiary card distribution greatly increased the subsidy received by eligible households. This occurred despite the fact that the card distribution itself was not fully implemented as the central government intended: eligible households in treatment villages were only 30 percentage points more likely to have received a card relative to those in the control villages. Yet, despite this, eligible households in treatment villages received a 26 percent increase in subsidy relative to equivalent households in control villages, stemming from both an increase in quantity purchased and a decrease in the copay price.2 Fewer ineligible households received rice in cards villages, and complaints and protests from
those who could no longer buy rice increased. However, ineligible households received more conditional on purchase, so there was no reduction in the aggregate subsidy that they received. The fact that the eligible households received more, while ineligible households in total received no less, implies that the cards reduced leakage, increasing the total amount of rice distributed in the villages by 17 percent.
Notably, we do not observe that the intervention “undid” a local fix of a “bad” rule. The targeting formulas have errors (see, e.g., Alatas et al 2012) and so there could be rich households that are eligible and poor ones that are not. A local leader may deviate from the official beneficiary list to provide the subsidy to the ineligible poor. More citizen information may force him to undo this benevolent deviation. However, in practice, we do not observe that the poorer, ineligible households lose out; this, combined with the fact that leakages decrease, suggests that the cards had real effects in ensuring that the program’s overarching goals of reaching the poor were achieved.
We then examine the different mechanisms through which transparency could have an effect. First, we explore the effect of providing public information to citizens rather than just private information. Specifically, in half of the card villages (randomly selected), the beneficiary list was posted all over the villages and information about the cards was played on the village mosque loudspeaker (“public information”), in addition to mailing out the cards (“standard information”). This public information
increased everyone’s knowledge about their eligibility status. Eligible households in the public information villages received twice as much additional subsidy as they did under the cards treatment with the standard information only. This treatment appears to have also promoted second order knowledge, as it not only affected eligible households’ own knowledge, but it also made villagers of all types more conscious of the fact that others knew about the official eligibility list. This higher-order knowledge could have had the potential to make it easier for villagers who were being denied their rights to coordinate with other villagers in trying to get redress, and indeed, we find more organized protests in these villages.
Second, to examine whether general information about specific program rules mattered over and above the sense of a clear individual entitlement generated by the receipt of the card, in half of the villages chosen at random, the cards were printed with information about the official copay (Rp. 1,600 per kg), in addition to the quantity of rice eligible households should receive (15 kg per month). In the remaining villages, the cards only contained the information about quantity. Adding the price information increased both card use and the total subsidy that households received. Interestingly, the subsidy effect was driven by the quantity of rice that eligible households received, which could occur in a bargaining setup if, for some reason, it is easier for the local officials to discriminate among households on quantity rather than price.
Third, the government experimented with varying who the cards were sent to: in a random set of villages, cards were only mailed to the bottom decile of households, as opposed to mailing them to all beneficiaries. The full beneficiary list that was given to the village head was identical in both treatments, so the leader’s information about who is eligible was the same, so only the citizens’ information was varied. Households who received cards experienced the same increase in subsidy regardless of whether everyone received cards. Eligible households that were assigned not to receive a card looked no different than those in the control areas, yet the overall protests are lower in this case than when all eligible households receive a card. This is consistent with the model: if there are fewer cards in the village (i.e. fewer informed eligible households), the village head will choose to reduce the amount given to ineligibles less than if more cards had been given out, and therefore the number of protests will go down.
The results presented thus far suggest a role for citizen information in enhancing program performance. One possible alternative interpretation of the findings is that the local leaders interpreted the intervention as a signal of the fact that the central government was monitoring them more along this dimension. In this case, our results would not be driven by citizen empowerment. The fact that citizen protests and complaints had changed in response to the information argues against this interpretation since it suggests that citizens increased pressure on local officials as a result of the program. Moreover, the fact that the card effect persists over time—for as long as 18 months after the distribution—even though by then the local officials would have surely updated their beliefs about the lack of additional monitoring by the central government, also suggests that information drives the observed effects.3
However, to test this more directly, we also introduced a treatment that aimed to vary the perceived level of central government accountability: in half the villages, the cards had clip-off coupons to be collected by the local leader from those to whom he gave the rice and remitted to the central government. The theory was that knowing that he has to remit the coupons to the government might induce the local leader to better implement the rules. Importantly, this treatment could also shift bargaining power, either by enabling eligible households to threaten to withhold their coupons unless they get more or by bolstering the local leader’s ability to block the ineligible households that lack coupons.
We can use our data to differentiate between these alternative mechanisms: we find that the coupons simply increased village leaders’ bargaining power with respect to citizens relative to just the cards. Rather than implementing the rules better in response to central government monitoring, the coupons enabled local leaders to reduce both access to the rice and the total subsidy for ineligible households, without a corresponding increase to eligible households—i.e. there was more leakages in areas with the coupons relative to areas with just the card.
The idea of “transparency” is fundamental in the fight against corruption, so much so that the largest worldwide, anti-corruption non-profit is called “Transparency International.” However, despite its importance, to date, there is relatively little empirical evidence on the impact of transparency.4 We
contribute to the literature by showing that providing information directly to citizens on program rules can directly reduce leakages, independent of election mechanisms, and do so at a relatively low cost: the cards yield subsidy returns greater than 6 times their cost, even assuming the effect lasts just one year. Importantly, we show that the effect of transparency was driven by the information changing the relative bargaining power of households and local officials, and not from changes in the local leader’s perceived beliefs about greater central government accountability. Finally, we also contribute by showing that the form of the information (e.g. public or private) may matter as well. Taken together, our findings imply that providing information directly to citizens may be an effective way to improve government performance relative to interventions that aim to simply provide greater central government monitoring of local officials, which have proved difficult to sustain over time (Banerjee, Glennerster and Duflo, 2010; Dhaliwal and Hanna, 2014).
The remainder of the paper proceeds as follows. Section II describes the setting, experimental design and data. Section III provides a simple model to underscore how information could change relative bargaining power. Section IV provides the overall effect of the cards. Section V explores how varying levels and types of information affect program outcomes, while Section VI explores the alternative mechanisms through which transparency may operate. Section VII concludes.
2. Setting, Experimental Design and Data
A. Setting
This project explores the impact of proving information to citizens within Indonesia’s subsidized rice program, known as “Raskin” (Rice for the Poor). Introduced in 1998, by 2012, the program targeted 17.5 million low-income households, allowing them to purchase 15 kg of rice at a copay price of Rp. 1,600 per kg (US$0.15), about one-fifth of the market price. The intended subsidy value—about 4 percent of the beneficiary households’ monthly consumption—is substantial. It is Indonesia’s largest permanent targeted social assistance program: in 2012, the budget was over US$1.5 billion, and it distributed 3.41 million tons of subsidized rice (Indonesian Budget, 2012).
Beneficiaries, however, do not necessarily receive all of the intended benefits. Leakages are abundant— a substantial amount of rice never reaches citizens (Olken, 2006; World Bank, 2012). Targeting is also a problem: local officials who administer the distribution have a high degree of de facto discretion over
who can access it.5 For a variety of reasons (such as political pressures, views of fairness, maintenance
of social accord, and so forth), local officials distribute Raskin more widely than the central government intended when it designed the program: 63 percent of officially ineligible households in our control group had purchased Raskin rice at least once during the last two months. Since these ineligible households are generally richer than eligible ones, diverting rice to them reduces the program’s redistributive goals. Third, local leaders often inflate the copay: in the control group, eligible households paid on average 42 percent above the official price.6 On net, the combination of these problems result in eligible households
receiving only a third of their intended subsidy.7
B. Sample
This project was carried out in 6 districts (2 each in the provinces of Lampung, South Sumatra, and Central Java). Importantly, the districts are spread out across Indonesia—specifically, on and off Java— in order to capture important heterogeneity in culture and institutions (Dearden and Ravallion, 1988). Due to the constrained timeframe for providing feedback into the national policy, we chose to conduct the experiment in villages where we had previously worked and thus had household level data that could serve as a baseline survey.8 Thus, we stratified the treatment assignments in this project by the
previous experiment to ensure balance.
Within these districts, we had originally randomly sampled 600 villages. We dropped 28 unsafe villages prior to conducting the randomization, for a final sample of 572 villages (40 percent urban and 60 percent rural villages).
5 Alatas et al (2013a) show that the manipulation of the beneficiary lists by local leaders likely happens during the distribution of the rice, rather than through the determination of the official eligibility lists.
6 Some of this stems from the fact that local leaders bear real transport costs in collecting and distributing the rice (e.g. trucks rentals, storage space), but both qualitative research (Smeru, 2008) and our own estimates (reported in Banerjee, et al, 2014) suggests that higher price often exceeds these real costs.
7 Authors’ calculation from control group of sample.
C.
Experimental Design
As shown in Figure 1, we randomly chose 378 of these villages to receive Raskin cards, with the remaining 194 villages serving as a control. For all villages where cards were mailed, we experimentally varied the card program along four dimensions: the number of cards, public information in addition to cards, whether the cards included price information, and whether the cards included tear-off coupons.
In 194 control villages, the government continued to run the program under the status quo. The government mailed a soft-copy beneficiary list to districts with instructions to send one hard copy to the village government. The government also mailed an informational packet on program rules directly to village governments, including instructions to publically post the beneficiary list and to distribute rice only to those on the list. In these villages, households did not receive Raskin identification cards or any other form of information from the central government.
In the 378 remaining villages, the central government did everything they did in the control villages, but also mailed out “Raskin cards” and instructions on how to use them to beneficiary households via the postal service. Figure 2 shows an example of a card, which contains the household’s identifying information plus instructions that they are entitled to receive 15 kg of subsidized rice per month. Postmen delivered the cards directly to households when possible; however, as in most developing countries, the postal service has a limited ability to do so, particularly in rural areas. As such, only 15 percent of the households that received a card report receiving it directly from a postal worker; the rest received it from local officials.
We explore four variants of the cards treatment. First, we experimentally varied the degree to which information was public. In 192 villages (randomly chosen) that received cards, additional public information, beyond the status quo information, was provided regarding both the presence of the cards and eligibility. The goal was to not only increase knowledge of one’s own eligibility status, but to also increase common knowledge within the village. To this end, a community facilitator hung up additional posters—announcing the cards and publicizing the beneficiary lists—within different neighborhoods of the “public” villages. They also played a pre-recorded announcement about the cards in the local language over the village mosque loudspeaker (a common advertising technique in Indonesia).9 The
facilitator spent about 2 days in each village, and so the relative cost of this additional information was only about US$1.40 per beneficiary household.10
Second, in 187 randomly chosen card villages, the government printed the copay price on the card (see Figure 2). In the remaining villages, it was not printed. This was done to understand if holding constant the card receipt, increasing information about a general program rule would increase the subsidy received.
9 Appendix Figure 1 shows an example of the posters used to announce the cards. There were eight variants of the poster to reflect the combinations of the sub-treatments: with and without price, with and without coupons, and distributed to all eligible households or only to the bottom 10 percent.
Third, in half the card villages (randomly selected), all eligible households (30 percent of the village) received cards. In the remaining card villages, cards were only mailed to those in the lowest decile of predicted per capita household consumption (32 percent of eligible households, or 10 percent of the whole village). The other eligible households were still on the lists and posters provided to the local officials and they were still eligible to receive Raskin despite not having a card. This allows us to shed light on what happened when fewer people in the village are informed.
Finally, we used coupons to vary the perceived extent of central government monitoring of card use. In 189 randomly chosen card villages, the cards included tear-away coupons for each month that the card was valid (September 2012-December 2013), which were supposed to be remitted to the central government to prove that the village complied with the beneficiary list. Note, however, that this treatment could also shift bargaining power between citizens and leaders, either by enabling the eligible to threaten to withhold their coupons unless they get more, or by bolstering the leader’s ability to block the ineligible on the grounds of not having a coupon.
D.
Randomization Design, Timing and Data
Figure 1 shows the number of villages randomly assigned to each treatment. For the assignments of control, card, and card only to the bottom 10th decile, we stratified by 58 geographic strata (sub-districts) interacted with the previous experimental treatments. For all other experimental variations (price, public information, and coupon), we stratified by district, previous experimental treatments, and cards.
Figure 3 shows the timeline. In July 2012, the central government mailed the program guidelines and the new list of eligible households to local governments. In August, the government mailed the cards to eligible households in card treatment villages. In September and October, the additional public information treatment was conducted in the villages that were randomly assigned to receive it.
E.
Data Collection
We conducted two primary follow-up surveys: one in October to November 2012, at least two months after cards were mailed, and a second in March to April 2013, about eight months afterwards. In both surveys, SurveyMeter, an independent survey organization, visited randomly selected households and asked them about their experience with Raskin, as well as other characteristics. We oversampled eligible households to ensure sufficient power for this group. In the second survey, we also sampled some respondents who had been surveyed in our previous experiment (Alatas et al 2013b), to take advantage of pre-treatment information. Additional sampling details can be found in Appendix 1.
transfer program that was rolled out concurrently.11 Thus, we report the results of this endline separately
to shed light on longer term effects of the original Raskin card, but caveat that these 18 month results may be affected by these other activities.
F.
Summary Statistics and Experimental Validity
Appendix Table 1 provides sample statistics from the control villages to provide a description of Raskin in the absence of the intervention. On average, 84 percent of eligible households bought Raskin in the last two months; however, 67 percent of the ineligible households did so as well. Eligible households typically bought only a third of their official allotment (5.3 kilograms out of 15) at an average price of Rp. 2,276, over 40 percent higher than the official copay price of Rp. 1,600. Combined, this implies that the eligible households received an average subsidy of Rp. 28,605, or 32 percent of their entitlement (Rp. 88,680).12 Seven percent of eligible and 5 percent of ineligible households report having a card
for Raskin in the control group, which may be because a few local governments had previously issued cards.
Appendix Table 2 provides the randomization check for the main card treatment, and Appendix Table 3 provides the randomization check for card variants. The ten variables shown were specified prior to the randomization. Only one out of 10 differences in Appendix Table 2 and only two out of 40 differences shown in Appendix Table 3 are significant at the 10 percent level, consistent with chance, suggesting the randomization was balanced.
11 This final endline reveals that 91 percent of eligible households in treatment areas and 93 percent in control areas received a Social Protection Card mailed out in July 2013. However, while 99 percent of card recipients report that the Social Protection Card was used for the cash transfer program, just 1 percent report it was used for Raskin. These percentages are similar in treatment and control group.
3. Model
A. Setup
We propose a simple bargaining model to explore possible impacts of information on the negotiation between the village leader and a Raskin beneficiary over the division of program benefits. This is important to formally analyze: the prevailing belief is that more transparency will always increase what citizens receive, but as we show, the impact may be more nuanced once we take into account the village official’s incentives and how information changes the distribution of citizens’ beliefs.
Suppose there is a population of potential beneficiaries of mass 1 indexed by i, who are each entitled to a
total value of benefits denoted by B. The local leader must decide how much of these benefits (Xi∈[0,B])
to offer to each potential beneficiary, i.
The bargaining process is simple: the leader makes a take or leave it offer to each villager. If the villager accepts, he gets Xi and the leader keeps B – Xi. If the villager does not accept, he has the option
of complaining to an outside authority at cost C. Complaining can yield higher benefits, but the
(risk-neutral) villagers do not exactly know by how much. However, each villager has a prior pi on the
likelihood that he is eligible and, if so, conditional on complaining, he expects to receive Bi. Both pi and
Bi vary by individual, but what is relevant is the distribution of the expected value Yi = pi Bi .
There are two categories of villagers, eligible and ineligible, in fraction α and 1 – α, and they differ in beliefs: eligible villagers’ beliefs are independently drawn from the distribution function Ge(Y) while
ineligible villagers’ expectations are drawn from Gn(Y). The leader knows the distributions Ge(Y) and Gn(Y), but not the Yi of the particular villager i with whom he is interacting.
When there is a complaint, the leader may need to compensate the complainant, as well as incur an additional negotiation cost. On net, the leader gets Ze when the complainant is eligible and Zn otherwise.
This nests the possibility that Ze = 0 and Zn = B, namely that the eligible get all of B when they complain
and the ineligibles get zero. The leader gets what remains from B in each case.
Complaints have a political cost: the higher the number of complaints, the more likely the leader will be replaced. We capture this by assuming that the probability that he keeps his job in the next period is
1–F(αμe+(1–α) μn ) where μe and μn are the fraction of eligible and ineligible people who complain and F is a positive increasing function with F(1) < 1. The leader lives forever, but he cannot regain his job
once he loses it. Finally, assume that the leader’s discount factor is δ< 1.
B.
Analysis of Model
Given these assumptions, a villager will complain as long as Yi – C > Xi , i.e. his beliefs about expected
benefits from complaining are greater or equal to the benefits if he does not complain. Therefore, the probability that someone who is offered Xi will not complain is Gi (Xi + C). The following lemma provides
sufficient conditions under which the leader will offer the same X to everyone who holds the same beliefs:13
13 When F(μ)is strictly convex, and G
e(⋅) or Gn(⋅) is sufficiently convex, it may be optimal for the leader to offer different X’s
Lemma 1. If either of the following conditions is satisfied, then it is optimal for the leader to offer the
same Xi = Xe to all eligible, and the same Xi = Xn to all ineligible:
i. If Ge(Y) and Gn(Y) are uniform distributions, and both include C in their support, that is, Gi(C) > 0 for i = e,n. That is, there exist some people who will not complain even when offered zero.
ii. If F(μ) is weakly concave in total complaints μ = αμe + (1 – α) μn .
We provide the proof of this result in Appendix 2. Assuming the conditions of the lemma are satisfied, we can rewrite the leader’s problem as:
where V is the present discounted value of being a leader. Taking first order conditions with respect to Xe and Xn , and assuming that we are at an interior optimum, yields:
(1)
(2)
where μ = αμe + (1 – α) μn measures total complaints and he(⋅) = Ge’(⋅)/G
e(⋅) and hn(⋅) = Gn
’(⋅)/G
n(⋅) are
the reversed hazard functions corresponding to Ge(⋅) and Gn(⋅). To close the model, we also include
the condition that the present discounted value of being a leader is correctly related to the per-period
payoffs:
(3)
We study a policy experiment – giving out Raskin cards – that involves a change in individual’s knowledge about the Raskin program. We assume that the program only affects the beliefs of the eligible and that ineligibles’ beliefs are unaffected. This is consistent with the primary treatment, which provides private information to eligible citizens about their eligibility in the form of cards, but does not necessarily provide any information to ineligible households. Specifically, assume that in control locations, the beliefs of the eligible and the ineligible are given, respectively, by uniform distributions, so that Ge(y)~Uniform[Be – Δe ,Be +Δe] and Gn(y)~Uniform[Bn – Δn ,Bn +Δn], which implies
that for j = e,n. Also, assume that F’(μ) is a constant φ > 0. With these
assumptions, the first-order conditions can be rewritten as:
(4)
(5)
or
max
′
′
Δ
(6)
(7)
C.
The impact of changes in information
We model providing Raskin cards as inducing a shift in people’s beliefs, Ge(⋅) and Gn(⋅). This could take
several possible forms. For example, receiving Raskin cards could lead to a reduction in the variance of
Ge(⋅), if people previously had diffuse, but correct-on-average, priors about program rules. Alternatively,
it could lead to an increase in the mean of Ge(⋅), if for example government officials misled them
about program rules (such as the true copay price). It is also possible for mean and variance to change simultaneously; for example, if some eligible households did not know they were eligible, informing all eligible households they were eligible would increase the mean and reduce the variance of Ge(⋅).
To understand each possible effect, we introduce them one by one. We then trace them out not only on what households receive, but also on whether we would expect each type of household to complain more or less with these changes.
Tightening beliefs: reducing the variance ofGe(⋅)
Consider first the effect of a small decrease inthe variance of Ge(⋅), i.e. a small reduction in Δe . Recall
that μe = 1 – Ge(Xe + C) is the fraction of the eligible that complain, and μn is the fraction of the ineligible
that complain. We can then show the following result:
Result 1: Starting from an equilibrium where X
e + C ≥ Be , so that a majority of eligible
households were not complaining absent the intervention, then and, ,i.e. decreasing the variance of eligible households’ beliefs increases transfers to both eligible and ineligible, and both groups complain less. Otherwise, starting from an equilibrium where and are of ambiguous sign and and , i.e., it is ambiguous what happens to the eligible, but the ineligible receive less and complain more.
Proof: See appendix.
The surprising aspect of this result is that increasing eligible households’ information in the sense of making their beliefs more precise does not necessarily mean they will receive more benefits. There are two offsetting effects: On the one hand, reducing the variance of eligibles’ beliefs means that the leader can bargain with them more efficiently. When Δe declines, the density of eligible households that are at
the threshold of rejecting the village head’s offer increases. This means that the village head obtains a greater reduction in complaints for a given increase in Xe. This increases the marginal return of Xe from
the village head’s perspective, so he will increase his offers to the eligible, giving rise to the intuitive effect that the precision of eligibles’ information increases their transfers. This effect is always present as long as we are at an interior solution.
The potential offsetting effect comes from the fact that a decline in Δe may lead to a direct, first-order
reduction in the future value of being in office V, holding Xe constant, by changing the fraction of people
who are rejecting offers and complaining. Recall that people complain if Yi – C > Xi . Since Be is the mean
Δ
Δ
, ,
of Yi , if Be – C > Xe , then reducing Δe has a first-order impact of making more people complain, since it
reduces the number of people for whom Yi – C > Xi. The increased complaints will lower the future value
of being in office, V, which in turn reduces offers to both eligible and ineligible households (equations
6 and 7). Whether this effect dominates the previous, opposite effect for the eligible is ambiguous, but the effect on the ineligible is unambiguously negative.
Of course, if Be – C < Xe then the reverse is true—a reduction in Δe has a first-order impact of making fewer
people complain, since it reduces the number of people for whom Yi – C > Xi . In this case, V increases,
reinforcing the incentive effect described above for the eligible and also making it more attractive to give more to the ineligible. Empirically, complaints in the control areas by eligible households appear relatively small: we observe at least one complaint by those buying rice in less than 50 percent of the villages, and when there is at least one complaint, we observe only 3 percent of households total making any form of complaint. This suggests that this latter case where Be – C < Xe is more likely to be relevant.
More optimistic beliefs: raising the mean ofGe(⋅)
A second possible effect of providing information to the eligible is to raise the mean belief of the eligible (Be), keeping the variance unchanged. Again, as information is only provided to the eligible,
we assume that the beliefs of the ineligible do not change. The following result summarizes the impact:
Result 2: has ambiguous sign, so increasing the mean beliefs of the eligible does not necessarily increase the benefits they receive. However,
The intuition is as follows: increasing Be increases the fraction of eligible households who complain,
holding Xe constant. This decreases the future value of being a leader, so the leader offers less to
ineligibles, i.e. Xn decreases and complaints μn increase. For eligibles, there are again two offsetting
effects: there are fewer eligible people accepting the offer, which reduces the cost of sweetening the offer to them slightly, but the future value of being in office has declined, which will lead the official to reduce Xe . Which of these effects dominates is theoretically ambiguous.
Shifting both mean and variance simultaneously
If some households were misinformed, then informing all eligible households of their eligibility could both increase the mean and decrease the variance of beliefs simultaneously. In this case, it is possible to observe a pattern that is inconsistent with either of the previous two results (unless it is true that more than half the eligible population complains in control areas). The following result illustrates this possibility:
Result 3: Suppose that B
e increases and Δe goes down at the same time. Then it is possible to find
parameter values such that benefits go up for eligible villagers and they protest less (Xe increases and μe decreases), but the reverse is true for ineligible villagers (Xn decreases and μn increases), even when
the fraction of the eligible complaining in treatment is less than half.
This result says that it is possible that providing information to the eligible improves their outcomes and decreases their complaints, but worsens outcomes for ineligibles and increases their complaints, which cannot happen with a change in either Be or Δe alone (except when more than half of the eligible
complained in control areas).
To illustrate this possibility, Figure 4 shows the results of varying both the variance and mean beliefs of the eligible from a numerical simulation of the model.14 This example starts from an equilibrium
where less than half of eligible and ineligibles are complaining. Each figure plots the proportional change in the outcome variable (eligible/ineligible benefits/complaints, and the value of being a leader) due to a change in Be (X axis) and a change in Δe (Y axis). Consistent with Result 1, Figure 4 shows
that a marginal tightening of the beliefs of the eligible (lower Δe on the Y axis, holding Be constant)
increases the benefit level and decreases complaints for both eligible and ineligible. More optimistic beliefs for the eligible (higher Be on the X axis) increase benefits for the eligible and decrease those for
the ineligible, while complaints go up for both groups, as in Result 2.
With the exception of the effect on benefits for the eligible, the effects of tightening the variance of beliefs and increasing the mean go in opposite directions. Thus, the combined effect (the lower right quadrant of each subplot) depends on which margin is changed more. The triangular region delimited by a white line, shown in each subplot in Figure 4, is the set of changes in Δe and Be such that after the
change the eligible receive higher benefits and complain less, while the opposite happens for ineligible, i.e. the possibility result described in Result 3.
In short, the results suggest that the impacts of information are not, ex-ante, obvious – while they may improve outcomes, we cannot a priori rule out the perverse possibility that they may worsen them, even for those directly informed, if they decrease the future value of holding office for the local official making the decisions.
14 We choose the following parameter values: The eligible comprise α = 25% of the population. The total Raskin benefit is normalized to B= 90, the beliefs of eligible are given by Be = 60 and Δe = 30, and those of ineligible are given by Bn = 30 and
Δn = 30. The cost to complain is C = 10. The leader’s payoffs when eligible and ineligible complain are Ze = 30 and Zn = 60.
4.
Overall Impact of Cards
A.
Did Households Receive the Cards?
We begin by examining whether households in the card treatment villages received the cards, and whether this intervention translated to increased knowledge of eligibility status. Table 1 provides the results. Unless otherwise noted, we estimate:
ykvist = αk + αst + βTREATv + ϵkvist
where k represents a stratum, s represents a type of household sampled, t represents a survey round, v
represents a village, and i represents a household. Since the results are similar across survey rounds,
we pool them for most of the analysis; we provide the disaggregated analysis in Section VI. We include sample dummies interacted with the survey round dummy, as well as stratum fixed effects.15 Each
column comes from a separate OLS regression of the respective outcome on the treatment, with standard errors clustered by village. In Columns 1-3, the sample is eligible households (those who were on the official central government list), while in columns 4-6 the sample is ineligible households (randomly selected households who were not on that list).16
Eligible households in the treatment group were 30 percentage points more likely to receive the cards than those in the control villages (Column 1 in Table 1). Households may not receive cards if they get lost in the mail system, addresses are difficult to assess, village leaders block delivery to either particular households or the entire village, etc. Nonetheless, it is a statistically significant and economically meaningful increase in the number of cards. By comparison, ineligible households in the treatment group were only three percentage points more likely to receive cards (Column 4). Ineligible households may receive cards for a variety of reasons—corruption, reallocations at the village level of slots from poor to rich, imperfect matching of the survey data to government rolls, and so forth—but the overall level is dramatically lower than those who were eligible.
In villages where the cards were mailed out, card use increased: eligible households were 15 percentage points more likely to use a card to purchase Raskin rice. Note that even if one did not use it, the act of
getting a card may still be important. Qualitatively, some households we interviewed explained that
they were told to simply store the card with their important documents rather than use it.
We then ask whether the card treatment increased people’s beliefs about their eligibility.17 Eligible
households were 9 percentage points, or 30 percent over the control mean, more likely to correctly know their eligibility status in the treatment group than the control (Column 3). Similarly, the ineligible
15 Appendix Table 4 replicates the specifications in Table 1, with varying levels of controls; the results are near identical with either no or additional controls. Appendix Table 5 shows that the eligible households in Java were more likely to receive the card than those off Java. However, even off Java, where we expect weaker institutions, there is a strong and positive effect on card receipt for eligible households (Column 1).
16 For some randomly selected card villages, the cards were mailed only to households in the bottom decile. For these villages, only households that were mailed a card are included in the eligible sample; those who are eligible for the Raskin program, but who were not mailed a card, are dropped from the main analysis (we explore their outcomes in Section V). We reweight the regressions so that, on average, the weighted fraction of households from the two types of eligible households (bottom decile and other eligible) are identical in treatment and control areas in each of the 58 geographic strata.
were five percentage points, or 14 percent over the control mean, more likely to know their status in the treatment villages (Column 6).18 This suggests that the cards increased information, and in particular,
increased eligible households’ beliefs about what they were entitled to. From the perspective of the model, we do not know if the change in beliefs was just an increase in the mean beliefs of what they were entitled to (i.e. raising in the model), or also a reduction in the variance; we will explore the implications of this below when we examine the results.
B.
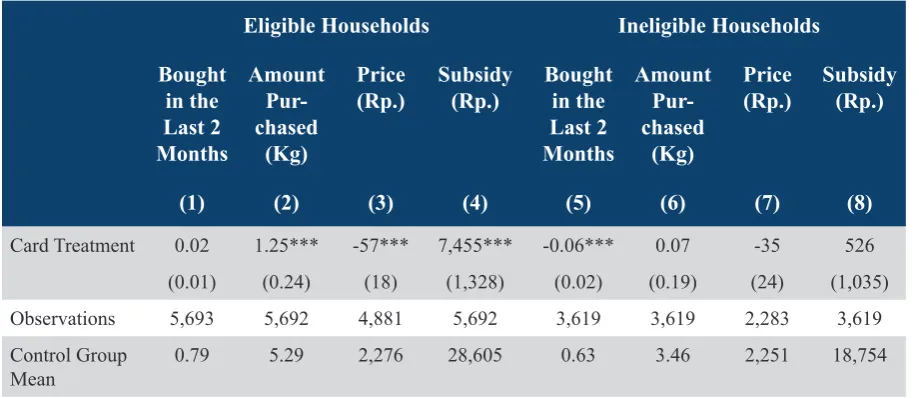
Impacts of Card on Rice Purchases and Price
Table 2 explores the impact of the cards on the purchase of Raskin rice in the two months prior to the survey, quantity, price paid, and the overall subsidy received. The sample structure and regressions are the same as in Table 1.19 The quantity and subsidy variables are coded as zero if no purchase was made
and thus capture both intensive and extensive effects. Price, however, is conditional on purchase, since it is unobserved for households that do not purchase the rice.
The card treatment substantially increases the eligible household’s subsidy received. While eligible households were no more likely to buy Raskin in the last two months (Column 1 in Table 2), we observe large changes in both quantity and price: eligible households in card villages bought 1.25 kg more rice and paid a copay price of Rp. 57 less than control villages (Columns 2-3). This translates to a Rp. 7,455—or about a 26 percent—increase in subsidy received (Column 4).20
Ineligibles were 6 percentage points less likely to purchase Raskin in the last two months (Column 5). However, there is no significant difference in the total amount of rice purchased by ineligibles (Column 6), since the quantity conditional on purchase also rose for the ineligibles that were able to buy after the treatment (Appendix Table 9). Thus, on net, there was no change in subsidy received by ineligible households (Column 8).
Since the cards increased the quantity received by eligible households, but did not decrease the quantity received by ineligibles, this implies that on net, the cards resulted in a substantial reduction in leakages. Weighting the eligible and ineligibles by their respective shares in the village, we estimate that the cards increase the total amount of rice distributed by 17 percent—thus, there was a 36 percent reduction in “lost” rice.
18 All of the increase in ineligibles’ knowledge comes from public information villages, with no change in ineligibles’ information in standard information villages, consistent with the model.
19 Appendix Table 6 shows that the results are near identical regardless of adding or removing controls. Appendix Table 7 shows a larger gain in subsidy for eligible household in Java than off-Java, consistent with treatment households in Java being more likely to receive cards (Appendix Table 5).
C.
Impact of Cards on Protests and Complaints
The theory suggests that an important mechanism through which transparency could matter is through complaints or the threat thereof. The level of complaints could change on the equilibrium path for several reasons in the model, and as discussed above, the net impact of an increase in information on the complaints voiced by eligible and ineligible households depends on whether the information represents a decrease in variance of beliefs (i.e. decreased Δe ), an increase in the mean of beliefs (i.e. increased
Be), or both.
In Table 3, we report on the experience of the village head in his interactions with citizens. We investigate the whether there were citizen “protests” and whether there were any of four different types of “complaints”: complaints from those who receive rice, complaints from those who did not receive rice, complaints about beneficiary selection process, and complaints about the distribution process.21
The likelihood of complaints is altered by the cards treatment. Specifically, protests increase substantially in card villages (Column 1). Complaints by those who do not receive Raskin increase by 8 percentage points—about a 36 percent rise over the control group mean—in the treatment areas, while those who purchase Raskin rice complain less. The treatment spurs more complaints about the beneficiary listing, and fewer complaints about the distribution process.22
In short, the results are consistent with the treatment both increasing the mean beliefs and reducing its variance: eligible households receive more benefits and complain less, while fewer ineligibles receive benefits and they complain more. More generally, protests and complaints are affected by the cards treatment, suggesting that they are an important part of how citizens bargain with the village head, as suggested by the model.
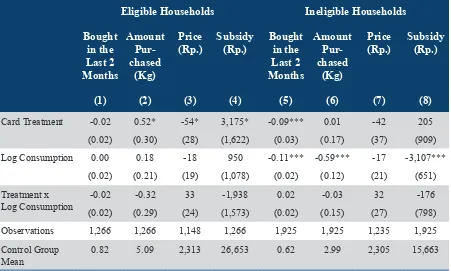
D. Multitasking
One concern with transparency programs is they focus attention on those aspects of the program that can be made transparent, at the cost of other aspects that are equally important. In this setting, the program objective is to distribute rice to the poor. However, the government’s official eligibility list is based on assets, which are a good, but imperfect, measure of poverty. One could imagine a benevolent village head redistributing from eligible to ineligible households to correct errors and ensure that the poor, ineligible households are taken care of. The cards intervention could prevent him from making these types of desirable transfers.
21 Protests generally refer to simultaneous protests by multiple people, whereas complaints are individual. Complaints about the beneficiary selection process are comprised of the following specific types of complaints: “Process of data collection and selection for program beneficiaries was not transparent,” “There was practice of corruption/collusion/nepotism in determining beneficiaries,” “The allocation was not fair,” “Aid was given to those who were not suitable to the program,” “Household that used to be eligible for Raskin is no longer eligible,” and “The latest Raskin Beneficiary list was not accurate”; complaints about the distribution process include: “The amount of aid received was not matched,” “Raskin came late,” “The fee was not matched with the regulation,” “The new Raskin quota did not meet the desired amount,” “Location of Raskin pick up point was not pleasant,” and “Raskin quality was poor.”
In Table 4, we test whether the card treatment shifted resources away from poor households, as measured by their per capita consumption measured prior to the experiment. We interact the treatment with baseline log per capita consumption (LOGCONSUMPTIONi) and estimate:
ykvist = αk + αst + βTREATv + ωLOGCONSUMPTIONi + γTREATv × LOGCONSUMPTIONi + ϵkvist
5.
Varying Level and Types of Information
Providing information potentially affects the bargaining between households and village officials in multiple ways. The information printed on the cards, as well as the way the cards are publicized, can affect both what individuals know and what is common knowledge about program rules and eligibility. The cards can make a difference only to those who receive them, or could change the outcomes for all citizens. Thus, we varied three different dimensions of how the cards were implemented to shed light on these kind of questions. In this section, we explore each of these issues in turn.
A.
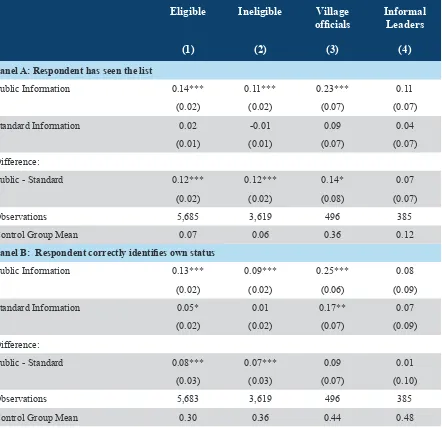
Public Information
In half of the card villages (randomly selected), the government conducted the “standard” procedures: local leaders received the beneficiary list and were told to hang it in a visible place in the village. In the remaining ones (“public information”), a facilitator ensured that three copies of the poster announcing the cards and beneficiary list were hung in each hamlet in the village; they also played a pre-recorded message about the cards on the mosque loudspeaker. This public information campaign may have had two types of effects: it could have increased households’ information and it could have increased households’ higher-order beliefs about what other households knew.
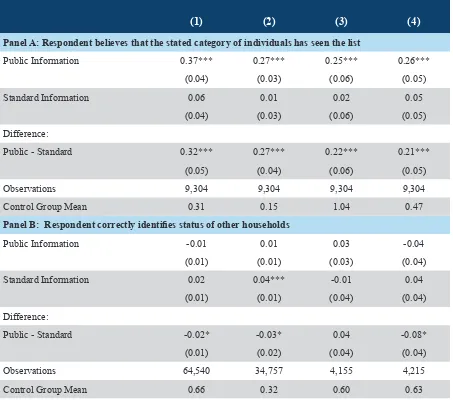
Table 5A begins by examining the impact on whether households had seen the beneficiary list. In Panel A, for each of four key demographic groups (eligible, non-eligible, village officials, and informal leaders), we regress a dummy variable that indicates whether the respondent reports having seen the beneficiary list on dummies variables for the cards with standard information and the cards with the public information campaign. The “standard” card treatment did not significantly increase reports of having seen the list across any of the demographic categories. In contrast, the “public information” treatment greatly increased access: the number of eligible households who had seen it nearly tripled relative to no cards (from 7 to 21 percent in Column 1) and was 12 percentage points higher than in the standard approach. Ineligibles were 12 percentage points more likely to see it in the public versus the standard approach (Column 2), and village leaders were 14 percentage points more likely (Column 3).23
The public information increased knowledge of one’s own eligibility status (Table 5A, Panel B). With no cards, 30 percent of eligible households can correctly identify their status; those in villages with just cards are five percentage points more likely to correctly identify their status relative to no cards (Column 1 of Panel B). With the additional public information, they are eight percentage points more likely to do so relative to just the card alone—this is a 43 percent increase in knowledge relative to no cards and about a 23 percent increase relative to the standard card approach. With just the cards, ineligibles were no more likely to know their status than under no cards, but they were nine percentage points (or 25 percent) more likely to know it under public information (Column 2).
The second way the public treatment could operate was by changing people’s beliefs about others’ access to information (i.e. higher order beliefs).24 This may be important if challenges to authority
feature strategic complementarities: a village head may be able to retaliate against a lone individual, but it may be harder to retaliate against a group. In the language of the model, the per-person cost may be decreasing in the number of people who complain. A villager deciding whether to challenge a village head may therefore be more likely to do so if he can coordinate with others. However, doing this requires not just knowledge about what you are entitled to, but also confidence that everyone else knows more or less what they are entitled to as well (Chwe 2001).
To test whether higher order beliefs changed, in Table 5B, Panel A, we ask all survey respondents how likely members of each of the four demographic groups have seen the list, where 0 corresponds to “have not seen the list” and 3 corresponds to “most have seen it.” Individuals under public information were more likely to believe that others had seen the list, whereas individuals under standard information were
no more likely to report that any type of individual had seen it. However, despite the fact that more people have seen the list, with everyone believing that everyone has more information, respondents were no more likely to correctly identify other people’s status in public information than under the control, and in fact, were more likely to get it wrong in public relative to standard information (Panel B of Table 5B).25
With respect to the model, one can interpret the public information treatment as potentially affecting three things. First, the information set of eligible households improved (i.e. either Be increased, Δe
decreased, or both). Second, the information set of ineligible households improved (i.e. Bn decreased,
Δn decreased, or both). Third, if common knowledge reduced the cost of complaining (e.g. because
it is easier to coordinate), then C went down. We show in Appendix 2 (Result 4) that under plausible
assumptions, improving everyone’s information and reducing C should lead to an increase in the amount
received by the eligible and a reduction in their complaints. The impact on ineligible is theoretically ambiguous. In Appendix 3, we provide a numerical example where everyone’s information improves,
C goes down, and as a consequence, eligible receive more, complain less, and the opposite happens for
the ineligible.
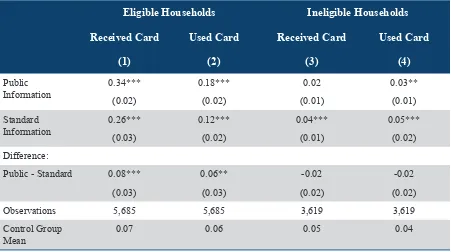
Tables 6A and 6B examine the impact of the additional information on program outcomes. Eligible households were both more likely to receive their card and use them under public information, with no change for ineligible households (Table 6A). The magnitude of these differences for the eligible is large: they were 24 percent more likely to have received a card and 33 percent more likely to use it than under the standard socialization. Addresses in rural areas are difficult to find, and so the post-office relies on local leaders for help in locating households; the fact that beneficiaries were more likely to receive the card in the public information treatment suggests that without public knowledge, village leaders were able to block cards to maintain their rents, but were less able to do so once information about the cards was publically provided.
24 Specifically, we test for whether respondents of type X believe that respondents of type Y have seen the list of beneficiaries, for all X and Y of eligible households, ineligible households, formal village leaders, and informal leaders. This is technically a second-order belief (i.e. do you believe that Y knows), whereas full common knowledge encompasses all higher-order beliefs (i.e. do you believe that Y knows that you know, and so on), but is the highest-order belief that we were practically able to elicit during a survey. Given that the treatment involved posting the list publicly, and we see results on second-order beliefs, it is likely that we moved towards full common knowledge as well.
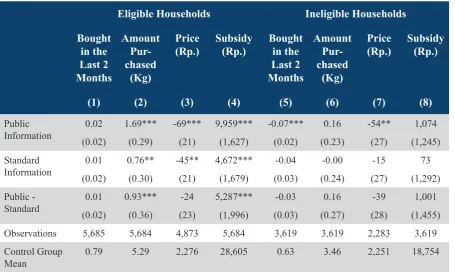
The public information nearly doubled the subsidy that eligible households received relative to the standard information card villages (Table 6B). This difference was driven by both an increase in quantity (Column 2) and a decrease in price (Column 3). Again, there is no difference in quantity for ineligibles, which implies that the gain is less about program resources being diverted from ineligible to eligible, but rather due to a decrease in the theft of rice. Although as discussed above, the impact on complaints and protests is theoretically ambiguous, we also observe more protests and complaints about the beneficiary list from those who do not receive the rice (Appendix Table 13).
One question is whether the public information worked by simply increasing the number of cards distributed, or if it had broader effects beyond the receipt of the cards. To try to distinguish between these two scenarios, we estimate the implied instrumental variables effect of receiving a card in the standard villages and compare this effect to that in the public (see Appendix Table 14).26 If the effect
of the public treatment was simply through increased card receipt, the IV effect should be the similar across both sets of villages. However, this is not the case: the IV estimate of receiving the card on the subsidy is Rp. 32,623 in public, while it is Rp. 17,213 in the standard treatment (p-value of difference is 0.03). This implies that the public information had impacts beyond just handing out more cards.
On net, these results suggest that public information, through its combined effect on what people know about their own rights and on higher-order knowledge, may be an important component of transparency.
B.
Increased General-Purpose Information
The cards contained both individual-specific components – who is eligible for the program – as well as general information (the quantity of rice that eligible households can purchase). Thus, to isolate the role of general-purpose information, we randomly varied whether the copay price (Rp. 1,600 per kg) was printed on the card across villages. In all villages, the official program rules distributed to village leaders contained the official copay, so this is purely an intervention affecting the information received by villagers.
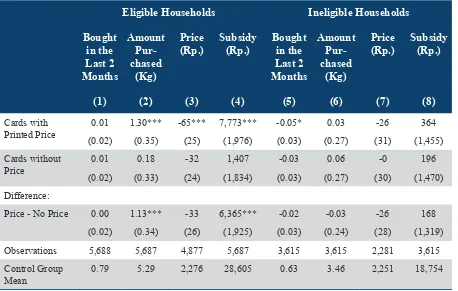
The results are provided in Table 7.27 Eligible households in the villages where the official price was
printed on the card received a much larger increase in subsidy than in villages where it was not. The difference is primarily through quantity, rather than price.28 Specifically, eligible households receive Rp.
6,365 more subsidy per month with the printed price than without; of this Rp. 6,365 increase in subsidy, about 95 percent of the change was due to increase in quantity received (which increased by 1.13 kg
26 The corresponding first stage and reduced form regressions are presented in Appendix Table 15.
27 Appendix Table 16 shows while printing the price did not affect receipt of cards, it did increase the probability cards were used. We also tested the effect of the cards in the standard information versus public information treatments, since the public information may had an effect on people’s perception of price (Appendix Table 17). We find that the effect of printing the price on cards is similar in across both.
compared to cards without price) while only about five percent of the change was due to a reduction in the copay price (which fell by Rp. 33 compared to cards without price).29
From the perspective of bargaining theory, officials and villagers would care only about the total subsidy
X that villagers receive (the product of the price discount and the quantity), not whether it comes from
lower prices or higher quantities. Price information should increase the total subsidy, but the margin through which it does so is arbitrary and depends on which approach is more cost-effective for the local leaders. Increasing quantities may be more cost effective if it allows leaders to better discriminate between eligibles and ineligibles, i.e. there may be more pressure for a uniform price than for equal quantities. Importantly, though, the fact that it affects the quantity dimension is consistent with the bargaining story rather than one of perceived greater central government accountability: if one thought that by printing the price the government was signaling a higher degree of auditing on price, one would expect effects only on price.
C.
Varying who receives a card
In the model, the outcome is dependent not only on your information, but also on the information of others. This is because others’ information affects their bargaining with the village head, which in turn affects the future value of the his job and thus his choices about how much he chooses to placate different types of households.
To examine these issues, we experimentally varied whether cards were mailed out to all eligible households or just to those in the bottom decile (about 32 percent of eligible households). In all villages, the government mailed the complete eligibility list to the local leaders with instructions that all eligible households were allowed to purchase their Raskin allotment.
To examine the impacts, we split our sample of “eligible” households into two groups, those in the bottom 10 percent (who receive cards in all card treatment villages) and other eligible households (who do not receive cards where cards are mailed only to the bottom 10, but receive cards when they are mailed to all eligible households). We regress each outcome on indicator variables for “cards to the bottom decile” and “cards to all,” and thus the coefficients reflect differences from the “no card” villages. Table 8 provides these findings for each of the three categories of households.30
Providing cards to just the bottom decile did not change the allocation to these households relative to villages in which all households received cards: there was no difference in propensity to buy, amount purchased, price or subsidy for those in the bottom percentile across the two types of villages (Columns 1-4 of Table 8).
29 Since price is only available conditional on buying Raskin, the sample of people reporting prices may change in response to the treatment. Thus, we also report regressions on the minimum and maximum price reported by any of our respondents in the village. Appendix Table 18 suggests that, relative to pure controls, the cards with printed price reduce the maximum printed price in the village by about Rp. 117, or about 12 percent of the control group levels of price markups above the official Rp. 1,600 copay price.