Numerical modelling of mud volcanoes and their £ows using
constraints from the Gulf of Cadiz
Bramley J. Murton
, Juliet Biggs
1Southampton Oceanography Centre, Empress Dock, Southampton SO14 3ZH, UK
Received 15June 2001; accepted 5November 2002
Abstract
It is estimated that the total number of submarine mud volcanoes is between 1000 and 100 000. Because many are associated with greenhouse gases, such as methane, it is argued that the global flux of these gases to the atmosphere from the world’s terrestrial and submarine mud volcanoes is highly significant. Clues to the processes forming submarine mud volcanoes can be found in variations to their height, shape, surface morphology, physical properties and internal structure. A model of isostatic compensation between the mud column and the sediment overlying the mud source is used to predict a depth to the mud reservoir beneath mud volcanoes. Once erupted, the general behaviour of an individual mud flow can be described and predicted using a viscous gravity-current model. The model shows that conical-shaped mud volcanoes comprise multiple, superimposed radial flows in which the thickness, eruption rate and speed of individual mud flows strongly depends on the viscosity, density and over-pressure of the erupted mud. Using these parameters, the model predicts the lowermost flows will be the oldest, thickest and have the greatest length of run-out while the uppermost flows will be the youngest, thinnest and shortest. This model is in contrast to more traditional models of stratiform mud volcano construction in which younger flows progressively bury older ones and travel furthest from the summit. Applying the model to the two mud volcanoes studied in the Gulf of Cadiz, quantitative estimates are derived for the depths to mud sources, exit and flow velocities, eruption duration and volume fluxes, flow thickness and conduit radii. For example, with an average kinematic viscosity of 1.5 m2s31for the erupted mud, a density of 1.8U103kg m33and a thickness for the youngest flows of about 0.5m, the model predicts a lowermost flow thickness of 3.6 m, an average eruption duration of 7 h and a conduit radius of about 9 m. To construct a conical-shaped mud volcano of 260 m height, similar to those studied in the Gulf of Cadiz, is estimated to require a mud source at 4.6 km depth and a total of at least 100 individually erupted flows. 7 2002 Elsevier Science B.V. All rights reserved.
Keywords: mud volcanoes; numerical modelling; Gulf of Cadiz
1. Introduction
Submarine mud volcanoes, ranging in size be-tween 50 cm and 800 m high, occur world-wide on continental shelves, slopes and in the abyssal parts of inland seas. It is estimated that total number of submarine mud volcanoes is between
0025-3227 / 02 / $ ^ see front matter 7 2002 Elsevier Science B.V. All rights reserved. doi:10.1016/S0025-3227(02)00690-4
1 Present address: Department of Earth Sciences, University
of Cambridge, Downing Street, Cambridge CB2 3EA, UK. * Corresponding author. Fax: +44-1703-596554.
E-mail addresses :[email protected] (B.J. Murton),[email protected](B.J. Murton).
1000 and 100 000 (Milkov, 2000). Two major pro-cesses are identi¢ed as forming mud volcanoes : high sedimentation rates and lateral tectonic com-pression, both causing over-pressure of a mobile mud source at depth within the sediment column. Of these processes, two basic mechanisms are thought to further account for the actual eruption of mud on the sea£oor : the unroo¢ng and expo-sure of upward-migrating shale or mud diapirs, and the rise of mobile sediments along crustal pathways that typically include fault planes. In both cases, subsurface £uid migration is consid-ered critical to the formation of mud volcanoes (Milkov, 2000).
Some studies (e.g. from the Barbados accretion-ary complex) have linked the morphology of sub-marine mud volcanoes to di¡erent development stages and processes of mud liquefaction (Limo-nov et al., 1997 ; Lance et al., 1998). Conical-shaped mud volcanoes (‘mud-mounds’ or gry-phons), which do not have any central summit ‘mud lakes’ (or salses), are formed by the expul-sion of plastic mud breccia in concentric radial £ows. In contrast, shearing with the feeder con-duit lique¢es the mud leading to the formation of £at-top mud volcanoes (mud-pies) with central ‘mud lakes’ and elongated, radial mud-£ow tongues. In both types, the mud is found to have a plastic behaviour in which its yield strength decreases with increasing porosity. Thix-otropy is associated with high porosity (e.g. more than 70%), which is often related to the dissocia-tion of gas hydrate (Lance et al., 1998).
Often, mud volcanoes are associated with meth-ane £uxes, either as free gas or, depending on ambient temperature and pressure conditions, as gas hydrate (Limonov et al., 1997 ; Cronin et al., 1997). On this basis, Hovland et al. (1997) argue that the global £ux of methane to the atmosphere from the world‘s terrestrial and submarine mud volcanoes is ‘highly signi¢cant’.
The relative di⁄culty in studying submarine mud volcanoes, compared with their terrestrial counterparts, leaves substantial gaps in our knowledge about their modes of formation, the duration and frequency of eruptions and the £uxes of mud and volatile phases from the sub-surface. This paper introduces a simple numerical
model for the formation of conical-shaped mud volcanoes. The model, which is based on sonar data and gravity cores from mud volcanoes in the Gulf of Cadiz, yields estimates for the volume and duration of eruptions for two individual mud volcanoes. Although the model is directly applica-ble to what are described as the ‘conical’ types of mud volcano, it is also a useful way of identifying the ¢rst-order parameters that control mud volca-no formation in general and of estimating the £uxes of £uids from the subsurface.
2. Data
The data used here are from a study of the Gulf of Cadiz, made during cruises TTR-9 and TTR-10 of the R/V Professor Logachev (Fig. 1) and re-ported by J.M. Gardner and others in Kenyon et al. (2000). Speci¢cally, this study focuses on the structure and evolution of two submarine mud volcanoes (named Yuma and Ginsburg in Akhmanov et al., 2000) located in the Gulf of Cadiz.
2.1. Geological setting
Interaction between the Iberian and African plates has resulted in a complex sedimentary and tectonic history for the Gulf of Cadiz and adjacent continental margins, in the eastern North Atlantic. This history includes several episodes of extension and compression since the Triassic (Wil-son et al., 1989; Dewey et al., 1989 ; Srivastava et al., 1990; Maldonado et al., 1999). During the Late Tortonian, westward movement of the Gi-braltar Arc caused the Gulf of Cadiz to form a forearc basin (Maldonado and Comas, 1992). As a result, olistostrome emplacement occurred forming accretionary wedge-type deposition and later deformation (Blankenship, 1992 ; Flynch et al., 1996 ; Maldonado and Somoza, 1997; Maldo-nado et al., 1999). In the Early Pliocene, exten-sional collapse of the basin, coupled with mud and shale diapirism, in£uenced sediment deposi-tion (Rodero et al., 1999 ; Maldonado et al., 1999).
mud volcanism were identi¢ed in the Gulf of Ca-diz region : the Western Moroccan Field, Middle Moroccan Field and Eastern Moroccan Field (Kenyon et al., 2000 ; Gardner, 2001). Here, the focus is on results from two mud volcanoes lo-cated in the Middle Moroccan Field. These were initially identi¢ed from 12-kHz surface-towed side-scan sonar records and subsequently con-¢rmed using deep-tow 30-kHz side-scan sonar, photography, grab samples and gravity cores (Kenyon et al., 2000). Single-channel seismic data reveal that mud volcanism post-dates sedi-mentation and is probably Holocene to Recent in age (Kenyon et al., 2000).
The two mud volcanoes, Yuma and Ginsburg, lie along an approximately NNW^SSE-oriented line. Their centres are separated by V7 km and both volcanoes are roughly 4 km in diameter, with a vertical relief of about 200 m (Fig. 2a,b). The northernmost mud volcano (Yuma) consists of a large, gently domed summit upon which a smaller dome is located. Both domes have con-centric ring structures surrounding their centres. These ring structures have amplitudes of over 1 m and comprise a series of circular ridges and troughs. Gravity cores recovered from the summit of the main dome reveal a thin layer of pelagic
clay and marl (less than 50 cm thick) overlying a thicker sequence of mud breccia, while pelagic sediments are absent from the summit of the smaller dome (Kenyon et al., 2000). The south-ernmost mud volcano (Ginsburg) is of similar proportions to Yuma, but comprises only one conical dome. Like Yuma, the Ginsburg dome is also surrounded by a series of concentric rings of ridges and troughs. Gravity cores from the sum-mit of the Ginsburg volcano recovered a thin layer of pelagic clay and marl overlying mud brec-cia (Kenyon et al., 2000). Both mud volcanoes have convex £anks with maximum gradients of about 1 :10 and are located within moat-like de-pressions, 80^90 m deep, that enclose their outer margins. The origin of the moats is probably sub-sidence, resulting from the eruption of mud from some depth below the volcano, and may therefore be similar to the processes of caldera formation.
Density measurements made on mud breccia immediately after recovery from the summits of both mud volcanoes yield a range from 2.0 to 1.75U103 kg m33. Viscosity measurements were
made for the mud breccia using a capillary meth-od. This involved forcing a known volume of re-cently collected mud breccia through a tube of known diameter under constant pressure.
a
ent volumes were tested and repeated several times. The tests con¢rmed a plastic behaviour for the mud breccia, recognised for mud volcanoes elsewhere (Lance et al., 1998), and yielded a range in kinematic viscosity (X) of 0.9^3 m2 s31. Yield
strength measurements, made by Gardner (per-sonal communication), gave values of about 5U103 N m32 and 8U103 N m32 (i.e. 5and 8
kPa) for mud breccia recovered from Ginsburg and Yuma respectively. Although no free gas was evident in the mud breccia, in situ gas hy-drate crystals were recovered from approximately 1.5m below the summit of Yuma (Kenyon et al., 2000). The presence of free gas, variable £uid con-tent and lithoclasts (up to several centimetres in diameter) within the mud breccia a¡ect its viscos-ity and densviscos-ity. For the purposes of simplifying the modelling, an average density of 1.8U103kg
m33 and homogeneous kinematic viscosity of 1.5
m2 s31 has been assumed for the mud breccia.
Although the accuracy of these parameters is not imperative here, since their variation alters only slightly the details of the results and not the general form of the model, further studies should seek to determine their values more accu-rately.
3. Results and discussion
3.1. An isostatic model
In the following section a simple buoyancy model is developed to relate the maximum height of a mud volcano to the thickness of its overbur-den. Such a buoyancy-driven, or isostatic
equilib-rium, concept is not new and has been applied to igneous volcanic provinces in the past (Vogt, 1974 ; Smith and Cann, 1993). Its application to mud volcanoes, however, is believed to be new and reveals important constraints on the depth of the source of the mud breccia within the sedi-ment pile. These constraints allow, among other things, comparison with seismically determined depths to the mud breccia source as well as indi-cations of the stratigraphic depth of origin for lithoclasts contained within the mud breccia, de-scribed by Sadekov and Ovsyannikov (2000).
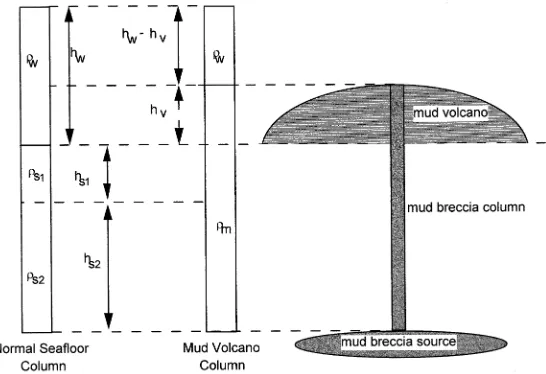
All mud volcanoes require, at some depth with-in the sediment pile beneath them, a reservoir or source of mobile mud. Once a conduit has been opened to the surface, the mud is driven upwards by over-pressure, caused mainly by the density and weight of the overburden. Mineral dehydra-tion reacdehydra-tions, as well as biogenic and petrogenic gas generation, will further contribute to the over-pressure by reducing the density of the £uid mud. Assuming over-pressure is largely a function of overburden, the maximum height a mud volcano can achieve is a balance between the weight of the overburden and the weight of a mud column that extends from the top of the volcano to the mud reservoir. For mud volcanoes that have achieved their maximum height, it can be assumed that this reservoir is located at a depth of isostatic compen-sation. For example, the pressure at the base of the column of mud breccia connecting the reser-voir to the top of the volcano, plus the overlying seawater, must equal the pressure at the base of the sediment pile plus the overlying seawater (see Fig. 3).
Critical parameters in this calculation are the
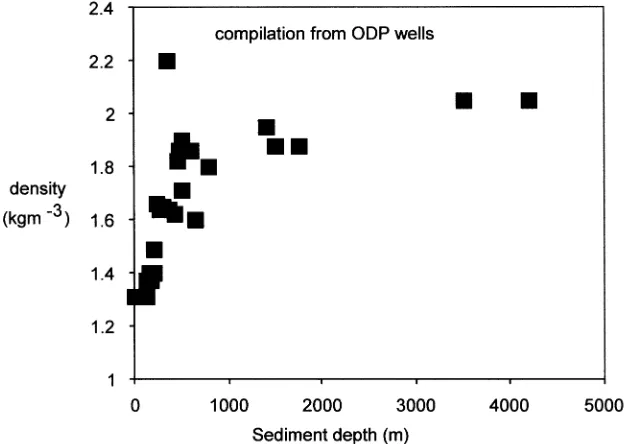
density structure of the mud breccia and the sedi-ment pile through which the mud is erupted. Due to the lack of subsurface well data in the vicinity of the Ginsburg and Yuma mud volcanoes, a compilation of sediment density values from ac-cretionary sedimentary sequences is used, deter-mined from several ODP sites (Mascle et al., 1988 ; Shipley et al., 1995; Karig, 1986; WWW data resources ; http ://www.ldeo.columbia.edu/ BRG/ODP/DATABASE). The sediment density increases from 1.3U103 kg m33 at the surface to
approximately 2U103 kg m33 below a depth of
2000 m subsurface (Fig. 4). For the purposes of this contribution, a simpli¢ed two-layer sediment density model is used. The uppermost 1 km has an average density of 1.65U103 kg m33 and
sedi-ment deeper than 1 km has an average density of 1.9U103 kg m33.
Gravity cores from the summits of both Yuma and Ginsburg mud volcanoes, taken during cruises TTR-9 and TTR-10, found a veneer of pelagic sediment overlying the mud breccia (Ken-yon et al., 2000). This indicates that the mud vol-canoes are presently inactive and have probably reached their maximum height. Assuming this to
be the case, an expression for the thickness of the sediment column above a mud breccia reservoir can be derived by equating the pressures at the bottom of the sediment column to that at the base of a mud volcano column (Fig. 3).
Pressure under normal sea£oor column :
hsabs1þhs2bs2þhwbw ð1Þ
Pressure under mud volcano column :
ðhsþhvÞbmþ ðhw3hvÞbw ð2Þ
Solving for the unknown thickness of the lower sediment column,hs2, yields :
hs2¼ ½hvðbm3bwÞ3hs1ðbs13bmÞ=ðbs23bmÞ ð3Þ
Substituting the values for density and volcano height for Yuma (200 m) and Ginsburg (266 m) intoEq. 3yields a total depth to the mud breccia sources of 4600 m and 4100 m respectively. These results are susceptible to variations in the esti-mates of the density of the sediment column and mud breccia. Increasing the sediment column den-sity, or reducing the mud breccia denden-sity, reduces the calculated depth to the mud breccia source. For example, the density of the mud breccia
Fig. 3. Schematic ¢gure showing the main elements of the isostatic model, comprising the columns of mud breccia, the mud vol-cano conduit, and a two-layered sediment column model, in which:bm= density of mudW1.8U103 kg m33; b
w= density of
sea-waterW1U103 kg m33;b
s1= density of uppermost sedimentW1.65U103 kg m33; b
s2= density of lowermost sedimentW1.9U103
kg m33;h
s1= height of uppermost sediment column (i.e.V1 km); hs2= height of lower sediment column above depth of isostatic
compensation (i.e. depth of mud reservoir ^ to be determined); hw= height of water column above surrounding sea£oor; hv=
may be a¡ected by variations in its volatile or water content. The presence of 10% by volume of a hydrous phase of dissolved gas and water, with a density of 1U103 kg m33, will reduce the
mud breccia density by 4%. This in turn will de-crease the estimated depth to the mud source by 12%.
A consequence of the isostatic model is a pre-diction for the type and location of future erup-tions for a mud volcano that has reached its max-imum height. Unless the mud volcano subsides, future eruptions can only occur if either the mud breccia density decreases, if there is an in-crease in its over-pressure or overburden, or if the eruption occurs from the £anks of the volcano. This prediction is supported by observations of the Yuma mud volcano. Its bathymetric pro¢le (Fig. 2a) shows that the SE side of the main sum-mit is concave, within which a smaller mound is located. This we interpret as evidence for subsi-dence of the summit. Although cores indicate pe-lagic drape for the main summit, and hence evi-dence that eruptions have ceased there, the smaller mound on the top of Yuma does not have pelagic drape. This is interpreted by us as evidence for active parasitic cone growth
follow-ing subsidence, as predicted by the model. The Ginsburg mud volcano does not have any obvious concave features or parasitic cones and summit cores show a pelagic sediment veneer. Hence, although it has probably reached its maximum height, unlike Yuma, Ginsburg probably has not experienced signi¢cant summit subsidence and hence there is no cause for reactivation of mud eruptions. Furthermore, assuming both volcanoes have similar depths to their £uid mud reservoirs, the model predicts that the volcano Yuma, which is 66 m lower than Ginsburg, should be the more active, which appears to be the case.
3.2. An eruption model
Here, a simple model describing the processes controlling the eruption, spread and thickness of individual mud breccia £ows is developed. This model uses the theory describing gravity-driven viscous currents to predict both the shape and internal structure of individual mud volcanoes.
3.2.1. Input parameters
The motion of a £uid, spreading across a solid surface, is determined by the balance of the forces
acting upon it. These various forces are either directed towards accelerating or resisting its mo-tion. In the case of erupting mud £ows, the major force of acceleration is gravity, resulting from density di¡erences between the £ow and its sur-rounding £uid (in this case mud and seawater). The retarding forces are the £ow’s inertia, viscos-ity and yield strength. Of these, viscosviscos-ity domi-nates the majority of the £ow’s eruption history with inertia important only at the beginning and yield strength at the end.
The role of gas and £uids in reducing the den-sity of the mud breccia has already been men-tioned. By analogy with magmatic volcanoes, an increased content of such volatiles will also reduce its viscosity. However, unlike magmatic lavas that can degas as they erupt, the presence of stable gas hydrates on mud breccia recovered from the sum-mits of the two submarine mud volcanoes consid-ered here provides little opportunity for degas-sing. Therefore, in the absence of evidence to the contrary, we have assumed the erupting mud £ows have constant viscosity. The measurements of the viscosity of the mud breccia include its yield strength. However, the yield strength of the mud breccia only becomes dominant at the outer boundary conditions of the £ow (i.e. when the £ow velocity tends towards zero), when grav-ity-induced stresses within the £ow tend towards the value of the shear strength. Yet the evidence that the mud £ows support an elevated volcano structure implies an increase in shear strength with time, possibly by dewatering of £ows during increasing burial beneath subsequent deposits.
3.2.2. Viscous-gravity currents : a numerical analogue for mud eruption
To construct this simple model, mud volcanoes are assumed to erupt with a constant volume £ux (Q), from a conduit with a constant diameter, onto a horizontal base. The volume £ux is con-trolled by the buoyancy of the mud and its kine-matic viscosity (X). This produces a radially sym-metric, laminar £ow, whose properties are uniform at a given radius and time. In the case of a gravity-driven current, such as that formed during eruption of a mud volcano, the erupted material (with a densityb) is denser that the
am-bient £uid (with a density ba, where bsba).
Therefore, the erupted mud spreads and £ows across the sea£oor. The £ow is driven by its den-sity contrast with seawater, which is usually ex-pressed in terms of ‘reduced gravity’, gP, where
g0¼gvb=b where : ðvb¼b
3baÞ ð4Þ
Conversely, the £ow is retarded by viscous drag (its kinematic viscosity, X) and also by its iner-tia, provided the discharge Froude number is sub-critical, i.e. :
Ui=ðg0h
iÞ1=261 ð5Þ
whereUiis the horizontal in£ow velocity andhi
is the depth or thickness of the initial £ow. Three main forces act on a viscous gravity £ow : buoyancy, viscosity and inertia (Didden and Max-worthy, 1982). The magnitude of these forces varies as a function of time (t). During its initia-tion, inertia is the dominant retarding force acting on a gravity current. The duration of this initial period (ti) is given by:
ti¼ ðQ=g0XÞ1=2 ð6Þ
The duration of the initial condition (ti) can be
quanti¢ed, providing there is an estimate of the volume £ux of the mud breccia as it initially erupts. To estimate this, the £ow through the vol-cano’s conduit is treated as forced viscous £uid £ow through a capillary. Assuming the driving force is a result of the pressure di¡erence between the bottom of the mud breccia column and the bottom of the sediment column and the retarding forces are dominated by viscous drag, Eq. 7 can be applied to describe the volume £ow (Q) through the conduit :
Q¼PZr4=8lR ð7Þ
wherePis the driving pressure,lis the length of the conduit (in this case the height of the initial mud breccia column), r is the average radius of the conduit, andRis the dynamic viscosity of the mud breccia.
column. At this stage, the volcano has not yet formed any elevated structure at the surface. Thus the driving force is approximately equivalent to the pressure di¡erence between the base of a column of mud breccia and the column of sedi-ment, both equivalent in height to the depth of the mud source, as described by Eqs. 1 and 2. Using the Ginsburg mud volcano as an example, with an estimated eruptive column length of 4600 m, the resulting driving pressure is 2.12U106 N
m32 (e.g. 2.12U103 kPa).
Although none of the data for Ginsburg give a clear indication of the radius of the conduit, its bathymetric pro¢le shows a gently domed top with a radius of 100 m providing us with a max-imum dimension. Taking the dynamic viscosity, R, measured from the mud breccia as 3000 kg m31 and a range of possible conduit radii yields
the £ow rate (Q) (fromEq. 7) and the duration of the inertia-dominated £ow (ti) (fromEq. 6); e.g. :
Ifr¼100 m; thenQ¼6U106m3s31; ti¼950 s Ifr¼10 m; thenQ¼6U102m3s31; ti¼9:5 s Ifr¼1 m; thenQ¼0:06 m3s31; ti¼0:09 s
Thus the duration of inertial retardation of mud £ow eruption is unlikely to be signi¢cant for those £ows with an eruption history lasting several hours. However, because there are no di-rect measurements of £ow velocity, at this stage it can only be assumed that inertial retardation is insigni¢cant. This assumption is revisited in a lat-er section, whlat-ere it is argued that £ow duration is of the order of several hours.
For the period following inertial retardation, (i.e. when tsti), the dominant retarding force
acting on an individual mud £ow is viscous drag. In this regime, the thickness at the eruptive centre, h0, and the radius of the £ow, R, can be
described by the following expressions (after Did-den and Maxworthy, 1982):
RWðg0Q3=XÞ1=8t1=2 ð8Þ
h0WðXQ=g0Þ1=4 ð9Þ
where the symbolWdenotes only approximate accuracy. Di¡erentiating the radius with respect to time, while assuming a constant volume £ux,
yields an expression for the velocity of the £ow front, U:
UWðg0Q3=XÞ1=8t31=2 ð10Þ
Eqs. 8 and 9can be used to estimate the thick-ness and radius of £ows during individual erup-tions. Cores recovered from the mud volcanoes provide evidence for several layers of erupted mud, indicating a history of activity involving dis-crete episodes of eruption (Kenyon et al., 2000). Eq. 8 shows that the run-out radius of a £ow increases with the square root of time while Eq. 9shows that the central thickness of an individual mud £ow is independent of time. Hence, assuming a constant volume £ux during eruption, the veloc-ity of a £ow front (derived from Eq. 10) de-creases, maintaining a constant £ow thickness. This shows that the thickness of a £ow at any given run-out radius is independent of time and equal to the thickness of the £ow at its centre. The product of such a model is a roughly cylin-drical £ow that spreads radially outwards from its central point of eruption.
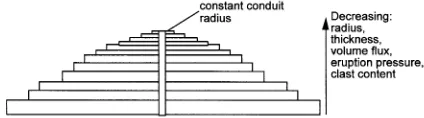
During construction of a mud volcano, subse-quent eruptions are superimposed upon preceding ones, building a layered structure. The increasing height of the volcano reduces the driving pressure for each new eruption, which in turn reduces the volume £ux, resulting in subsequent £ows being thinner and spreading more slowly than their predecessor (i.e. from Eqs. 8, 9 and 10). Because the surface of each £ow is horizontal, subsequent new £ows are extruded in an identical way to their predecessors. This model predicts an ideal-ised structure for conical mud volcanoes as one composed of multiple, laminar £ows, stacked ver-tically, each decreasing in thickness and radius
with height (Fig. 5). However, should the dura-tion of a new £ow exceed its predecessor’s it will reach the edge of the underlying £ow and cascade down the £ank of the volcano. Such over-spills have a distinctive appearance on side-scan sonar records, forming elongated radial £ows. A possi-ble example of this is seen on the NW £ank of Ginsburg (Fig. 2).
3.3. Applications to Ginsburg and Yuma
To determine better the idealised evolution of a mud volcano, as described by the model, con-straints on the volume £ux (Q) during mud erup-tions are needed. As there are no direct observa-tions of these, values of Qmust be inferred from observations such as £ow thickness (e.g. by sub-stituting these parameters into Eq. 9). Gravity cores from the summit of the mud volcanoes re-covered several erupted mud units with an aver-age thickness of 0.5m (Kenyon et al., 2000). Eq. 9 yields an estimated volume £ux of 0.18 m3 s31
from a £ow thickness of 0.5m. Such a low value is expected since these £ows were recovered from the summit of the volcano (i.e. near its maximum potential height). An estimate for the conduit ra-dius can derived from Eq. 7 by substituting a reduced value for the driving pressure (P) and an extended length of the conduit (l), consistent with eruption at the summit. Using the derived value for the volume £ux for the 0.5m thick £ows at the summit, Pat 1% of its value at the base of the volcano and l equal to hv+hs (i.e. 4600+266
m), Eq. 7 yields a conduit radius of 9.4 m. Note thatEq. 7, when solved for the radius of the con-duit, yields a result that is dependent only on the 1/4 power of the products of viscosity, conduit length, volume £ux, and driving pressure, and is therefore relatively insensitive to uncertainties in these parameters. For example, the estimated ra-dius varies by only 16% for a 100% uncertainty in the volume £ux or driving pressure.
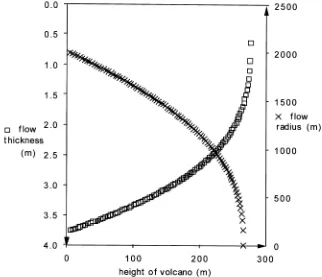
Assuming the conduit radius is of similar di-mensions throughout the height of the volcano, then the volume £ux during each subsequent eruption decreases linearly with increasing height. This in turn results in decreasing £ow thickness with height and, for a similar duration of
erup-tion, decreasing £ow radii (Fig. 6). With the superposition of subsequent £ows, the volcano will evolve a convex, dome-like pro¢le (Fig. 7) similar to the pro¢les presented by Yuma and Ginsburg.
Because we do not known the duration of the periods of inactivity, it is impossible to estimate the time for the construction of mud volcanoes like Yuma or Ginsburg. However, the model can be used to estimate the duration of individual £ow events. For example, assuming constant vol-ume £ux for its duration, Eq. 7 yields a volume £ux for the initial eruptions forming the base of the volcano of about 472 m3 s31 (i.e. with a
con-duit radius of 9.4 m).Eq. 9then yields a thickness for this £ow of 3.5m. Side-scan images of the volcanoes show basal radii of about 2 km. From Eq. 8, substituting this value for the £ow radius (R) and solving for time (t) yields a duration for the run-out of the £ow of about 7 h. The con-struction of Ginsburg requires an estimated 100 individual £ows, ranging in thickness from 3.5m at its base to 0.5m at its summit. The estimate of the number of £ows will increase if there is post-eruption subsidence, £attening or spreading of the volcano.
3.3.1. On the origin of the concentric ring structures
and viscous slumping than the younger, innermost rings. These predictions are supported by side-scan sonar images of the structures which show the rings toward the centre are more clearly de-¢ned than the outer rings (i.e. which appear in-creasingly obscured and disturbed).
It is possible to explore further the origin of the concentric ring structures by comparing their am-plitude with the predicted thickness of £ows at the position occupied by the rings on the £anks of the volcanoes. If the rings are tectonic structures, then there is no reason why they should be at a scale similar to the £ows. However, any similarity in scale does not prove that the features are £ows, but does provide circumstantial evidence that they could be.
For the Ginsburg mud volcano, seven clearly identi¢able rings are present with radii of between
480 m and 580 m and at heights on the £anks of the volcano of between 125m and 219 m. From their acoustic shadow lengths (Fig. 2a,b), an aver-age individual £ow thickness of 1.3 R 1 m is esti-mated. For the Yuma mud volcano, six rings are visible between 420 m and 515 m in radius. Again, similar individual ring amplitudes of about 1.6 R 1 m are estimated. Eq. 7 yields a volume £ux (Q) for £ows erupted at an average height of 172 m on the volcano’s £ank (assuming a calculated con-duit radius of 9.4 m). Substituting the estimate of QintoEq. 9yields a £ow thickness of 2.5R 1.3 m, at a height on the £anks of the volcano of about 172 m. Thus both the modelled thickness of the £ows and the observed amplitude for the concen-tric ring structures are within error of one anoth-er. Although this does not prove the origin of the rings, it leaves open the possibility that they could
be the fronts of circular £ows as predicted by the model.
3.3.2. Revised estimates for inertially dominated £ow and the consequences of decreasing exit velocity
The calculated estimates for conduit radii, driv-ing pressure and mud breccia volume £ux can now be used to re-assess the preliminary values of ti, the duration of the initial, inertially
domi-nated £ow regime. Estimates of volume £ux of between 0.2 m3 s31 and 470 m3 s31 have been
derived from the model which, when substituted into Eq. 6, give values of ti of 0.25s and 12 s
respectively. By comparison with the calculated individual £ow duration of about 7 h,ti is
negli-gible, consistent with our initial assumption. The data from the mud volcano Ginsburg in-dicate an initial volume £ux of 470 m3 s31 at the
base of the volcano (i.e. at the moment the ¢rst mud £ows started erupting). Since the volume £ux (Q) and exit velocity (ve) are linked only by the
conduit area (A), these ¢gures can be used to determine the vertical velocity of the mud breccia as it exits the top of the conduit, e.g. :
Q¼veA ð11Þ
ve¼Q=Zr2 ð12Þ
Using the calculated conduit radius (r) of 9.4 m yields a value for the vertical ascent rate (ve) of
mud breccia during its initial eruption at the base of the volcano of 1.6 m s31. This value decreases
to 6U1034 m s31 for eruptions at the summit,
where volume £uxes are calculated to be as little as 0.2 m3 s31. A potential consequence of this
decrease in ascent rate is a tendency for the mud breccia to fractionate, with larger lithoclasts within the mud being too heavy to be ejected by the slow-moving mud, leading to clogging of the conduit. This will result in eruptions from the summit of mature mud volcanoes, that are near to their maximum height of construction, to be £uid-rich while the oldest £ows, erupted initially in the volcano’s history and now found near the base, will contain large lithoclasts. These predic-tions are easily testable using long piston coring and drilling provided su⁄cient depths of penetra-tion are achievable. Alternatively, high-resolupenetra-tion sub-bottom acoustic pro¢le data may be able to resolve the internal structure of the volcanoes, discriminating £ow thickness variation and £ow superposition sequences.
4. Conclusions
Mud volcanoes are common in ocean settings globally and are probably the result of a variety of tectonic and sedimentary processes. Using nu-merical modelling can gain insight into their for-mation by reducing their physical processes to a number of dominant parameters that describe the maximum height of a mud volcano, the thickness and radii of individual £ows, and the duration and volume £ux for each eruption. Together, these processes are responsible for the ¢rst-order shape of the mud volcano. Here, a model is de-veloped for the formation of conical-shaped mud volcanoes, based on buoyancy-driven, viscously retarded gravity £ows. The simple modelling of these primary physical processes allows a predic-tion to be made of the depth to the mud source, as well as determinations of the £ux of material erupted. Minimum constraints can be placed on the duration of mud £ow eruptions and hence on the construction time of the volcano itself. Impor-tantly, modelling allows an understanding of the key parameters that control mud volcano evolu-tion. Where di¡erent morphologies are encoun-tered, whether they are in the same mud volcano or between di¡erent volcanoes, the model indi-cates which physical conditions are dominant in causing these changes.
Results from the modelling, applied to 260 m high, conical-shaped mud volcanoes in the Gulf of Cadiz, predict their formation from about 100 individual £ows in which the outermost are the oldest and thickest, and successively higher £ows are younger and thinner. Using a model for vis-cous gravity currents, individual eruptions are predicted to last up to 7 h in duration. The con-duit for the mud breccia is calculated to be about 9 m in radius and 4100^4600 m long. The vertical ascent velocity through the conduit decreases as the volcano grows in height, from a maximum of 1.6 m s31 during eruption of the £ows forming
the base of the volcano to 0.2 m s31 at the
sum-mit. As a result, the uppermost £ows, erupted as the volcano reaches its maximum elevation, are predicted to be clast-poor and £uid-rich mud, while those erupted rapidly near the base should contain larger and more abundant lithoclasts. Our
predictions for the internal structure and evolu-tion of mud volcanoes, and the variaevolu-tion in £uid and clast content of £ows, could be tested by coring, drilling and sub-bottom acoustic and seis-mic pro¢ling.
Acknowledgements
We are indebted to Michael Ivanov, Neil Ken-yon, Joan Gardner and Jose¤ Monteiro for helpful discussions concerning the nature of submarine mud volcanism and on speci¢c aspects of this work. Also to the o⁄cers and crew of the R/V Professor Logachev without whom none of the data discussed here would be available. We would also like to thank the reviewers (Norman Sleep, Peter Vogt and one anonymous) for their helpful suggestions towards improving this contribution. During the work, J.B. was supported by a South-ampton Oceanography Centre, Summer School scholarship. B.M. is supported by the Natural Environment Research Council at Southampton Oceanography Centre.
References
Akhmanov, G., Akhmetzhanov, A., Stadnitskaya, A., Kozlo-va, E., Mazurenka, L., Teixeira, F., Sautkin, A., Dixon, D., Ovsyannikov, D., Sadekov, A., Rasul, N., Belenkaya, I., Volakova, Yu., Suslova, E., Goncharov, D., 2000. Mud di-apirism and mud volcanism study: gulf of Cadiz/Moroccan margin. In: Kenyon: N.H., Ivanov, M.K., Akhmetzhanov, A.M., Akhmanov, G.C. (Eds.), Multidisciplinary Study of the Geological Processes on the North East Atlantic and Western Mediterranean Margins. IOC Technical Series 56, UNESCO, pp. 67^71.
Blankenship, C.L., 1992. Structure and palaeogeography of the External betic Cordillera, southern Spain. Mar. Pet. Geol. 9, 256^264.
Cronin, B.T., Ivanov, M.K., Limonov, A.F., Egorov, A., Akh-manov, G.G., Akhmetjanov, A.M., Kozlova, E., 1997. New discoveries of mud volcanoes on the eastern Mediterranean Ridge. J. Geol. Soc. London 154, 173^182.
Dewey, J.F., Helman, M.L., Turco, E., Hutton, D.H.W., Knott, S.D., 1989. Kinematics of the Western Mediterra-nean. In: Coward, M. (Ed.), Alpine Tectonics. Spec. Publ. Geol. Soc. London 45, 265^283.
Flynch, J.A., Bally, A.W., Wu, S., 1996. Emplacement of a passive-margin evaporitic alochthon in the Betic Cordillera of Spain. Geology 24, 67^70.
Gardner, J.M., 2000. Gulf of Cadiz/Moroccan margin, a mud diapirism and mud volcanism study. In: Kenyon, N.H., Ivanov, M.K., Akhmetzhanov, A.M., Akhmanov, G.C. (Eds.), Multidisciplinary Study of the Geological Processes on the North East Atlantic and Western Mediterranean Margins. IOC Technical Series 56, UNESCO, pp. 56^67. Gardner, J.M., 2001. Mud volcanoes revealed and sampled on
the Western Moroccan continental margin. Geophys. Res. Lett. 28, 339^342.
Hovland, M., Hill, A., Stokes, D., 1997. The structure and geomorphology of the Dashgil mud volcano, Azerbaijan. Geomorphology 21, 1^15.
Karig, D.E., 1986. Physical properties and mechanical state of accreted sediments in the Nankai Trough, S.W. Japan. In: Moore, J.C. (Ed.), Structural Fabrics in Deep Sea Drilling Project Cores from Forearcs. Mem. Geol. Soc. Am. 66, 117^ 133.
Kenyon, N.H., Ivanov, M.K., Akhmetzhanov, A.M., Akhma-nov, G.C. (Eds.), 2000. Multidisplinary Study of the Geo-logical Processes on the North East Atlantic and Western Mediterranean Margins. IOC Technical Series 56, UNES-CO, 101 pp. plus ¢gures.
Lance, S., Henry, P., Le Pichon, X., Lallemant, S., Chamley, H., Rostek, F., Faugeres, J.C., Gonthier, E., Olu, K., 1998. Submersible study of mud volcanoes seaward of the Barba-dos accretionary wedge sedimentology, structure and rheol-ogy. Mar. Geol. 145, 255^292.
Limonov, A.F., van Weering, T.C.E., Kenyon, N.H., Ivanov, M.K., Meisner, L.B., 1997. Seabed morphology and gas venting in the Black Sea mud volcano area: Observations with the MAK-1 deep-tow side-scan sonar and bottom pro-¢ler. Mar. Geol. 137, 121^136.
Maldonado, A., Comas, M.C., 1992. Geology and geophysics of the Alboran Sea: An introduction. Geo-Mar. Lett. 12, 61^65.
Maldonado, A., Somoza, L., 1997. Al zona de fractura
Azores-Gibraltar y las cadenas beticas en el Golfo de Cadiz. Evolucion Geologica. 2nd Congress Margen Continental Iberico Atlantico, Abstract. University of Cadiz, Cadiz, pp. 71^72.
Maldonado, A., Somoza, L., Pallare¤s, L., 1999. The Betic oro-gen and the Iberian-African plate boundary in the Gulf of Cadiz; geological evolution (central North Atlantic). Mar. Geol. 155, 9^43.
Mascle, A., Moore, J.C., Taylor, E. et al., 1988. Proc. ODP Init. Rep. 110.
Milkov, A.V., 2000. Worldwide distribution of submarine mud volcanoes and associated gas hydrates. Mar. Geol. 167, 29^ 42.
Rodero, J., Pallere¤s, L., Maldonado, A., 1999. Late Quater-nary seismic facies of the Gulf of Cadiz Spanish continen-tal margin: depositional processes in£uenced by sealevel changes and tectonic controls. Mar. Geol. 155, 13^56. Sadekov, A.Y., Ovsyannikov, D.O., 2000. Age of rock clasts
from the Yuma and mud volcano breccia on the basis of foraminiferal study (Gulf of Cadiz, NE Atlantic). In: Geo-logical Processes on European Continental Margins (TTR-9 Post-Cruise Conference), Abstracts. University of Granada, Granada.
Shipley, T., Ogawa, Y., Blum, P. et al., 1995. Proc. ODP Init. Rep. 156.
Smith, D.K., Cann, J.R., 1993. Building the crust at the Mid-Atlantic Ridge. Nature 365, 707^715.
Srivastava, S.P., Schouten, H., Roest, W.R., Klitgord, K.D., Kovacs, L.C., Veroef, J., Macnab, R., 1990. Iberian plate kinematics; a jumping plate boundary between Eurasia and Africa. Nature 344, 756^759.
Vogt, P.R., 1974. Volcano height and plate tectonics. Earth Planet. Sci. Lett. 23, 337^348.