STATISTIK
JAMINAN SOSIAL
INDONESIA
STATISTICS OF
INDONESIA’S SOCIAL
SECURITY
halaman ini sengaja dikosongkan
B
uku Statistik Jaminan Sosial Indonesia merupakan media publikasi yang menyajikan data dan informasi mengenai pengelolaan Jaminan Sosial di Indonesia yang dilakukan oleh dua lembaga, yaitu Badan Penyelenggara Jaminan Sosial Ketenagakerjaan dan Badan Penyelenggara Jaminan Sosial Kesehatan.Data dan informasi yang disajikan dalam Buku ini adalah terkait kinerja keuangan dan non-keuangan yang dikelola oleh kedua Badan Penyelenggara Jaminan Sosial (BPJS) dan program-program jaminan sosial yang diselenggarakan oleh masing-masing BPJS Ketenagakerjaan dan BPJS Kesehatan.
Buku Statistik Jaminan Sosial Indonesia ini merupakan publikasi pertama kali untuk data dan informasi terkait pengelolaan jaminan sosial di Indonesia. Selanjutnya, OJK akan menerbitkan Buku Statistik Jaminan Sosial Indonesia ini secara tahunan. Adapun data dan informasi yang disajikan dalam Buku ini berasal dari laporan berkala BPJS Ketenagakerjaan dan BPJS Kesehatan yang disampaikan ke OJK.
Kami senantiasa berupaya memastikan kualitas data pada buku ini. Namun demikian, apabila masih ditemukan kekurangakuratan data dan informasi yang disajikan dalam buku ini, maka kami akan melakukan revisi yang diperlukan
Akhir kata, kami berharap data dan informasi yang disaji kan di dalam buku ini dapat memberikan manfaat yang optimal bagi para pengguna. Buku ini dapat diakses melalui situs resmi Otoritas Jasa Keuangan (OJK) dengan alamat www.ojk.go.id.
T
he Statistics of Social Security in Indonesia is apublication media that provides data and information on the management of Social Security in Indonesia which is carried out by two institutions, namely the Employment Social Security Administration Agency (BPJS Ketenagakerjaan) and the Health Social Security Administration Agency (BPJS Kesehatan).
The data and information presented in this book are related to financial and non-financial performance managed by the two Social Security Administration Agencies and the social security programs administered by the respective BPJS Ketenagakerjaan and BPJS Kesehatan.
The Statistics of Social Security Indonesia is the first publication of data and information related to social security management in Indonesia. Furthermore, OJK will publish this Indonesian Social Security Statistics Book annually. The data and information presented in this book come from periodic reports of BPJS Ketenagakerjaan and BPJS Kesehatan that are submitted to FSA.
We endeavors to ensure the quality of data of this book. However, if in the future are found inaccuracy on data and information presented in this book, then we will make any necessary revisions.
Finally, we hope that the data and information provided in this book can provide optimal benefits for users. This book can be accessed through the official website of the Financial Services Authority (OJK) at the address www.ojk.go.id.
Foreword
Kata Pengantar
Jakarta, November 2020 Otoritas Jasa Keuangan
DAFTAR ISI
TABLE OF CONTENTS
Kata Pengantar — 3 Foreword Daftar Isi — 4 Table of Contents Daftar Tabel — 6 List of Tables Daftar Grafik — 6 List of Graph Daftar Gambar — 8 List of Figures Daftar Lampiran — 8 List of AppendixesIkhtisar Jaminan Sosial di Indonesia — 9
Overview of Social Security in Indonesia
A. Statistik Jaminan Sosial Ketenagakerjaan — 13
Statistic of Employment Social Security
A1. BPJS Ketenagakerjaan (Badan) — 14
BPJS Ketenagakerjaan (Agency)
A1.1. Laporan Posisi Keuangan — 14
Financial Statements
A1.2. Pertumbuhan Investasi — 15
Investment Growth
A1.3. Indikator Rasio Keuangan — 16
Financial Ratios Indicator
A2. Program Jaminan Kecelakaan Kerja (JKK) — 18
Workplace Accident Benefit Program (JKK)
A2.1. Laporan Posisi Keuangan — 18
Financial Statements
A2.2. Pertumbuhan Investasi — 19
Investment Growth
A2.3. Kepesertaan — 20
Participants
A2.4. Pendapatan Iuran dan Klaim — 21
Contribution Income and Claim
A3. Program Jaminan Kematian (JKM) — 22
Death Benefit Program (JKM)
A3.1. Laporan Posisi Keuangan — 22
Financial Statements
A3.2. Pertumbuhan Investasi — 23
Investment Growth
A3.3. Kepesertaan — 24
Participants
A3.4. Pendapatan Iuran dan Klaim — 24
DAFTAR ISI
TABLE OF CONTENTS
A4. Program Jaminan Hari Tua (JHT) — 26
Old-age Benefit Program (JHT)
A4.1. Laporan Posisi Keuangan — 26
Financial Statements
A4.2. Pertumbuhan Investasi — 27
Investment Growth
A4.3. Kepesertaan — 28
Participants
A4.4. Pendapatan Iuran dan Klaim — 29
Contribution Income and Claim
A5. Program Jaminan Pensiun (JP) — 30
Pension Benefit Program (JP)
A5.1. Laporan Posisi Keuangan — 30
Financial Statements
A5.2. Pertumbuhan Investasi — 31
Investment Growth
A5.3. Kepesertaan — 32
Participants
A5.4. Pendapatan Iuran dan Klaim — 33
Contribution Income and Claim
B. Statistik Jaminan Sosial Kesehatan — 35
Statistic of Health Social Security
B1. BPJS Kesehatan (Badan) — 36
BPJS Kesehatan (Agency)
B1.1. Laporan Kinerja Keuangan — 36
Financial Performance Report
B1.3. Indikator Rasio-Rasio Keuangan — 38
Financial Ratios Indicator
B2. Program Jaminan Kesehatan (JKN) — 39
Health Insurance ProgramProgram (JKN)
B2.1. Laporan Posisi Keuangan — 39
Financial Statements
B2.2. Pertumbuhan Investasi — 41
Investment Growth
B2.3. Laporan Aktivitas Program Jaminan Kesehatan — 42
Health Program Activity Report
B2.4. Indikator Rasio-Rasio Keuangan Program Jaminan Kesehatan — 44
Health Program’s Financial Ratios Indicator
B2.5. Peserta Program Jaminan Kesehatan — 45
Health Program’s Participants
Lampiran — 47
Appendix
Glosarium — 67
Tabel 01. Laporan Posisi Keuangan BPJS Ketenagakerjaan (Badan) 2015 – 2019
Table 01. Financial Statements of BPJS Ketenagakerjaan (Agency) In 2015 – 2019
Tabel 02. Rasio Keuangan BPJS Ketenagakerjaan (Badan) 2015 – 2019
Table 02. Financial Ratio of BPJS Ketenagakerjaan (Agency) In 2015 – 2019
Tabel 03. Laporan Posisi Keuangan Program Jaminan Kecelakaan Kerja (JKK) 2015 – 2019
Table 03. Financial Statements of Work Accident Insurance Program (JKK) In 2015 – 2019
Tabel 04. Kepesertaan Program JKK 2015 – 2019
Table 04. Participants of JKK Program In 2015 – 2019
Tabel 05. Laporan Posisi Keuangan Program Jaminan Kematian (JKM) 2015 – 2019
Table 05. Financial Statements of Death Benefit Program (JKM) In 2015 – 2019
Tabel 06. Laporan Posisi Keuangan Program Jaminan Hari Tua (JHT) 2015 – 2019
Table 06. Financial Statements of Old Age Benefit Program (JHT) In 2015 – 2019
Tabel 07. Kepesertaan Program JHT 2015 – 2019
Table 07. Participants of JHT Program In 2015 – 2019
Tabel 08. Laporan Posisi Keuangan Program Jaminan Pensiun (JP) 2015 – 2019
Table 08. Financial Statements of Pension Benefit Program (JP) In 2015 – 2019
Tabel 09. Kepesertaan Program JP 2015 – 2019
Table 09. Participants of JP Program In 2015 – 2019
Tabel 10. Rasio-Rasio Keuangan BPJS Kesehatan Periode 2015 – 2019
Table 10. BPJS Kesehatan Financial Ratios 2015 – 2019 Period
Tabel 11. Laporan Posisi Keuangan DJS Kesehatan
Table 11. Financial Statements of DJS Kesehatan
Tabel 12. Pertumbuhan Investasi Program Jaminan Kesehatan
Table 12. Growth of Healthcare Benefit Program Investment
Tabel 13. Laporan Aktivitas Program DJS Kesehatan
Table 13. Healthcare Benefit Program Activity Report
DAFTAR TABEL
LIST OF TABLES
DAFTAR GRAFIK
LIST OF GRAPH
Grafik 01. Perbandingan Aset, Liabialitas, dan Aset Neto BPJS Ketenagakerjaan (Badan) 2015 – 2019
Graph 01. Comparison of Assets, Liabilities and Net Assets of BPJS Ketenagakerjaan (Agency) 2015 – 2019
Grafik 02. Porsi Portofolio Investasi BPJS Ketenagakerjaan (Badan) 2019
Graph 02. Portion of Investment Portfolio BPJS Ketenagakerjaan (Agency) 2019
Grafik 03. Investasi BPJS Ketenagakerjaan (Badan) 2015 – 2019
Graph 03. Investment of BPJS Ketenagakerjaan (Agency) In 2015 – 2019
Grafik 04. Perbandingan Aset, Liabilitas, dan Aset Neto Program JKK 2015 – 2019
Graph 04. Comparison of Assets, Liabilities and Net Assets of JKK Program 2015 – 2019
Grafik 05. Porsi Portofolio Investasi Program JKK 2019
Graph 05. Portion of Investment Portfolio JKK Program 2019
Grafik 06. Investasi Program JKK 2015 – 2019
Graph 06. Investment of JKK Program In 2015 – 2019
Grafik 07. Porsi Kepesertaan per Segmen Peserta Program JKK 2019 14 17 18 21 22 26 29 30 32 38 39 42 43 15 15 16 19 19 20 20
DAFTAR GRAFiK
LIST OF GRAPH
Grafik 08. Pendapatan Iuran dan Klaim Program JKK 2015 – 2019
Graph 08. Contribution Income and Claim JKK Program in 2015 – 2019
Grafik 09. Perbandingan Aset, Liabialitas, dan Aset Neto Program JKM 2015 – 2019
Graph 09. Comparison of Assets, Liabilities and Net Assets of JKM Program 2015 - 2019
Grafik 10. Porsi Portofolio Investasi Program JKM 2019
Graph 10. Portion of Investment Portfolio JKM Program 2019
Grafik 11. Investasi Program JKM 2015 – 2019
Graph 11. Portfolio of JKM Program In 2015 – 2019
Grafik 12. Pendapatan Iuran dan Klaim Program JKM 2015 – 2019
Graph 12. Contribution Income and Claim JKM Program in 2015 – 2019
Grafik 13. Perbandingan Aset, Liabialitas, dan Aset Neto Program JHT 2015 – 2019
Graph 13. Comparison of Assets, Liabilities and Net Assets of JHT Program 2015 – 2019
Grafik 14. Porsi Portofolio Investasi Program JHT 2019
Graph 14. Portion of Investment Portfolio JHT Program 2019
Grafik 15. Investasi Program JHT 2015 – 2019
Graph 15. Investment of JHT Program In 2015 – 2019
Grafik 16. Porsi Kepesertaan per Segmen Peserta Program JHT 2019
Graph 16. Portion of Participants per Participant Segment JHT Program 2019
Grafik 17. Pendapatan Iuran dan Klaim Program JHT 2015 – 2019
Graph 17. Contribution Income and Claim Activity JHT Program in 2015 – 2019
Grafik 18. Perbandingan Aset, Liabialitas, dan Aset Neto Program JP 2015 – 2019
Graph 18. Comparison of Assets, Liabilities and Net Assets of JP Program 2015 – 2019
Grafik 19. Porsi Portofolio Investasi Program JP 2019
Graph 19. Portion of Investment Portfolio JP Program 2019
Grafik 20. Investasi Program JP 2015 – 2019
Graph 20. Investment of JP Program In 2015 – 2019
Grafik 21. Pendapatan Iuran dan Klaim Program JP 2015 – 2019
Graph 21. Contribution Income and Claim Activity JP Program in 2015 – 2019
Grafik 22. Laporan Posisi Keuangan BPJS Kesehatan Periode 2015 – 2019
Graph 22. BPJS Kesehatan Financial Position Report 2015 – 2019 Period
Grafik 23. Kinerja Keuangan BPJS Kesehatan Periode 2015 – 2019
Graph 23. BPJS Kesehatan Financial Performance 2015 – 2019 Period
Grafik 24. Laporan Posisi Keuangan DJS Kesehatan
Graph 24. DJS Kesehatan Financial Position Report
Grafik 25. Laporan Aktivitas Program DJS Kesehatan
Graph 25. Healthcare Benefit Program Activity Report
Grafik 26. Rasio-Rasio Keuangan Program Jaminan Kesehatan
Graph 26. Healthcare Program’s Financial Ratio
Grafik 27. Jumlah Peserta Program Jaminan Kesehatan
Graph 27. The Number of Healthcare Program’s Participant
Grafik 28. Segmen Peserta Program Jaminan Kesehatan Tahun 2019
Graph 28. Healthcare Program’s Participant Segmentation in 2019
21 23 23 24 25 27 27 28 28 29 31 31 32 33 36 37 40 43 44 45 46
Gambar 01. Program Jaminan Sosial Ketenagakerjaan
Figure 01. Social Security Employement Program
Gambar 02. Pengelolaan Dana BPJS dan Dana Jaminan Sosial menurut UU BPJS
Figure 02. Management of the BPJS Fund and the Social Security Fund according to the BPJS Law
DAFTAR GAMBAR
LIST OF PICTURES
DAFTAR LAMPIRAN
LIST OF APPENDIXES
Lampiran 01. Laporan Posisi Keuangan BPJS Ketenagakerjaan (Badan) 2015 – 2019
Appendix 01. Financial Statements of BPJS Ketenagakerjaan (Agency) In 2015 – 2019
Lampiran 02. Portofolio Investasi BPJS Ketenagakerjaan (Badan) 2015 – 2019
Appendix 02. Investment Portfolio of BPJS Ketenagakerjaan (Agency) In 2015 – 2019
Lampiran 03. Laporan Posisi Keuangan Program Jaminan Kecelakaan Kerja (JKK) 2015 – 2019
Appendix 03. Financial Statements of Work Accident Insurance Program (JKK) In 2015 – 2019
Lampiran 04. Portofolio Investasi Program JKK 2015 – 2019
Appendix 04. Investment Portfolio of JKK Program In 2015 – 2019
Lampiran 05. Pendapatan Iuran dan Klaim Program JKK 2015 – 2019
Appendix 05. Contribution Income and Claim of JKK Program In 2015 – 2019
Lampiran 06. Laporan Posisi Keuangan Program Jaminan Kematian (JKM) 2015 – 2019
Appendix 06. Financial Statements of Death Benefit Program (JKM) In 2015 – 2019
Lampiran 07. Portofolio Investasi Program JKM 2015 – 2019
Appendix 07. Investment Portfolio of JKM Program In 2015 – 2019
Lampiran 08. Pendapatan Iuran dan Klaim Program JKM 2015 – 2019
Appendix 08. Contribution Income and Claim of JKM Program In 2015 – 2019
Lampiran 09. Laporan Posisi Keuangan Program Jaminan Hari Tua (JHT) 2015 – 2019
Appendix 09. Financial Statements of Old Age Benefit Program (JHT) In 2015 – 2019
Lampiran 10. Portofolio Investasi Program JHT 2015 – 2019
Appendix 10. Investment Portfolio of JHT Program In 2015 – 2019
Lampiran 11. Pendapatan Iuran dan Klaim Program JHT 2015 – 2019
Appendix 11. Contribution Income and Claim of JHT Program In 2015 – 2019
Lampiran 12. Laporan Posisi Keuangan Program Jaminan Pensiun (JP) 2015 – 2019
Appendix 12. Financial Statements of Pension Benefit Program (JP) In 2015 – 2019
Lampiran 13. Portofolio Investasi Program JP 2015 – 2019
Appendix 13. Investment Portfolio of JP Program In 2015 – 2019
Lampiran 14. Pendapatan Iuran dan Klaim Program JP 2015 – 2019
Appendix 14. Contribution Income and Claim of JP Program In 2015 – 2019
Lampiran 15. Laporan Posisi Keuangan BPJS Kesehatan (Badan) 2015 – 2019
Appendix 15. Financial Statements of BPJS Health (Agency) In 2015 – 2019
Lampiran 16. Laporan Posisi Keuangan Program Kesehatan 2015 – 2019
Appendix 16. Financial Statements of Health Program In 2015 – 2019
Lampiran 17. Pendapatan Iuran dan Klaim Program Kesehatan 2015 – 2019
Appendix 17. Contribution Income and Claim of Health Program In 2015 – 2019
10 11 48 50 51 53 53 54 56 56 57 59 59 60 62 62 63 65 66
Ikhtisar Jaminan Sosial
di Indonesia
Overview of Social Security
in Indonesia
S
istem Jaminan Sosial Nasional (SJSN) merupakan amanat Undang-Undang Dasar Tahun 1945 yang mewajibkan negara untuk mengembangkan sistem jaminan sosial bagi seluruh rakyat Indonesia. Pembentukan SJSN dimulai dengan diterbitkannya Undang-undang nomor 40 Tahun 2004 tentang Sistem Jaminan Sosial Nasional. Berdasarkan ketentuan ini, diamanatkan untuk membentuk suatu badan penyelenggara jaminan sosial yang berbentuk badan hukum publik dan bersifat nirlaba, yang kemudian dikenal dengan Badan Penyelenggara Jaminan Sosial (BPJS).BPJS dibentuk melalui Undang-Undang nomor 24 Tahun 2011 tentang Badan Penyelenggara Jaminan Sosial (UU BPJS). Guna mendukung pelaksanaan UU BPJS tersebut, Pemerintah telah mengalokasikan anggaran untuk persiapan pelaksanaan SJSN, antara lain berupa penyertaan modal negara kepada BPJS, peningkatan kapasitas puskesmas, dan rumah sakit milik Pemerintah. Selain itu, Pemerintah juga menyediakan anggaran untuk peningkatan kesadaran masyarakat akan manfaat pelayanan kesehatan, serta anggaran sosialisasi, edukasi dan advokasi kepada masyarakat tentang SJSN dan BPJS.
BPJS terdiri dari BPJS Ketenagakerjaan dan BPJS Kesehatan. BPJS Ketenagakerjaan merupakan transformasi dari PT Jamsostek (Persero) yang menyelenggarakan program Jaminan Hari Tua (JHT), Jaminan Kecelakaan Kerja (JKK), Jaminan Kematian (JKM), dan Jaminan Pensiun (JP). Seluruh program jaminan dimaksud diselenggarakan oleh BPJS Ketenagakerjaan sejak tanggal 1 Juli 2015.
T
he National Social Security System (SJSN) is a mandate of the 1945 Constitution which obliges the state to develop a national social security system for all Indonesia citizens. The formation of the SJSN began with the issuance of Law number 40 of 2004 concerning the National Social Security System. Based on this provision, it is mandated to establish a social security administering Agency in the form of a public and non-profit legal entity, which is then known as the Social Security Administration Agency (BPJS).BPJS was formed through Law number 24 of 2011 concerning The Social Security Administration Agency (BPJS Law). In order to support the implementation of the BPJS Law, the Government has allocated a budget to prepare for the implementation of the SJSN, including in the form of state capital participation in the BPJS, capacity building for public health centers and government-owned hospitals. In addition, the Government also provides a budget to increase public awareness about the benefits of health services, as well as a budget for socialization, education and advocacy to the public regarding SJSN and BPJS.
The BPJS consists of BPJS Ketenagakerjaan and BPJS Kesehatan. BPJS Ketenaga kerjaan is a transformation of PT Jamsostek (Persero) which organizes the Provident Fund benefit (JHT), Work Accident Benefit (JKK), Death Benefit (JKM) and Pension Benefit (JP) programs. The entire benefit program has been implemented by BPJS Ketenagakerjaan from 1 July 2015.
Gambar 01. | Program Jaminan Sosial Ketenagakerjaan
Figure 01. | Social Security Employement Program
PROGRAM JAMINAN SOSIAL KETENAGAKERJAAN
SOCIAL SECURITY EMPLOYEMENT PROGRAM
JKM
Jaminan Kematian (JKM) adalah manfaat uang tunai yang diberikan kepada ahli waris ketika peserta meninggal dunia buikan akibat kecelakaan kerja.
Death Insurance (JKM) is the benefit of cash given to an heir when the participant dies not due to work accident.
JKK
Program Jaminan Kecelakaan Kerja (JKK) adalah manfaat berupa uang tunai dan/ atau pelayanan kesehatan yang diberikan pada saat peserta mengalami kecelakaan kerja atau penyakit yang disebabkan oleh lingkungan kerja.
The Work Accident Guarantee Program (JKK) is a benefit in the form of cash and/or health services provided when participants experience work accidents or diseases caused by the work environment.
JHT
Jaminan Hari Tua (JHT) adalah manfaat uang tunai yang dibayarkan sekaligus pada saat peserta memasuki usia pensiun, meninggal dunia, atau mengalami cacat tetap total.Old Age Guarantee (JHT) is the benefit of cash paid at once when the participant enters retirement age, dies, or has a total permanent disability.
JP
Program Jaminan Pensiun (JP) adalah jaminan sosial yang bertujuan untuk mempertahankan derajat kehidupan yang layak bagi peserta dan/atau ahli warisnya dengan memberikan penghasilan setelah peserta memasuki usia pensiun, mengalami cacat total tetap, atau meninggal dunia.
The Pension Guarantee Program (JP) is a social security that aims to maintain a decent degree of life for participants and/or their heirs by providing income after participants enter retirement age, have permanent total disability, or die.
Sementara itu, BPJS Kesehatan merupakan transformasi dari PT Askes (Persero) yang akan menyelenggarakan program jaminan kesehatan nasional yang akan memberikan kepastian jaminan kesehatan kepada seluruh rakyat Indonesia. Program jaminan kesehatan ini diselenggarakan berdasarkan prinsip asuransi sosial dan ekuitas yaitu kesamaan dalam memperoleh pelayanan sesuai dengan kebutuhan medis yang tidak terkait dengan besaran iuran yang dibayarkan. Mulai tahun 2014, Pemerintah menanggung iuran bagi masyarakat miskin dan kurang mampu (yang disebut dengan Penerima Bantuan Iuran - PBI) untuk menjamin keikutsertaannya dalam program jaminan kesehatan.
BPJS Kesehatan is a transformation of PT Askes (Persero) which will be administer for the national health program that will ensure Healthcare Benefit for all Indonesian citizens. The Healthcare Benefit program is organized based on the principles of social and equity insurance, namely equality in obtaining services according to medical needs that are not related to the amount of contributions paid. Starting in 2014, the Government covers contributions for the poor and underprivileged (known as Premium Assistance Beneficiaries (PBI)) to ensure their participation in the Healthcare Benefit program.
Gambar 02. | Pengelolaan Dana BPJS dan Dana Jaminan Sosial menurut UU BPJS
Figure 02. | Management of the BPJS Fund and the Social Security Fund according to the BPJS Law
Dalam rangka menjaga sustainabilitas penyelenggaraan jaminan sosial oleh BPJS, Pemerintah menyadari perlunya pengawasan yang secara struktural dapat memantau perkembangan BPJS secara komprehensif. Pentingnya pengawasan dimaksud telah dituangkan dalam ketentuan Pasal 39 UU BPJS serta penjelasannya yang mengatur bahwa pengawasan BPJS dilakukan secara internal dan eksternal.
Pengawasan internal dilakukan oleh Dewan Pengawas dan satuan pengawasan internal, sedangkan pengawasan eksternal dilakukan oleh Dewan Jaminan Sosial Nasional (DJSN) dan pengawas independen, yaitu OJK dan BPK (dalam hal tertentu sesuai dengan kewenangannya). Disamping itu, dalam Undang-Undang nomor 21 Tahun 2011 tentang Otoritas Jasa Keuangan dijelaskan bahwa
In order to maintain the sustainability of the implementation of social security by BPJS, the Government realizes the need for supervision that can structurally monitor the development of BPJS comprehensively. The importance of such supervision has been stated in the provisions of Article 39 of the BPJS Law as well as the explanation that stipulates that BPJS supervision is carried out internally and externally.
Internal supervision is carried out by Board of Supervisors and the internal supervision unit, while external supervision is carried out by the National Social Security Council (DJSN) and independent supervisors, namely OJK and BPK (in certain cases according to their authority). In addition, Law number 21 of 2011 concerning the Financial Services Authority explains that OJK has the authority to carry out regulatory and
Sumber Dana / Source of Fund 1. PT Askes dan PT Jamsostek (Pengalihan Aset)
PT Askes and PT Jamsostek (transfer of assets)
2. Iuran dari Peserta, Pemberi Kerja, dan Pemerintah (bantuan iuran)
Contribution from Participant, Employer, and Government (contribution assistance)
3. Sumber lain (surplus/hibah/bantuan/dana talangan)
Other source (surplus/grant/assitance/bailouts)
Sumber Dana / Source of Fund 1. PT Askes dan PT Jamsostek (Pengalihan Aset)
PT Askes and PT Jamsostek (transfer of assets)
2. Pemerintah (Modal Awal)
Government (initial capital)
3. Sumber lain (surplus/hibah/bantuan)
Other source (surplus/grant/aid)
1. Operasional Penyelenggaraan
Operations
2. Pengadaan barang dan jasa
Procurements of goods and services
3. Peningkatan kapasitas pelayanan
Increasing service capacity
Pokok + Hasil
Investasi Pokok + Hasil Investasi
Penempatan
Investasi Penempatan Investasi
Biaya/Manfaat
Costs/Benefits CostsBiaya
Dana Operasional (Fee) Operational Funds (Fee) DANA JAMINAN SOSIAL (PROGRAM)
Social Security Funds (program) DANA BPJS (ADMINISTRATOR) BPJS’s Funds (administer) Investasi Investment Investasi Investment
• Pemberi Layanan; dan/atau
Service Providers
• Peserta
Participants Investment Base
and Yield Investment Base and Yield
Investment
OJK mempunyai kewenangan untuk melaksanakan fungsi pengaturan dan fungsi pengawasan terhadap seluruh lembaga jasa keuangan di Indonesia termasuk BPJS.
Dalam menyelenggarakan fungsi pengawasannya, OJK telah menerbitkan Peraturan OJK nomor 5/POJK.05/2013 tahun 2013 tentang Pengawasan Badan Penyelenggara Jaminan Sosial oleh Otoritas Jasa Keuangan yang berisi tentang ruang lingkup pengawasan BPJS oleh OJK, pemeriksaan langsung dan pemeriksaan tidak langsung OJK terhadap BPJS, jenis dan frekuensi pelaporan BPJS kepada OJK, serta ketentuan pengenaan sanksi dan rekomendasi kepada BPJS.
Dalam UU BPJS diamanatkan bahwa BPJS harus memisahkan antara aset badan penyelenggara dengan aset dana jaminan sosial serta subsidi silang antar program tidak diperkenankan. Selain itu, pada Pasal 13 UU BPJS diamanatkan bahwa pencatatan keuangan (pembukuan) mengacu kepada Standar Akuntansi Keuangan yang berlaku.
Terkait dengan pelaporan, BPJS diwajibkan untuk menyampaikan laporan keuangan dan laporan pengelolaan program kepada OJK. Laporan keuangan yang disampaikan kepada OJK terdiri dari laporan keuangan bulanan, semesteran, dan tahunan (audited). Bentuk dan format laporan keuangan bulanan telah diatur dalam Surat Edaran OJK nomor 5/SEOJK.05/2014 tentang Laporan Keuangan Bulanan BPJS dan Laporan Keuangan Bulanan Dana Jaminan Sosial. Sementara itu, format dan bentuk laporan keuangan semesteran dan laporan keuangan tahunan disusun berdasarkan Standar Akuntansi Keuangan yang berlaku. Laporan keuangan bulanan disampaikan paling lambat tanggal 15 bulan berikutnya yang dimulai sejak periode April 2014 yang lalu.
supervisory functions for all financial service institutions in Indonesia, including BPJS.
In carrying out its supervisory function, OJK has issued OJK Regulation number 5/POJK.05/2013 of 2013 concerning Supervision of Social Security Administering Bodies by the Financial Services Authority which contains the scope of BPJS supervision by OJK included OJK direct and indirect supervision of BPJS, types and frequency of BPJS reporting to OJK, as well as the provisions on the imposition of sanctions and recommendations to the BPJS.
In the BPJS Law it is mandated that the BPJS must separate the assets of the administering Agency from the assets of social security funds and cross subsidies between programs are not allowed. In addition, Article 13 of the BPJS Law mandates that financial recording (bookkeeping) of BPJS refers to the applicable Financial Accounting Standards.
Regarding the reporting, BPJS is required to submit financial reports and program management reports to the OJK. Financial reports submitted to OJK consist of monthly, semiannual, and annual (audited) financial reports. The form and report format of the monthly financial reports are stipulated in OJK Circular Letter number 5/ SEOJK.05/2014 concerning BPJS Monthly Financial Reports and Social Security Fund Monthly Financial Reports. Meanwhile, the format and form of semiannual financial reports and annual financial reports are prepared based on applicable Financial Accounting Standards. Monthly financial reports are submitted before 15th of the following month starting from the last April 2014 period.
STATISTIK JAMINAN SOSIAL
KETENAGAKERJAAN
STATISTIC OF EMPLOYMENT
SOCIAL SECURITY
A1.1. Financial Statements
A
t the end of 2019, total assets of BPJS Ketenagakerjaan (Agency) were recorded at IDR15,837 billion. The asset value increased by IDR913 billion (6.12%) compared to the previous year which was recorded at IDR14,924 billion. The increase in assets was caused by one of the components of non-current assets, namely bonds, which recorded a growth of 28.89% from 2018, from IDR3,475 billion to IDR4,479 billion. In general, from 2015 - 2019, the average BPJS Ketenagakerjaan (Agency) asset increased by 9.34% per year using the Compounded Annual Growth Rate (CAGR) method.A1. BPJS KETENAGAKERJAAN (Badan)
A1. BPJS KETENAGAKERJAAN (Agency)
A1.1. Laporan Posisi Keuangan
P
ada akhir 2019, total aset BPJS Ketenagakerjaan (Badan) tercatat sebesar Rp15.837 miliar. Nilai aset tersebut mengalami peningkatan sebesar Rp913 miliar (6,12%) dibanding tahun sebelumnya yang tercatat sebesar Rp14.924 miliar. Peningkatan aset tersebut dipengaruhi oleh salah satu komponen pada aset tidak lancar yaitu Obligasi, yang tercatat mengalami pertumbuhan sebesar 28,89% dari tahun 2018, yaitu dari Rp3.475 miliar menjadi Rp4.479 miliar. Secara umum, dari tahun 2015 – 2019 rata-rata aset BPJS Ketenagakerjaan (Badan) meningkat sebesar 9,34% pertahun dengan menggunakan metode Compounded Annual Growth Rate (CAGR).Tabel 01. | Laporan Posisi Keuangan BPJS Ketenagakerjaan (Badan) 2015 – 2019 Table 01. | Financial Statements of BPJS Ketenagakerjaan (Agency) In 2015 – 2019
dalam miliar / billion
KETERANGAN / INFORMATION 2015 2016 2017 2018 2019
Aset / Assets 11.082 13.371 14.456 14.924 15.837
Pertumbuhan Aset / Growth Assets -12,85% 20,66% 8,11% 3,24% 6,12%
Liabilitas / Liabilities 2.168 2.945 2.535 2.693 3.506
Pertumbuhan Liabilitas / Growth Liabilities -47,05% 35,87% -13,94% 6,27% 30,16%
Aset Neto / Net Assets 8.914 10.426 11.921 12.231 12.332
Pertumbuhan Aset Neto / Growth Net Assets 3,40% 16,96% 14,34% 2,60% 0,82%
Pada sisi liabilitas, tercatat peningkatan sebesar 30,16% dari posisi tahun sebelumnya, yaitu dari Rp2.693 miliar menjadi Rp3.056 miliar (meningkat sebesar Rp812 miliar). Seiring dengan pertumbuhan aset dan peningkatan liabilitas maka aset neto BPJS Ketenagakerjaan (Badan) pada akhir tahun 2019 juga mengalami pertumbuhan dibanding tahun sebelumnya, yaitu dari Rp12.231 miliar meningkat 0,82% menjadi sebesar Rp12.332 miliar. Secara umum, dari tahun 2015 – 2019 liabilitas dan aset neto BPJS Ketenagakerjaan (Badan) masing-masing meningkat sebesar 12,77% dan 8,45% pertahun dengan menggunakan metode CAGR.
On the liabilities side, there was an increase of 30.16% from the previous year’s position, from IDR2,693 billion to IDR3,056 billion (increase IDR812 billion). Along with the growth in assets and an increase in liabilities, the net assets of BPJS Ketenagakerjaan (Agency) at the end of 2019 also experienced growth compared to the previous year, from IDR12,231 billion, increasing by 0.82% to IDR12,332 billion. In general, from 2015 - 2019 the liabilities and net assets of BPJS Ketenagakerjaan (Agency) increased respectively by 12.77% and 8.45% annually using the CAGR method.
Grafik 01. | Perbandingan Aset, Liabialitas, dan Aset Neto BPJS Ketenagakerjaan (Badan) 2015 – 2019 Graph 01. | Comparison of Assets, Liabilities and Net Assets of BPJS Ketenagakerjaan (Agency) 2015 - 2019
A1.2. Invesment Growth
B
ased on the Government Regulation of the Republic of Indonesia Number 99 of 2013 concerning Manpower Social Security Asset Management, there are 11 types of investment instruments that are allowed. At the end of 2019, total investment of BPJS Ketenagakerjaan (Agency) was recorded at IDR11,656 billion, the dominating investment portfolios were bonds, stocks, deposits, sharia bonds and mutual funds with each portion of 42.59%, 20.85%, 18.13%, 12.41%, and 5.30%.A1.2. Pertumbuhan Investasi
B
erdasarkan Peraturan Pemerintah Republik Indonesia Nomor 99 Tahun 2013 Tentang Pengelolaan Aset Jaminan Sosial Ketenagakerjaan, terdapat 11 jenis instrumen investasi yang diperkenankan. Pada akhir 2019, total investasi BPJS Ketenagakerjaan (Badan) tercatat sebesar Rp11.656 miliar, portofolio investasi yang mendominasi adalah Obligasi, Saham, Deposito, Sukuk dan Reksadana dengan porsi masing-masing sebesar 42,59%, 20,85%, 18,13%, 12,41%, dan 5,30%. 18,13% Deposito / Deposits 20,85% Saham / Stocks 5,30% Reksa Dana / Mutual Funds 12,41% Sukuk / Sharia Bonds 42,59% Obligasi / Bonds 0,01% Penyertaan Langsung / Direct Participation 0,71% Properti Investasi / Investment PropertyGrafik 02. | Porsi Portofolio Investasi BPJS Ketenagakerjaan (Badan) 2019 Graph 02. | Portion of Investment Portfolio BPJS Ketenagakerjaan (Agency) 2019
2015 2016 2017 2018 2019 2.168 8.914 11.082 2.945 10.426 13.371 2.535 11.921 14.456 2.693 12.231 14.924 3.506 12.332 15.837
dalam miliar / billion
Total investasi BPJS Ketenagakerjaan (Badan) tersebut mengalami peningkatan sebesar 6,03% dari tahun sebelumnya yang sebesar Rp10.994 miliar. Peningkatan tersebut dipengaruhi oleh pertumbuhan investasi pada obligasi dan saham yang masing-masing meningkat sebesar 14,43% dan 9,42% dibanding tahun 2018. Rata-rata investasi BPJS Ketenagakerjaan (Badan) dari tahun 2015 – 2019 naik 11,59% pertahun yang dihitung dengan metode CAGR.
The total investment of the BPJS Ketenagakerjaan (Agency) has increased by 6.03% from the previous year which amounted to IDR10,994 billion. The increase was caused by investment growth in bonds and stocks, which increased respectively by 14.43% and 9.42% compared to 2018. The average investment of BPJS Ketenagakerjaan (Agency) from 2015 - 2019 increased by 11.59% per year calculated using the CAGR method.
Grafik 03. | Investasi BPJS Ketenagakerjaan (Badan) 2015 – 2019 Graph 03. | Investment of BPJS Ketenagakerjaan (Agency) In 2015 – 2019
7.567
2015 2016 2017 2018 2019
9.567 10.787 10.994
11.656
dalam miliar / billion
A1.3. Financial Ratio’s Indicator
I
n administering the Social Security program, BPJS Ketenagakerjaan (Agency) obtains and manages operational funds originating from the Social Security Fund. The operational funds are a component of BPJS Ketenagakerjaan (Agency) operating income in financial statements.Operating income of BPJS Ketenagakerjaan (Agency) at the end of 2019 was IDR4,701 billion, an increase of 2.01% compared to the previous year. This increase was also in line with operating expenses which increased by 1.13% from the previous year, to IDR4,442 billion. So that the resulting ratio of Operational Expenses to Operating Income (BOPO) of 94.54%.
A1.3. Indikator Rasio Keuangan
D
alam menyelenggarakan program Jaminan Sosial, BPJS Ketenagakerjaan (Badan) memperoleh dan mengelola dana operasional yang bersumber dari Dana Jaminan Sosial. Dana operasional tersebut menjadi komponen pendapatan operasional BPJS Ketenagakerjaan (Badan) dalam laporan keuangannya.Pendapatan operasional BPJS Ketenagakerjaan (Badan) pada akhir tahun 2019 adalah sebesar Rp4.701 miliar yang meningkat sebesar 2,01% dibanding tahun sebelumnya. Peningkatan tersebut juga seiring dengan beban operasional yang meningkat sebesar 1,13% dari tahun sebelumnya, menjadi Rp4.442 miliar. Sehingga dihasilkan rasio Beban Operasional Terhadap Pendapatan Operasional (BOPO) sebesar 94,54%.
Tabel 02. | Rasio Keuangan BPJS Ketenagakerjaan (Badan) 2015 – 2019 Table 02. | Financial Ratio of BPJS Ketenagakerjaan (Agency) In 2015 – 2019
dalam miliar / billion
KETERANGAN / INFORMATION 2015 2016 2017 2018 2019
Pendapatan Operasional / Operating Income 3.140 4.680 4.755 4.608 4.701
Beban Operasional / Operating Expenses 3.020 3.559 4.007 4.395 4.444
Pendapatan Investasi / Investment Income 795 769 825 1.062 891 Aset Neto / Net Assets 8.914 10.426 11.921 12.231 12.332 Liabilitas / Liabilities 2.168 2.945 2.535 2.693 3.506
Rasio Beban Terhadap Pendapatan Operasional /
The Ratio of Expenses to Operating Income 96,17% 76,05% 84,27% 95,36% 94,54%
Rasio Beban Terhadap Pendapatan Operasional dan Pendapatan Investasi /
The Ratio of Expenses to Operating and Investment Income
76,74% 65,32% 71,81% 77,49% 79,48%
Rasio Aset Neto Terhadap Liabilitas /
The Ratio of Net Assets to Liability 411,22% 353,99% 470,34% 454,10% 351,75%
Selain pendapatan operasional, BPJS Ketenagakerjaan (Badan) juga memperoleh dana dari hasil investasi yang dikembangkan. Dana tersebut dihitung sebagai pendapatan investasi. Pendapatan investasi BPJS Ketenagakerjaan (Badan) pada akhir tahun 2019 tercatat sebesar Rp891 miliar. Apabila memasukkan pendapatan investasi tersebut pada rasio BOPO di atas, maka nilai rasio BOPO tersebut menjadi sebesar 79,48%.
Di sisi aset neto dan liabilitas, pada akhir tahun 2019, kedua komponen tersebut sama-sama mengalami peningkatan dibanding tahun 2018 masing-masing sebesar 0,82% dan 30,16%. Adapun rasio aset neto terhadap liabilitas yang dimiliki BPJS Ketenagakerjaan (Badan) per akhir tahun 2019 adalah sebesar 351,75%.
In addition to operating income, BPJS Ketenagakerjaan (Agency) also receives funds from the investment results it develops. These funds are calculated as investment income. The investment income of BPJS Ketenagakerjaan (Agency) at the end of 2019 was recorded at IDR891 billion. If include the investment income in the BOPO ratio above, the BOPO ratio will be 79.48%.
In terms of net assets and liabilities, at the end of 2019, the two components had both increased compared to 2018 by 0.82% and 30.16%, respectively. The ratio of net assets to liabilities owned by BPJS Ketenagakerjaan (Agency) at the end of 2019 was 351.75%.
A2. PROGRAM JAMINAN KECELAKAAN KERJA (JKK)
A2. WORKPLACE ACCIDENT BENEFIT PROGRAM (JKK)
A2.1. Laporan Posisi Keuangan
P
ada akhir tahun 2019, total aset yang dikelola dalam program JKK adalah sebesar Rp36.426 miliar. Nilai aset tersebut mengalami peningkatan sebesar Rp6.875 miliar (23,26%) dibanding tahun sebelumnya yang tercatat sebesar Rp29.551 miliar. Komponen aset yang mengalami pertumbuhan terbesar adalah obligasi dimana bertambah sebesar Rp2.625 miliar dari tahun sebelumnya menjadi Rp20.162 miliar di tahun 2019. Secara umum, dari tahun 2015 – 2019 rata-rata aset program JKK meningkat sebesar 26,66% pertahun dengan menggunakan metode CAGR.A2.1. Financial Statements
A
t the end of 2019, the total assets managed under the JKK program amounted to IDR36,426 billion. The asset value increased by IDR6,875 billion (23.26%) compared to the previous year which was recorded at IDR29,551 billion. The asset component that experienced the largest growth was bonds, which increased by IDR2,625 billion from the previous year to IDR20,162 billion in 2019. In general, from 2015 - 2019, the average JKK program asset increased by 26.66% per year using the CAGR method.Tabel 03. | Laporan Posisi Keuangan Program Jaminan Kecelakaan Kerja (JKK) 2015 – 2019 Table 03. | Financial Statements of Work Accident Insurance Program (JKK) In 2015 – 2019
dalam miliar / billion
KETERANGAN / INFORMATION 2015 2016 2017 2018 2019
Aset / Assets 14.152 18.973 24.115 29.551 36.426
Pertumbuhan Aset / Growth Assets 17,31% 34,07% 27,10% 22,54% 23,26%
Liabilitas / Liabilities 2.193 2.424 2.850 2.976 3.515
Pertumbuhan Liabilitas / Growth Liabilities 63,93% 10,53% 17,57% 4,43% 18,14%
Aset Neto / Net Assets 11.959 16.549 21.266 26.575 32.910
Pertumbuhan Aset Neto / Growth Net Assets 11,50% 38,38% 28,50% 24,97% 23,84%
On the liabilities side, there was an increase of 18.14% from the previous year's position, from IDR2,976 billion to IDR3,515 billion (an increase of IDR540 billion). Along with the growth in assets and an increase in liabilities, the net assets of JKK Program at the end of 2019 also experienced growth compared to the previous year, from IDR26,575 billion, increasing 23.84% to IDR32,910 billion. In general, from 2015 - 2019 the liabilities and net assets of JKK program increased respectively by 12.52% and 28.80% annually using the CAGR method.
Pada sisi liabilitas, tercatat peningkatan sebesar 18,14% dari posisi tahun sebelumnya, yaitu dari Rp2.976 miliar menjadi Rp3.515 miliar (meningkat sebesar Rp540 miliar). Seiring dengan pertumbuhan aset dan peningkatan liabilitas maka aset neto Program JKK pada akhir tahun 2019 juga mengalami pertumbuhan dibanding tahun sebelumnya, yaitu dari Rp26.575 miliar meningkat 23,84% menjadi sebesar Rp32.910 miliar. Secara umum, dari tahun 2015 – 2019 liabilitas dan aset neto program JKK masing-masing meningkat sebesar 12,52% dan 28,80% pertahun dengan menggunakan metode CAGR.
Grafik 04. | Perbandingan Aset, Liabilitas, dan Aset Neto Program JKK 2015 – 2019 Graph 04. | Comparison of Asset, Liability and Net Asset of JKK Program 2015 - 2019
2015 2016 2017 2018 2019 2.193 11.959 2.424 16.549 2.850 21.266 2.976 26.575 3.515 32.910 14.152 18.973 24.115 29.551 36.426
A2.2. Investment Growth
A
t the end of 2019, total of JKK investment was recorded at IDR35,599 billion, the dominating investment portfolios were bonds, deposits, stocks, sharia bonds, and mutual funds with respectively portion by 56.64%, 17.75%, 11.76%, 10.07%, and 3.80%.A2.2. Pertumbuhan Investasi
P
ada akhir 2019, total investasi JKK tercatat sebesar Rp35.599 miliar, portofolio investasi yang mendominasi adalah Obligasi, Deposito, Saham, Sukuk, dan Reksadana dengan porsi masing-masing sebesar 56,64%, 17,75%, 11,76%, 10,07%, dan 3,80%.Grafik 05. | Porsi Portofolio Investasi Program JKK 2019 Graph 05. | Portion of Investment Portfolio JKK Program 2019
11,76%
Saham / Stocks
17,75%
Deposito / Deposits
3,80%
Reksa Dana / Mutual Funds
10,07%
Sukuk / Sharia Bonds
56,64%
Obligasi / Bonds
dalam miliar / billion
Total investasi JKK tersebut mengalami peningkatan sebesar 23,28% dari tahun sebelumnya yang sebesar Rp28.877 miliar. Peningkatan tersebut dipengaruhi oleh pertumbuhan investasi pada obligasi dan saham yang masing-masing meningkat sebesar 14,97% dan 49,18% dibanding tahun 2018. Rata-rata investasi Program JKK dari tahun 2015 – 2019 naik 11,40% pertahun yang dihitung dengan metode CAGR.
The total investment of JKK has increased by 23.28% from the previous year which amounted to IDR28,877 billion. This increase was influenced by investment growth in bonds and stocks, which increased respectively by 14.97% and 49.18% compared to 2018. The average investment of JKK Program from 2015 - 2019 increased by 11.40% per year calculated using the CAGR method.
Grafik 06. | Investasi Program JKK 2015 – 2019 Graph 06. | Investment of JKK Program In 2015 – 2019
13.803 2015 2016 2017 2018 2019 18.698 23.784 28.877 35.599
dalam miliar / billion
A2.3. Participants
T
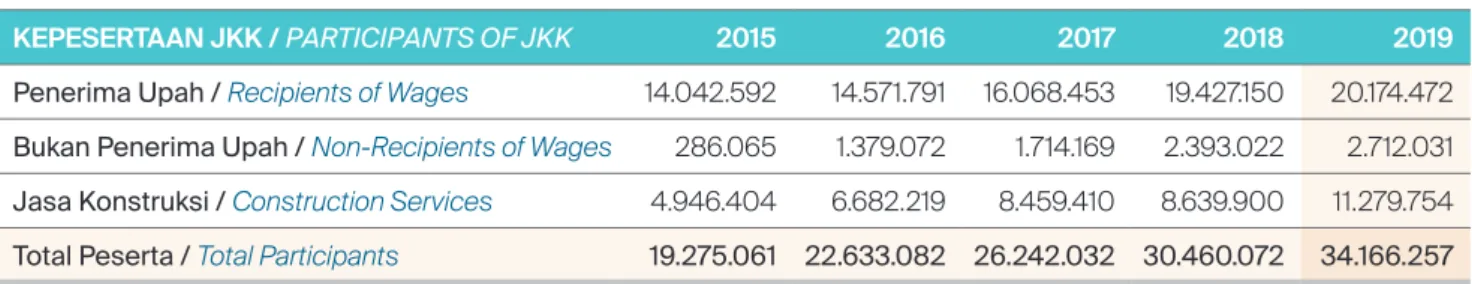
he types of participants per participant segment covered by the JKK program consist of three, the Recipient of Wages, Non-Recipients of Wages, and Construction Services. In terms of proportion, the number of Wage Recipient participants is the largest compared to the other two types of membership, about 20,174,472 participants or 59% of the total JKK program participants.A2.3. Kepesertaan
J
enis kepesertaan per segmen peserta yang tercakup dalam program JKK terdiri dari tiga yaitu Penerima Upah, Bukan Penerima Upah, dan Jasa Konstruksi. Secara proporsi, peserta jenis Penerima Upah berjumlah paling banyak dibanding dua jenis kepesertaan lainnya, yaitu sejumlah 20.174.472 peserta atau 59% dari total seluruh peserta program JKK.59%
Penerima Upah /
Recipients of Wages
8%
Bukan Penerima Upah /
Non-Recipients of Wages
33%
Jasa Konstruksi /
Construction Services
Grafik 07. | Porsi Kepesertaan per Segmen Peserta Program JKK 2019 Graph 07. | Portion of Participants per Participant Segment JKK Program 2019
Dibandingkan dengan tahun sebelumnya, total peserta program JKK pada tahun 2019 meningkat 12,17%, yaitu menjadi 34.166.257 peserta. Peningkatan terbesar terjadi pada jenis kepesertaan Jasa Konstruksi, yang meningkat 33,01% dari tahun sebelumnya.
Compared to the previous year, the total JKK program participants in 2019 increased by 12.17%, to 34,166,257 participants. The largest increase occurred in the type of construction services membership, which increased by 33.01% from the previous year.
Tabel 04. | Kepesertaan Program JKK 2015 – 2019 Table 04. | Participants of JKK Program In 2015 – 2019
KEPESERTAAN JKK / PARTICIPANTS OF JKK 2015 2016 2017 2018 2019
Penerima Upah / Recipients of Wages 14.042.592 14.571.791 16.068.453 19.427.150 20.174.472 Bukan Penerima Upah / Non-Recipients of Wages 286.065 1.379.072 1.714.169 2.393.022 2.712.031
Jasa Konstruksi / Construction Services 4.946.404 6.682.219 8.459.410 8.639.900 11.279.754
Total Peserta / Total Participants 19.275.061 22.633.082 26.242.032 30.460.072 34.166.257
A2.4. Contribution Income and Claim
A
long with the growth in the number of JKK program participants, the contribution income received by BPJS Ketenagakerjaan has increased. This increase can be seen in the total contribution income at the end of 2019 amounting to IDR5,926 billion, an increase of 11.36% from the previous year. Claim payments to participants also increased compared to the previous year. It can be seen that at the end of 2019, the number of claims paid was recorded at IDR1,577 billion. This represents an increase of 28.52% from the previous year which amounted to IDR1,227 billion. In general, from 2015 - 2019 the contribution income and claims of JKK program increased respectively by 14.03% and 24.27% annually using the CAGR method.A2.4. Pendapatan Iuran dan Klaim
S
eiring dengan pertumbuhan jumlah kepesertaan program JKK, maka pendapatan iuran yang diterima BPJS Ketenagakerjaan mengalami peningkatan. Peningkatan tersebut terlihat pada total pendapatan iuran di akhir tahun 2019 sebesar Rp5.926 miliar yang meningkat 11,36% dari tahun sebelumnya. Pembayaran klaim kepada peserta juga mengalami peningkatan dibanding tahun sebelumnya. Terlihat pada akhir tahun 2019, jumlah klaim yang dibayarkan tercatat sebesar Rp1.577 miliar. Hal tersebut merupakan peningkatan sebesar 28,52% dari tahun sebelumnya yang sebesar Rp1.227 miliar. Secara umum, dari tahun 2015 – 2019 pendapatan iuran dan klaim program JKK masing-masing meningkat sebesar 14,03% dan 24,27% pertahun dengan menggunakan metode CAGR. 2019 2018 2017 2016 2015 5.926 5.322 4.650 4.108 3.505 1.577 1.227 972 833 661Grafik 08. | Pendapatan Iuran dan Klaim Program JKK 2015 – 2019
Graph 08. | Contribution Income and Claim JKK Program in 2015 – 2019 dalam miliar / billion
A3. PROGRAM JAMINAN KEMATIAN (JKM)
A3. DEATH BENEFIT PROGRAM (JKM)
A3.1. Laporan Posisi Keuangan
P
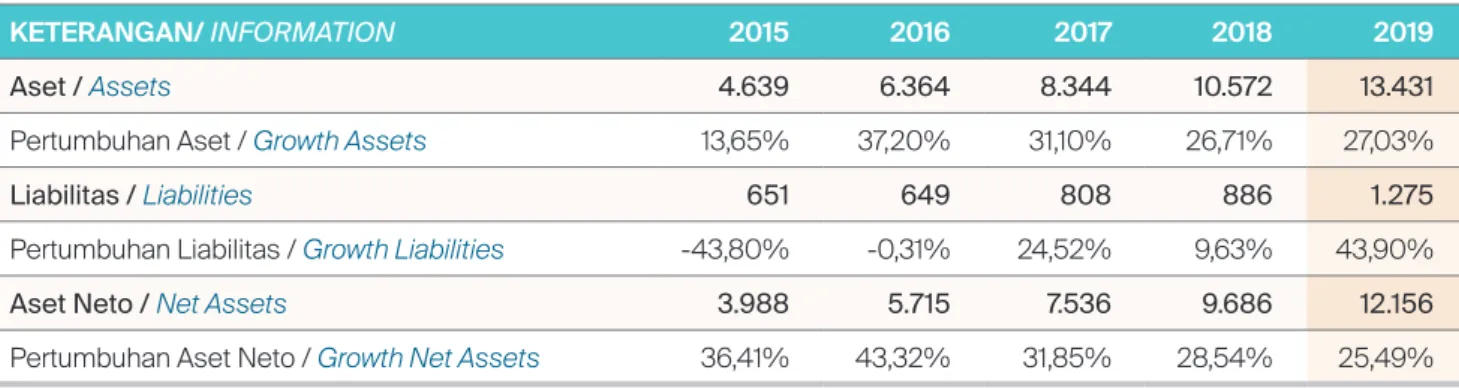
ada akhir tahun 2019, total aset yang dikelola dalam program JKM adalah sebesar Rp13.431 miliar. Nilai aset tersebut mengalami peningkatan sebesar Rp2.858 miliar (27,03%) dibanding tahun sebelumnya yang tercatat sebesar Rp10.572 miliar. Komponen aset yang mengalami pertumbuhan terbesar adalah obligasi dimana bertambah sebesar Rp1.548 miliar dari tahun sebelumnya menjadi Rp7.783 miliar di tahun 2019. Secara umum, dari tahun 2015 – 2019 rata-rata aset program JKM meningkat sebesar 30,44% pertahun dengan menggunakan metode CAGR.A3.1. Financial Statements
A
t the end of 2019, the total assets under the JKM program amounted to IDR13,431 billion. The asset value increased by IDR2,858 billion (27.03%) compared to the previous year which was recorded at IDR10,572 billion. The asset component that experienced the largest growth was bonds, which increased by IDR1,548 billion from the previous year to IDR7,783 billion in 2019. In general, from 2015 - 2019, the average JKM program asset increased by 30.44% per year using the CAGR method.On the liabilities side, an increase of 43.90% was recorded from the previous year's position, from IDR886 billion to IDR1,275 billion (an increase of IDR389 billion). Along with the growth in assets and an increase in liabilities, the net assets of JKM Program at the end of 2019 also experienced growth compared to the previous year, from IDR9,686 billion, increasing by 25.49% to IDR12,156 billion. In general, from 2015 - 2019 the liabilities and net assets of JKM program increased respectively by 18.30% and 32.13% annually using the CAGR method.
Pada sisi liabilitas, tercatat peningkatan sebesar 43,90% dari posisi tahun sebelumnya, yaitu dari Rp886 miliar menjadi Rp1.275 miliar (meningkat sebesar Rp389 miliar). Seiring dengan pertumbuhan aset dan peningkatan liabilitas maka aset neto Program JKM pada akhir tahun 2019 juga mengalami pertumbuhan dibanding tahun sebelumnya, yaitu dari Rp9.686 miliar meningkat 25,49% menjadi sebesar Rp12.156 miliar. Secara umum, dari tahun 2015 – 2019 liabilitas dan aset neto program JKM masing-masing meningkat sebesar 18,30% dan 32,13% pertahun dengan menggunakan metode CAGR.
Tabel 05. | Laporan Posisi Keuangan Program Jaminan Kematian (JKM) 2015 – 2019 Table 05. | Financial Statements of Death Benefit Program (JKM) In 2015 – 2019
dalam miliar / billion
KETERANGAN/ INFORMATION 2015 2016 2017 2018 2019
Aset / Assets 4.639 6.364 8.344 10.572 13.431
Pertumbuhan Aset / Growth Assets 13,65% 37,20% 31,10% 26,71% 27,03%
Liabilitas / Liabilities 651 649 808 886 1.275
Pertumbuhan Liabilitas / Growth Liabilities -43,80% -0,31% 24,52% 9,63% 43,90%
Aset Neto / Net Assets 3.988 5.715 7.536 9.686 12.156
Grafik 09. | Perbandingan Aset, Liabialitas, dan Aset Neto Program JKM 2015 – 2019 Graph 09. | Comparison of Asset, Liability and Net Asset of JKM Program 2015 - 2019
2015 2016 2017 2018 2019 652 3.988 649 5.715 808 7.536 886 9.686 1,275 12.156 4.639 6.364 8.344 10.572 13.431
A3.2. Pertumbuhan Investasi
P
ada akhir 2019, total investasi JKM tercatat sebesar Rp13.047 miliar, portofolio investasi yang mendominasi adalah Obligasi, Saham, Deposito, Sukuk, dan Reksa Dana dengan porsi masing-masing sebesar 59,65%, 18,63%, 10,93%, 8,22%, dan 2,56%.A3.2. Investment Growth
A
t the end of 2019, total investment of JKM was recorded at IDR13,047 billion, the dominating investment portfolios were bonds, stocks, deposits, sharia bonds, and mutual funds with respectively portion by 59.65%, 18.63%, 10.93%, 8.22%, and 2.56%.Grafik 10. | Porsi Portofolio Investasi Program JKM 2019 Graph 10. | Portion of Investment Portfolio JKM Program 2019
18,63%
Deposito / Deposits
59,65%
Obligasi / Bonds 10,93%Saham / Stocks
2,56%
Reksa Dana / Mutual Funds
8,22%
Sukuk / Sharia Bonds
dalam miliar / billion
Total investasi JKM tersebut mengalami peningkatan sebesar 25,54% dari tahun sebelumnya yang sebesar Rp10.392 miliar. Peningkatan tersebut dipengaruhi oleh pertumbuhan investasi pada deposito, saham, dan obligasi yang masing-masing meningkat sebesar 57,25%, 26,82% dan 24,83% dibanding tahun 2018. Rata-rata investasi Program JKM dari tahun 2015 – 2019 naik 30,18% pertahun yang dihitung dengan metode CAGR.
The total investment of JKM increased by 25.54% from the previous year which amounted to IDR10,392 billion. This increase was influenced by investment growth in deposits, stocks and bonds, which increased respectively by 57.25%, 26.82% and 24.83% compared to 2018. The average investment of JKM Program from 2015 - 2019 increased by 30.18% per year calculated using the CAGR method.
Grafik 11. | Investasi Program JKM 2015 – 2019 Graph 11. | Portfolio of JKM Program In 2015 – 2019
2015 2016 2017 2018 2019
dalam miliar / billion
4.542 6.250 8.211 10.392 13.047
A3.3. Participants
A
s stated in Government Regulation Number 44 of 2015, participation in the JKK and JKM programs is mandatory for every worker. In addition, it can be interpreted that the JKK and JKM programs are a package. So that the JKM program membership data can refer to the JKK program membership that was previously mentioned (See at Graph 07 and Table 04).A3.4. Contribution Income and Claim
A
long with the growth in the number of JKM program members, the contribution income received by BPJS Ketenagakerjaan has increased. This increase can be seen in the total contribution income at the end of 2019 of IDR2,814 billion, an increase of 12.83% from the previous year, which was IDR2,494 billion. Claim payments to participants also increased compared to the previous year. It can be seen that at the end of 2019, the number of claims paid was recorded at IDR863 billion. This represents an increase of 21.85% from the previous year which amounted to IDR708 billion. In general, from 2015 - 2019 the contribution incomeA3.3. Kepesertaan
S
ebagaimana tercantum dalam PP Nomor 44 tahun 2015, maka kepesertaan program JKK dan JKM adalah wajib bagi setiap pekerja. Selain itu, dapat diartikan bahwa program JKK dan JKM ini bersifat sepaket. Sehingga data kepesertaan program JKM dapat mengacu pada kepesertaan program JKK yang sudah disebutkan sebelumnya (Lihat Grafik 07 dan Tabel 04).A3.4. Pendapatan Iuran dan Klaim
S
eiring dengan pertumbuhan jumlah kepesertaan program JKM, maka pendapatan iuran yang diterima BPJS Ketengakerjaan mengalami peningkatan. Peningkatan tersebut terlihat pada total pendapatan iuran di akhir tahun 2019 sebesar Rp2.814 miliar yang meningkat 12,83% dari tahun sebelumnya, yang sebesar Rp2.494 miliar. Pembayaran klaim kepada peserta juga mengalami peningkatan dibanding tahun sebelumnya. Terlihat pada akhir tahun 2019, jumlah klaim yang dibayarkan tercatat sebesar Rp863 miliar. Hal tersebut merupakan peningkatan sebesar 21,85% dari tahun sebelumnya yangsebesar Rp708 miliar. Secara umum, dari tahun 2015 – 2019 pendapatan iuran dan klaim program JKM masing-masing meningkat sebesar 15,33% dan 16,80% pertahun dengan menggunakan metode CAGR.
and claims of JKM program increased respectively by 15.33% and 16.80% annually using the CAGR method.
Grafik 12. | Pendapatan Iuran dan Klaim Program JKM 2015 – 2019
Graph 12. | Contribution Income and Claim JKM Program in 2015 – 2019 dalam miliar / billion
2019 2018 2017 2016 2015 2,494 2,121 1,829 1,591 863 708 612 594 464 2,814
A4. PROGRAM JAMINAN HARI TUA (JHT)
A4. OLD AGE BENEFIT PROGRAM (JHT)
A4.1. Laporan Posisi Keuangan
P
ada akhir tahun 2019, total aset yang dikelola dalam program JHT adalah sebesar Rp318.306 miliar. Nilai aset tersebut mengalami peningkatan sebesar Rp39.474 miliar (14,16%) dibanding tahun sebelumnya yang tercatat sebesar Rp278.832 miliar. Komponen aset yang mengalami pertumbuhan terbesar adalah obligasi dimana bertambah sebesar Rp18.873 miliar dari tahun sebelumnya menjadi Rp145.236 miliar di tahun 2019. Secara umum, dari tahun 2015 – 2019 rata-rata aset program JHT meningkat sebesar 15,00% pertahun dengan menggunakan metode CAGR.A4.1. Financial Statements
A
t the end of 2019, the total assets managed in the JHT program amounted to IDR318,306 billion. The asset value has increased by IDR39,474 billion (14.16%) compared to the previous year which was recorded at IDR278,832 billion. The asset component that experienced the largest growth was bonds which increased by IDR18,873 billion from the previous year to IDR145,236 billion in 2019. In general, from 2015 – 2019, the average JHT program asset increased by 15.00% per year using the CAGR method.Tabel 06. | Laporan Posisi Keuangan Program Jaminan Hari Tua (JHT) 2015 – 2019 Table 06. | Financial Statements of Old Age Benefit Program (JHT) In 2015 – 2019
dalam miliar / billion
KETERANGAN / INFORMATION 2015 2016 2017 2018 2019
Aset / Assets 181.971 217.693 254.189 278.832 318.306
Pertumbuhan Aset / Growth Assets 8,93% 19,63% 16,76% 9,69% 14,16%
Liabilitas / Liabilities 481 3.196 2.442 309 686
Pertumbuhan Liabilitas / Growth Liabilities -72,27% 564,62% -23,57% -87,33% 121,61%
Aset Neto / Net Assets 181.490 214.497 251.746 278.522 317.620
Pertumbuhan Aset Neto / Growth Net Assets 9,78% 18,19% 17,37% 10,64% 14,04%
On the liabilities side, there was an increase of 121.61% from the previous year's position, from IDR309 billion to IDR686 billion (an increase of IDR377 billion). Along with the growth in assets, the net assets of JHT Program at the end of 2019 also experienced growth compared to the previous year, from IDR278,522 billion, increasing by 14.04% to IDR317,620 billion. In general, from 2015 - 2019 the liabilities and net assets of JHT program increased respectively by 9.28% and 15.02% annually using the CAGR method.
Pada sisi liabilitas, tercatat peningkatan sebesar 121,61% dari posisi tahun sebelumnya, yaitu dari Rp309 miliar menjadi Rp686 miliar (meningkat sebesar Rp377 miliar). Seiring dengan pertumbuhan aset maka aset neto Program JHT pada akhir tahun 2019 juga mengalami pertumbuhan dibanding tahun sebelumnya, yaitu dari Rp278.522 miliar meningkat 14,04% menjadi sebesar Rp317.620 miliar. Secara umum, dari tahun 2015 – 2019 liabilitas dan aset neto program JHT masing-masing meningkat sebesar 9,28% dan 15,02% pertahun dengan menggunakan metode CAGR.
Grafik 13. | Perbandingan Aset, Liabialitas, dan Aset Neto Program JHT 2015 – 2019 Graph 13. | Comparison of Asset, Liability and Net Asset of JHT Program 2015 - 2019
2015 2016 2017 2018 2019 481 181.490 181.971 3.196 214.497 217.693 2.442 251.746 254.189 309 278.522 278.832 686 317.620 318.306
A4.2. Pertumbuhan Investasi
P
ada akhir 2019, total investasi JHT tercatat sebesar Rp312.562 miliar, portofolio investasi yang mendominasi adalah Obligasi, Saham, Sukuk, Deposito, dan Reksa Dana dengan porsi masing-masing sebesar 46,47%, 20,69%, 13,04%, 9,63%, dan 9,28%.A4.2. Investment Growth
A
t the end of 2019, the total investment of JHT was recorded at Rp312,562 billion, the dominating investment portfolios were bonds, stocks, sharia bond, deposits and mutual funds with respectively portion by 46.47%, 20.69%, 13.04%, 9.63%, and 9.28%.Grafik 14. | Porsi Portofolio Investasi Program JHT 2019 Graph 14. | Portion of Investment Portfolio JHT Program 2019
9,63%
Deposito / Deposits
20,69%
Saham / Stocks
9,28%
Reksa Dana / Mutual Funds
13,04%
Sukuk / Sharia Bonds
46,47%
Obligasi / Bonds
0,12%
KIK EBA / Asset-Backed Securities Collective Investment Contracts
0,19%
Penyertaan Langsung / Direct Participation 0,58%
Properti Investasi / Investment Property
dalam miliar / billion
Total investasi program JHT tersebut mengalami peningkatan sebesar 13,75% dari tahun sebelumnya yang sebesar Rp274.784 miliar. Peningkatan tersebut dipengaruhi oleh pertumbuhan investasi pada obligasi, saham, dan sukuk yang masing-masing meningkat sebesar 14,94%, 15,71%, dan 27,22% dibanding tahun 2018. Rata-rata investasi Program JHT dari tahun 2015 – 2019 naik 14,99% pertahun yang dihitung dengan metode CAGR.
The total investment of JHT program increased by 13.75% from the previous year which amounted to IDR274,784 billion. This increase was caused an increase in investment growth in postponements, and sharia bond which respectively increased by 14.94%, 15.71%, and 27.22% compared to 2018. The average investment of JHT Program from 2015 - 2019 increased by 14.99% per year calculated using the CAGR method.
Grafik 15. | Investasi Program JHT 2015 – 2019 Graph 15. | Investment of JHT Program In 2015 – 2019
2015 2016 2017 2018 2019
dalam miliar / billion
A4.3. Participants
A
s stated in Government Regulation Number 46 of 2015, the types of participation covered in JHT program consist of two, Wage Recipients and Non-Wage Recipients. In terms of proportion, the largest number of Wage Recipient participants compared to other types of participation, about 16,031,227 participants or 99% of the total JHT program participants.A4.3. Kepesertaan
S
ebagaimana tercantum dalam PP Nomor 46 tahun 2015, maka jenis kepesertaan yang tercakup dalam program JHT terdiri dari dua yaitu Penerima Upah dan Bukan Penerima Upah. Secara proporsi, peserta jenis Penerima Upah berjumlah paling banyak dibanding jenis kepesertaan lainnya, yaitu sejumlah 16.031.227 peserta atau 99% dari total seluruh peserta program JHT.178.793 214.486
249.050 274.784
312.562
Grafik 16. | Porsi Kepesertaan per Segmen Peserta Program JHT 2019 Graph 16. | Portion of Participants per Participant Segment JHT Program 2019
1%
Bukan Penerima Upah /
Non-Wage Recipients
99%
Penerima Upah /
Compared to the previous year, the total participants of JHT program in 2019 increased by 4.94%, to 16,240,645 participants, from the previous year which amounted to 15,476,727 participants.
Dibandingkan dengan tahun sebelumnya, total peserta program JHT pada tahun 2019 meningkat 4,94%, yaitu menjadi 16.240.645 peserta, dari tahun sebelumnya yang sebesar 15.476.727 peserta.
Tabel 07. | Kepesertaan Program JHT 2015 – 2019 Table 07. | Participants of JHT Program In 2015 – 2019
KEPESERTAAN JHT / PARTICIPANTS OF JHT 2015 2016 2017 2018 2019
Penerima Upah / Wage Recipients 13.112.283 13.677.912 14.427.135 15.270.335 16.031.227
Bukan Penerima Upah / Non-Wage Recipients 42.503 95.167 143.148 206.392 209.418 Total Peserta / Total Participants 13.154.786 13.773.079 14.570.283 15.476.727 16.240.645
A4.4. Contribution Income and Claim
A
long with the growth in the number of JHT program members, the contribution income received by BPJS Ketenagakerjaan has increased. This increase can be seen in the total contribution income at the end of 2019 of IDR47,438 billion, an increase of 11.90% from the previous year, which was IDR42,394 billion. Claim payments to participants also increased compared to the previous year. It can be seen that at the end of 2019, the number of claims paid was recorded at IDR27,081 billion. This is an increase of 21.27% from the previous year which amounted to IDR22,330 billion. In general, from 2015 - 2019 the contribution income and claims of JHT program increased respectively by 13.61% and 12.75% annually using the CAGR method.A4.4. Pendapatan Iuran dan Klaim
S
eiring dengan pertumbuhan jumlah kepesertaan program JHT, maka pendapatan iuran yang diterima BPJS Ketenagakerjaan mengalami peningkatan. Peningkatan tersebut terlihat pada total pendapatan iuran di akhir tahun 2019 sebesar Rp47.438 miliar yang meningkat 11,90% dari tahun sebelumnya, yang sebesar Rp42.394 miliar. Pembayaran klaim kepada peserta juga mengalami peningkatan dibanding tahun sebelumnya. Terlihat bahwa pada akhir tahun 2019, jumlah klaim yang dibayarkan tercatat sebesar Rp27.081 miliar. Hal tersebut merupakan peningkatan sebesar 21,27% dari tahun sebelumnya yang sebesar Rp22.330 miliar. Secara umum, dari tahun 2015 – 2019 pendapatan iuran dan klaim program JHT masing-masing meningkat sebesar 13,61% dan 12,75% pertahun dengan menggunakan metode CAGR. 2019 2018 2017 2016 2015 42.394 37.322 32.980 28.475 22.330 23.235 17.973 16.759 47.438Grafik 17. | Pendapatan Iuran dan Klaim Program JHT 2015 – 2019
Graph 17. | Contribution Income and Claim JHT Program in 2015 – 2019 dalam miliar / billion
27.081
A5. PROGRAM JAMINAN PENSIUN (JP)
A5. PENSION BENEFIT PROGRAM (JP)
A5.1. Laporan Posisi Keuangan
P
ada akhir tahun 2019, total aset yang dikelola dalam program JP adalah sebesar Rp60.145 miliar. Nilai aset tersebut mengalami peningkatan sebesar Rp19.735 miliar (48,84%) dibanding tahun sebelumnya yang tercatat sebesar Rp40.409 miliar. Komponen aset yang mengalami pertumbuhan terbesar adalah obligasi dimana bertambah sebesar Rp10.245 miliar dari tahun sebelumnya menjadi Rp29.499 miliar di tahun 2019. Secara umum, dari tahun 2015 – 2019 rata-rata aset program JP meningkat sebesar 117,78% pertahun dengan menggunakan metode CAGR.A5.1. Financial Statements
A
t the end of 2019, the total assets managed in the JP program amounted to IDR60,145 billion. The asset value has increased by IDR19,735 billion (48.84%) compared to the previous year which was recorded at IDR40,409 billion. The asset component that experienced the largest growth was bonds which increased by IDR10,245 billion from the previous year to IDR29,499 billion in 2019. In general, from 2015 - 2019, the average JHT program asset increased by 117.78% per year using the CAGR method.Tabel 08. | Laporan Posisi Keuangan Program Jaminan Pensiun (JP) 2015 – 2019 Table 08. | Financial Statements of Pension Benefit Program (JP) In 2015 – 2019
dalam miliar / billion
KETERANGAN / INFORMATION 2015 2016 2017 2018 2019
Aset / Assets 2.674 12.195 25.662 40.409 60.145
Pertumbuhan Aset / Growth Assets - 356,09% 110,43% 57,46% 48,84%
Liabilitas / Liabilities 17 10 32 65 117
Pertumbuhan Liabilitas / Growth Liabilities - -43,61% 226,52% 103,80% 80,42%
Aset Neto / Net Assets 2.657 12.186 25.631 40.344 60.027
Pertumbuhan Aset Neto / Growth Net Assets - 358,70% 110,33% 57,41% 48,79%
Pada sisi liabilitas, tercatat peningkatan sebesar 80,42% dari posisi tahun sebelumnya, yaitu dari Rp65 miliar menjadi Rp117 miliar (meningkat sebesar Rp52 miliar). Seiring dengan pertumbuhan aset maka aset neto Program JP pada akhir tahun 2019 juga mengalami pertumbuhan dibanding tahun sebelumnya, yaitu dari Rp40.344 miliar meningkat 48,79% menjadi sebesar Rp60.027 miliar. Secara umum, dari tahun 2015 – 2019 liabilitas dan aset neto program JP masing-masing meningkat sebesar 61,30% dan 118,02% pertahun dengan menggunakan metode CAGR.
On the liabilities side, there was an increase of 80.42% from the previous year’s position, from IDR65 billion to IDR117 billion (an increase of IDR52 billion). Along with the growth in assets, the net assets of JP Program at the end of 2019 also experienced growth compared to the previous year, from IDR40,344 billion, increasing by 48.79% to IDR60,027 billion. In general, from 2015 - 2019 the liabilities and net assets of JP program increased respectively by 61.30% and 118.02% annually using the CAGR method.