ALGORITHMS OF CRESCENT STRUCTURE DETECTION IN HUMAN BIOLOGICAL
FLUID FACIES
V.R. Krasheninnikova*, O.E. Malenovaa, A.S. Yashinab
aUlyanovsk State Technical University, Ulyanovsk, Russia – [email protected] bResearch-and-Production Association “Mars”, Ulyanovsk, Russia – [email protected]
Commission II, WG II/10
KEY WORDS: Medical Diagnostic, Biological Fluid, Facies, Marker, Detection, Recognition
ABSTRACT:
One of the effective methods of early medical diagnosis is based on the image analysis of human biological fluids. In the process of fluid crystallization there appear characteristic patterns (markers) in the resulting layer (facies). Each marker is a highly probable sign of some pathology even at an early stage of a disease development. When mass health examination is carried out, it is necessary to analyze a large number of images. That is why, the problem of algorithm and software development for automated processing of images is rather urgent nowadays. This paper presents algorithms to detect a crescent structures in images of blood serum and cervical mucus facies. Such a marker indicates the symptoms of ischemic disease. The algorithm presented detects this marker with high probability when the probability of false alarm is low.
* Corresponding author
1. INTRODUCTION
Early medical diagnosis largely determines the success of preventive and therapeutic measures. One of the effective methods of early diagnosis is based on the image analysis of human biological fluid facies. A little drop of fluid is put on the glass slide and dried out under certain conditions. Only a thin dry film (facies) remains. The overall condition of the body affects the crystallization of the liquid, so characteristic structures (markers) occur on a facies image.
The first methods of diagnosis using biological fluids are described in (Bolen, 1942). A systematic study of facies markers were carried out by (Shabalin and Shatokhina, 2001). But the majority of obtained methods involve visual image analysis with a variety of techniques, which increase the quality of visual perception: special microscopes, chemicals additives in biological fluid, etc. When mass health examination is carried out, it is necessary to analyze a large number of images. That is why, the problem of algorithm and software development for automated image processing is rather urgent nowadays. However, there are much less such papers. Nowadays, research in this direction are actively conducted, several algorithms and automated systems are developed (for example, Khonina et al., 1995 and Kupriyanov et al., 2005). Algorithms presented in (Krasheninnikov et al., 2011 and 2012) are elaborated to detect several peculiar markers with high probability when the probability of false alarm is low. A very full review and an extensive bibliography are given in (Kraevoy and Koltovoy, 2016)
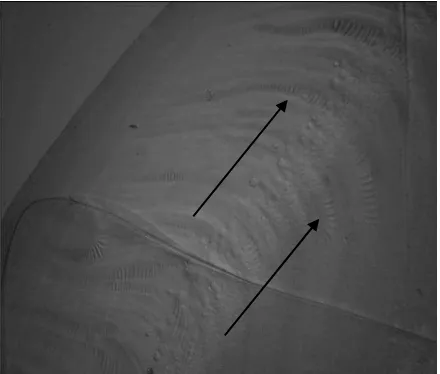
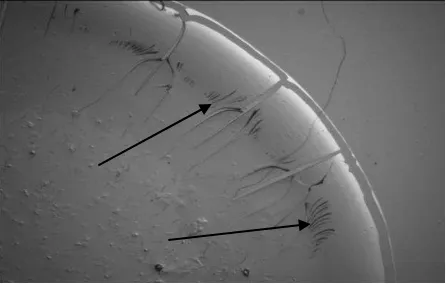
This paper presents algorithms to detect crescent structures in the images of blood serum facies and cervical mucus facies. Such a marker indicates the symptoms of ischemic disease. This marker in blood blood serum facies (Figures 1 and 2) has the form of long hooped bands, resembling a crescent. Rather often
such bands overlap with crosswise short folds (Figure 1). Crescent formations may appear without short folds (Figure 2). Crescent structures in cervical mucus facies consist of short semicircular lines arranged in groups (Figures 3 and 4).
Figure 1. Crescent structures in blood serum facies with short folds.
So crescent structures can be of a different shape, that is the main problem of their algorithmic detection. Therefore, in the process of recognition algorithm development, visual marker analysis was conducted first of all in order to identify their special peculiarities. After that, the ways of algorithmic detection of these peculiarities were found. The decision about the presence of the marker was made, if some part of an image contained its signs.
The International Archives of the Photogrammetry, Remote Sensing and Spatial Information Sciences, Volume XLII-2/W4, 2017 2nd International ISPRS Workshop on PSBB, 15–17 May 2017, Moscow, Russia
This contribution has been peer-reviewed.
We should note that only qualified health care professional can make a final diagnosis, and computer facies analysis is only an auxiliary method. Its task is to detect images, in which certain markers are evident. Therefore, it is not necessary to find all the markers of a given type in the image. It is enough to detect at least one of them and to display a message. It will signal the operator to carry out a more thorough analysis of this image. In fact, it is necessary to analyze all the images and select those with the crescent structures. From this perspective, we evaluate efficiency of the developed algorithms.
Figure 2. Crescent structures in blood serum facies without short folds.
Figure 3. Crescent structures at bound of cervical mucus facies.
Figure 4. Crescent structures between radial cracks of cervical mucus facies.
2. ALGORITHM OF CRESCENT STRUCTURES DETECTION IN BLOOD SERUM FACIES
Visual analysis of crescent structures in blood serum facies allows us to distinguish their common peculiarities:
1) they are long smooth lines;
2) they are located a short distance from each other; 3) there is a jump in brightness at the crescent structure
boundary, but it is not as strong as in the case of radial cracks;
4) they have high anisotropy – their brightness changes more rapidly crosswise than longwise.
To distinguish a jump in brightness at crescent structure boundarie (peculiarity 3), let’s apply wavelet analysis (Daubechies, 1992). Each next image of a two-dimensional wavelet transformation allocates one low-frequency LL and two high-frequency components LH, HL of the original image
I
i,j:.
The low-frequency component (LL) is actually twice as little as the original image; it is shown in Figure 2. High-frequency components distinguish vertical (LH), horizontal (HL) and diagonal (HH) jumps in brightness in the original image. can be applied to solve the problem. Let’s reduce the obtained LL component to the binary form with threshold 0. Using the sliding window, let’s calculate the number of points, in which the binary image value is equal to 1 (white color). In case, the number of points exceeds the threshold level, which is equal to 1/3 of the number of points in the window, then point values in the window are taken as 0 (black color). Then, tracing the outline (Gonzalez and Woods, 2008), let’s distinguish the The International Archives of the Photogrammetry, Remote Sensing and Spatial Information Sciences, Volume XLII-2/W4, 2017
2nd International ISPRS Workshop on PSBB, 15–17 May 2017, Moscow, Russia
This contribution has been peer-reviewed.
boundaries of the white areas L . In case, the boundary length i
is less than 40, we delete the points at the boundary and inside it. Also, it is necessary to exclude radial cracks (very long dark lines in the facies image) from consideration, i.e. we exclude from consideration such boundaries, which length exceeds the preset threshold. In this case, we consider radial cracks to be pixels, which brightness is less than 10% brightness distribution quantile of the entire image. The points obtained are excluded from further consideration. The result of these operations is shown in Figures 7 and 8.
Figure 6. Wavelet-transformation LH.
Figure 7. False point deletion and drawing lines Hj on HL.
Let’s now use peculiarity 4, namely, high anisotropy. We consider the anisotropic index
v V
W
/
, (2)
where V
var(
Lg)
/
|
Lg|
;v
var(
Lper)
/
|
Lper|
;Lg is a rectilinear interval with the length
|
Lg|
,which is parallel to the image gradient;
Lper is a rectilinear interval with the length
|
Lper|
,which is perpendicular to Lg ;
var(L
)
is the variation on interval L, which is calculated as a moduli sum of brightness differences at points of the interval, which are situated 5 pixels from each other.Figure 8. False point deletion and drawing lines Gj on LH.
The midpoints of these intervals are located at the cross point of lines Gj and L or i Hj and L . Thus, the anisotropy index is i
the ratio of the maximum variance (in the direction of the gradient) to the minimum one (in the perpendicular direction). If anisotropy index W exceeds the preset threshold, then we make a conclusion that there is high anisotropy at the cross points, otherwise the obtained lines are excluded from further consideration.
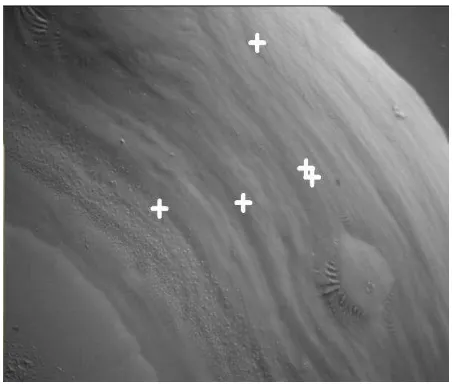
The points, which remain after the abovementioned rejection, correspond to all four attributes, so we make a decision that there exist crescent structure that pass through these remaining points. In Figure 9 the detected crescent structures are marked with crosses.
Figure 9. Detected crescent structures. The International Archives of the Photogrammetry, Remote Sensing and Spatial Information Sciences, Volume XLII-2/W4, 2017
2nd International ISPRS Workshop on PSBB, 15–17 May 2017, Moscow, Russia
This contribution has been peer-reviewed.
3. THE DETECTION OF CRESCENT STRUCTURES IN CERVICAL MUCUS FACIES
Visual analysis of cervical mucus facies, like in Figures 3 and 4, reveal the following characteristics of crescent structures:
1) they are located near the facies border between radial cracks;
2) they are of a much lower brightness in comparison with the background;
3) their form resembles a crescent – short semicircular lines approximately parallel to each other;
4) they are arranged in groups at a relatively short distance to each other.
The algorithms for detecting crescent structures in cervical mucus facies is similar to the case of detecting in blood serum facies with some specifications.
While isolating contours, removing false points and radial cracks, erosion and dilatation procedures were applied (Gonzalez and Woods, 2008). The bypass method is used to distinguish boundaries in dark areas that do not belong to the radial cracks in the skeleton.
Approximation by circles using the least square method was used to detect the crescent shaped areas within the selected boundaries. Detection of semicircular areas and their grouping by size and location was conducted. Each group must contain at least three constructed circles, centers of which are located at a relatively short distance from each other. If there was at least one such group in the image, we made a conclusion that there were crescent structures in the facies.
4. EXPERIMENTAL RESULTS
As it was mentioned above, it is not necessary to find all the markers in the image. It is enough to detect at least one of them and to display a message. It will signal the operator to carry out a more thorough analysis of this image. Thus, it is necessary to analyze all the images and detect images which contain crescent structures. From this perspective, we evaluate efficiency of the developed algorithms.
To determine the algorithm efficiency 583 blood serum and cervical mucus facies images were processed. The probability of correct detection of images with crescent structures was 92.7% in blood serum facies and 100% in cervical mucus facies. False detection of images, which did not contain crescent structures, was 8.5% of blood serum facies and 9.8% of cervical mucus facies images.
The described algorithms were implemented as a program. The program processes image files, displays a message on presence or absence of the markers, and denotes the detected markers in the image with conventional signs. The processing speed is 3 images per minute. This program can be used for early ischemia diagnostics.
5. CONCLUSION
The algorithms for detecting crescent structures in the blood serum and cervical mucus facies images are proposed in this paper. This marker is a sign of ischemia, and it can be used for early medical diagnostics. Detection and recognition is performed according to the attributes of this marker. Statistical tests showed that almost all of images with crescent structures
were detected, while the probability of false detection was low. The processing speed is 3 images per minute, which is sufficient for using this algorithm in medical institutions when mass health examination is conducted.
ACKNOWLEDGEMENTS
The work was supported by Russian Foundation of Basic Research (Grant No. 16-41-732041).
REFERENCES
Bolen, H.L., 1942. The blood pattern as a clue to the diagnosis of malignant disease. J Lab Clin Med, 27, pp. 1522-1536.
Daubechies, I., 1992. Wavelets. CBMS-NSF. Series in Appl. Math., SIAM Publ., Philadelphia.
Gonzalez, R.C., Woods R.E., 2008. Digital image processing. 3rd Ed. Prentice Hall.
Khonina S.N., Kotlyar V.V., Soifer V.A., Dvoryanova Т.P., 1995. Optical-digital method for detecting distortions of microcrystal structure on a tear crystallogram. Proceedings SPIE, vol. 2363, pp. 249-255.
Kraevoy, S.A., Koltovoy, N.A., 2016. Diagnosis using a single drop of blood. Biofluid crystallization, Moscow-Smolensk, https://koltovoi.nethouse.ru/. In Russian.
Krasheninnikov, V.R., Kopylova, A.S., 2011. Identification of pectinate structures in images of blood serum facies. Pat Rec Im An, 21(3), pp. 508-510.
Krasheninnikov, V.R., Kopylova, A.S., 2012. Algorithms for automated processing images blood serum facies. Pat Rec Im An, 22(4), pp. 583-592.
Kupriyanov, A.V., Ilyasova, N.Yu., Khramov A.G., 2005. Ophthalmic pathology diagnostics using textural features of the lachrymal fluid crystal images. Pat Rec Im An, 15(4), pp. 675-660.
Shabalin, V.N., Shatokhina, S.N., 2001. Morphology of human biological fluids. Khrizostom, Moscow. In Russian. The International Archives of the Photogrammetry, Remote Sensing and Spatial Information Sciences, Volume XLII-2/W4, 2017
2nd International ISPRS Workshop on PSBB, 15–17 May 2017, Moscow, Russia
This contribution has been peer-reviewed.