CAN RECONSTRUCTED LAND SURFACE TEMPERATURE DATA FROM SPACE
PREDICT A WEST NILE VIRUS OUTBREAK?
V. Andreoa,∗, M. Metzb, M. Netelerc, R. Ros`ad, M. Marcantonioe, C. Billinisf, A. Rizzolid, A. Papag
a
Dept. of Earth Observation Sciences. ITC - Faculty of Geo-Information Science
and Earth Observation. University of Twente. Enschede, The Netherlands - [email protected] bGRASS GIS Development Team. Berlin, Germany - [email protected]
c
Mundialis GmbH & Co. KG. Bonn, Germany - [email protected] dDepartment of Biodiversity and Molecular Ecology, Research and Innovation Centre,
Fondazione Edmund Mach, San Michele allAdige (TN), Italy (roberto.rosa, annapaola.rizzoli)@fmach.it e
Department of Pathology, Microbiology, and Immunology, School of Veterinary Medicine, University of California, Davis, USA - [email protected]
f
Laboratory of Microbiology and Parasitology, University of Thessaly. Karditsa, Greece - [email protected] gArboviruses Reference Laboratory, Aristotle University of Thessaloniki, Thessaloniki, Greece - [email protected]
Commission IV, WG IV/4
KEY WORDS:West Nile Virus outbreaks, Greece, Land Surface Temperature, MODIS, GRASS GIS, Time series analysis
ABSTRACT:
Temperature is one of the main drivers of ecological processes. The availability of temporally and spatially continuous temperature time series is crucial in different research and application fields, such as epidemiology and control of zoonotic diseases. In 2010, several West Nile virus (WNV) outbreaks in humans were observed in Europe, with the largest number of cases recorded in Greece. Human cases continued to occur for four more years. The occurrence of the 2010’s outbreak in Greece has been related to positive anomalies in temperature. Currently available remote sensing time series might provide the temporal and spatial coverage needed to assess this kind of hypothesis. However, the main problem with remotely sensed temperature are the gaps caused by cloud cover. With the objective of testing the former hypothesis, we reconstructed daily MODIS Land Surface Temperature (LST) data and derived several indices that are known or hypothesized to be related to mosquito populations, WNV transmission or risk of disease since they might constitute proxies for favoring or limiting conditions. We present the first results of the comparisons of time series of LST-derived indices among locations with WNV human cases and municipalities with and without reported WNV infection in Greece between 2010 and 2014.
1. INTRODUCTION
West Nile virus (WNV) is one of the mosquito-borne flavivirus most widely distributed in the world. The virus causes a vari-ety of symptoms to humans: from an asymptomatic infection to severe and even fatal encephalitis (Petersen et al., 2013). Wild birds are the major reservoirs of the virus and the main transmis-sion route is throughCulexmosquito-vectors. Most patients with WNV infections do not present any symptoms or only display mild flu-like symptoms, but in some cases people develop severe illness involving the central nervous system (Marka et al., 2013). Human cases have been reported from several countries since the 1960s. However, the frequency of reported outbreaks with severe symptoms has increased over the last 15–20 years (Calistri et al., 2010), especially in Europe and the United States.
In 2010, several WNV outbreaks in humans were observed all over Europe, however the largest number of cases was recorded in Greece (Danis et al., 2011). After that, human cases were reported for four more years, during a transmission cycle that goes from June to September (Hadjichristodoulou et al., 2015). The first cases in 2010 were reported in northern Greece (central Macedonia) near the city of Thessaloniki. In subsequent years, the disease further spread both southwards and eastwards, and cases were reported even in the highly-populated Greek capital city of Athens. More than 600 laboratory confirmed cases and 73
∗Corresponding author
deaths were reported between the years 2010 and 2014, making this outbreak the largest of WNV disease in Europe (Pervanidou et al., 2014).
Several factors may be involved in the determination of a WNV outbreak onset. Environmental conditions affecting both avian reservoir hosts and the mosquito vector populations, as well as human behavior and habitat modifications, may regulate WNV amplification and subsequently trigger an outbreak (Gibbs et al., 2006). The environmental conditions associated with the onset of WNV human cases in Europe, despite being investigated by multiple studies, are partly unknown (Paz and Semenza, 2013, Tran et al., 2014, Marcantonio et al., 2015, Semenza et al., 2016). The deficiency of complete and homogeneous continental-wide datasets is one of the underlying reasons for this lack of knowl-edge. On the contrary, datasets collected at a more local scale, even though representative of only a fraction of the European continent, may provide more robust results. These results may, in certain instance, be transferred to the continental scale.
Paz and Semenza, 2013, Tran et al., 2014, Marcantonio et al., 2015). These variables, though related to WNV human cases, might be acting indirectly through their effects over birds or mosquito populations, and over virus amplification. In the case of mosquito-borne pathogens such as WNV, higher than usual tem-peratures are known to influence vector competence, to acceler-ate virus replication within mosquitoes (extrinsic incubation pe-riod, EIP), to boost mosquitoes reproduction rates, and to prolong their breeding season (Gibbs et al., 2006, Paz and Albersheim, 2008). As such, temperature is one of the main environmental factors addressed when studying vector-borne viruses carried by mosquitoes (Paz and Albersheim, 2008, Bisanzio et al., 2011, Ros et al., 2014, Chaskopoulou et al., 2016).
The occurrence of the 2010’s emergence of WNV in Greece has been indeed related to positive anomalies in temperature that year (Danis et al., 2011). Even though some attempts have been made to test this hypothesis, they have been based on either sparse data from meteorological stations (Paz et al., 2013) or on data de-rived from coarse spatial and temporal temperature models that do not match the time frame of Greece WNV outbreaks (Vali-akos et al., 2014). Currently available remote sensing time series, however, might provide the temporal and spatial coverage needed to better assess the previous hypothesis.
The MODIS LST sensor, on board of Terra and Aqua satellites, registers temperature four times a day with a spatial resolution of approximately 1 km. Recently, NASA made publicly available a new re-processed version 6 of their products, providing sev-eral improvements with regards to previous versions. However, the main problem with remotely sensed temperature is the occur-rence of gaps, mostly caused by cloud cover. Hence, data must be reconstructed, i.e. gap filled in order to be useful (Neteler, 2010, Metz et al., 2014). In this sense, long standing FOSS4G such as GRASS GIS (Neteler et al., 2012, GRASS Development Team, 2017) provides at present more tools than ever to easily handle and process hundreds of thousands of maps and fill gaps in remote sensing time series (Gebbert and Pebesma, 2014, Geb-bert and Pebesma, 2017, Metz and GRASS Development Team, 2017a, Metz and GRASS Development Team, 2017b, Metz and GRASS Development Team, 2017d).
Given that temperature is one of the main drivers of ecological processes related to vector-borne viruses carried by mosquitoes and that we have the data and tools available to get temporally and spatially continuous temperature time series, our question is then: Can MODIS LST (and derived LST indices) inform us about spa-tial and temporal trends or changes in temperature that might have contributed to the occurrence of WNV outbreaks in Greece? Here we present a first approach to the problem, however our ultimate goal is to study and model the relationship of different environ-mental variables and the incidence of human WNV infections in Greece. In this first paper, we present a yearly analysis of LST and derived related variables in sites with reported cases, with the intention of identifying temperature related differences in the pe-riods before and after the first outbreak and municipalities with and without reported cases.
2. MAIN BODY
2.1 Materials and Methods
2.1.1 Data used: Our study area is Greece which has a surface of 131.957 km2. For the reconstruction of satellite
data however, we used a larger area which boundaries are: North: 42°1’12”N, East: 15°24’6”E, South: 34°41’47”N, West: 34°23’53”E. We used the daily LST Day and Night from MOD11A1 and MYD11A1 version 6 products (1 km of spa-tial resolution) from January 1st, 2003 to December 31st, 2016. The emissivity band in the MODIS LST products and the 30 arc-seconds Global Multi-resolution Terrain Elevation Data 2010 (GMTED2010) were used as covariates. Greek meteorological stations from the public database Global Summary of the Month (GSOM1) were used as validation set for the obtained recon-structed LST.
The epidemiological dataset was obtained by the European Cen-tre for Disease Prevention and Control (ECDC). The data con-sisted of the geo-location (latitude and longitude coordinates) of all WNV fever and encephalitis human cases reported in Greece from July 2010 to September 2014.
2.1.2 LST data processing: The raw data downloaded from MODIS LP DAAC site (4 images per day) were mosaicked and reprojected to Lambert azimuthal equal area (EU LAEA, EPSG code 3035) with nearest neighbor as the resampling method. Nearest neighbor sampling was chosen in order to preserve the bit pattern in the quality assessment (QA) band. The reprojected MODIS LST values were then filtered with the mandatory and LST QA band allowing for an LST error lower than 3 K. Our LST reconstruction method consisted of temporal interpolation to partially reconstruct Day and Night daily LST (fill short gaps in time) followed by spatial interpolation with covariates and outlier filtering to fill remaining gaps in space. This was done for each time series separately (MOD11A1 Day and Night, MYD11A1 Day and Night). Finally, we aggregated the four reconstructed time series into a daily time series in order to obtain average, min-imum and maxmin-imum temperature estimates. To asses the quality of the reconstruction, we compared our reconstructed monthy ag-gregated time series with data from Greek meteorological stations from the GSOM database.
2.1.3 Data analysis: We aggregated the daily reconstructed LST time series into months, seasons and years by means of arithmetic average. This yielded the average temperature, the av-erage minimum temperature and the avav-erage maximum temper-ature for each period (i.e.: month, season, year). Seasons were defined as follows: winter (December, January, February), spring (March, April, May), summer (June, July, August) and autumn (September, October, November). We then estimated a series of biologically meaningful variables that are known or hypoth-esized to affect mosquito populations, WNV transmission or dis-ease risk. The thresholds used for deriving LST-related variables were drawn from bibliography on both mosquitoes survival and development and virus amplification (Rueda et al., 1990, Vino-gradova, 2000, Reisen et al., 2006, Tachiiri et al., 2006, Gong et al., 2011, Ciota et al., 2014). The following list of annual indices were derived from reconstructed daily LST:
• Annual averages of minimum, maximum and average tem-perature.
• Annual standardized anomalies for average, maximum and minimum temperature: estimated as the difference between the yearly value and the long-term average, divided by the long-term standard deviation of the corresponding variable. For example: (Tavi - Average(Tav)) / sd(Tav), where iis 2003, 2004... 2016 andTavis the average temperature. 1
• Annual spring warming: estimated as the slope of the linear regression of daily average temperature from February 1stto June 30th.
• Annual autumnal cooling: estimated as the slope of the lin-ear regression of daily average temperature from October 1st to December 31st.
• Annual number of days with minimum temperature≤0° C. • Annual absolute minimum temperature.
• Annual first day with minimum temperature≤0° C. • Annual number of summer days: estimated as the count of
days with average temperature≥25° C.
• Annual number of tropical nights: estimated as the count of days with average minimum temperature≥20° C. • Annual number of days with average temperature≥20 and
≤30° C, which is assumed to be the optimal development temperature for mosquitoes.
• Maximum annual number of consecutive summer days (av-erage temperature≥25° C).
• Maximum annual number of consecutive freezing days (av-erage minimum temperature≤0° C).
• Average temperature of mosquito growing season: esti-mated as the average of daily average temperature between April 1stand October 31steach year.
• Average temperature of WNV transmision season: esti-mated as the average of daily average temperature between June 1stand October 31steach year.
• Length, start and end dates of mosquito growing season: following literature we chose a threshold of 10° C to iden-tify annually the potential mosquito growing season and ob-tain the corresponding length, start and end dates (Metz and GRASS Development Team, 2017c).
• Length, start and end dates of WNV transmision season: fol-lowing literature we chose a threshold of 14.3° C to annually identify the potential WNV transmission season and obtain the corresponding length, start and end dates (Reisen et al., 2006, Metz and GRASS Development Team, 2017c). • Number of potential mosquito cycles per year and start and
end date of each cycle: These indices were estimated by ac-cumulating biologically effective degree days (BEDD) from the 4 maps per day reconstructed LST time series. Thresh-olds used for accumulation were 10° C and a cutoff of 34° C (Rueda et al., 1990, Vinogradova, 2000). After the accumulation was done, the next step was to identify the po-tential occurrence of mosquito cycles (from egg hatching to adult emergence), followingCulexmosquitoes degree days (DD) requirements (Tachiiri et al., 2006), obtain length, start and end date. Finally, we aggregated the time series containing indicators of each cycle, to get the maximum number of potential cycles per pixel.
• Number of potential EIP per year and start and end date of each cycle: These indices were estimated as described above, but using different base and cutoff temperatures: 14.3° C and 32° C, respectively (Reisen et al., 2006, Kil-patrick et al., 2008). The identification of potential EIPs was done following (Reisen et al., 2006), who propose a median EIP of 109 DD.
In the case of annual number of days with minimum tempera-ture≤0° C, the annual absolute minimum temperature and the first day of the year with minimum temperature below 0° C, the aggregation is performed considering a year starting in July and finishing in June of the following calendar year, since we were interested in catching the first colds in autumn that might affect the end of growing season in mosquitoes and their survival.
All the described variables were extracted for the geo-locations with reported WNV human cases, to obtain annual time series of each variable and compare the environment before and after the first WNV outbreak. We spatially aggregated the environmental LST-derived indices (average, median, standard deviation, mini-mum and maximini-mum) by municipalities to compare conditions in areas with and without reported WNV infection.
2.1.4 Software: MODIS data was dowloaded by means of pyModis library2. All the remote sensing processing and analysis was done in GRASS GIS (GRASS Development Team, 2017). For plots and comparisons, GRASS vector maps were read into R (R Core Team, 2017) through the rgrass7 and sp packages (Bi-vand, 2016, Bivand et al., 2013). Further plots were done with ggplot2 and spacetime packages (Wickham, 2016, Bivand et al., 2013).
2.2 Results
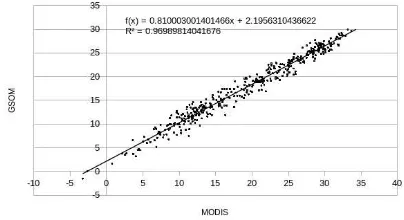
2.2.1 Comparison of LST with GSOM: We used a linear model to address the relation between monthly reconstructed av-erage LST and and avav-erage monthly temperature from GSOM meteorological stations in the period 2003-2016. The global R2 was 0.97 (Figure 1).
Figure 1. Linear regression model between monthly reconstructed average LST [° C] and monthly average temperatures [° C] from meteorological stations in Greece
(GSOM database). Period 2003-2016.
Since the average temperature in GSOM data is estimated as:
T AV G = (T M AX−T M IN)/2, GSOM TAVG should be lower in the summer months and higher in winter because in sum-mer, days are longer than nights, and in winter, days are shorter than nights. Monthly average MODIS LST therefore, based on 4 values should thus be more accurate than GSOM based on 2 values. Besides, for summer months average reconstructed LST shows higher values than GSOM data and for winter months, the opposite, as expected (Figure 2).
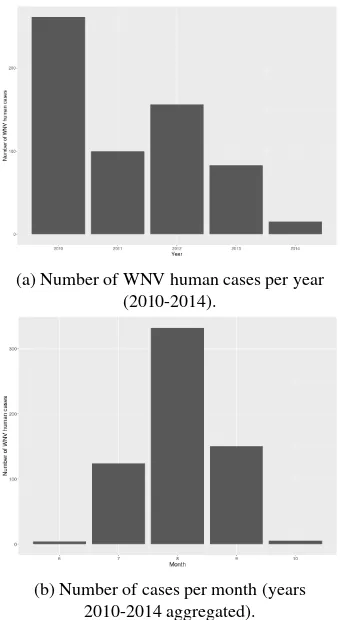
2.2.2 WNV human cases: In 2010, Greece underwent an epidemic of WNV infection, with 262 clinical human cases. The virus overwintered and spread across the country in the following years (2011-2014) resulting in more than 600 confirmed human infections (Chaskopoulou et al., 2016). Figure 3 shows the the temporal distribution of the total number of cases per year and per month (years aggregated) between 2010 and 2014.
2.2.3 LST-derived indices: Time series of LST-derived in-dexes in localities with reported WNV human infections showed (in most cases) high variability among localities when split per
2
Figure 2. Monthly differences between monthly reconstructed average LST [° C] and monthly average temperatures [° C] from
meteorological stations in Greece (GSOM database). Period 2003-2016.
(a) Number of WNV human cases per year (2010-2014).
(b) Number of cases per month (years 2010-2014 aggregated).
Figure 3. WNV human cases in the period 2010-2014 in Greece. Source: European Centre for Disease Prevention and Control
(ECDC).
year of onset of the infection. Especially in the cases of 2012 and 2013 infections, a bimodal distribution was observed, coinciding with the fact that during those years there were two main different areas in which the outbreaks took place (Central-East Macedonia and Attica). When aggregated by municipality, no clear pattern was observed either. For example, Figure 4 shows average LST in municipalities with more than 25 human cases.
Yearly LST indexes (average, minimum average, maximum av-erage) did not show any notorious difference in localities with reported human cases, nor when spatially aggregated in munici-palities. However, when considering the standardized anomalies, we observed that 2010 showed positive anomalies in the average
Figure 4. Yearly average LST [° C] in municipalities with more than 25 human cases. References: 17: Nestos, 20: Avdera, 22:
Topeiros, 23: Thessaloniki, 38: Alexandrias, 44: Pella.
minimum temperature during 2010, i.e.: minimum temperatures were higher that year (Figure 5). This trend was consistent and continuous from 2012 onwards and it is also evident when re-viewing individual points, i.e: the locality with the highest num-ber of cases (Figure 6).
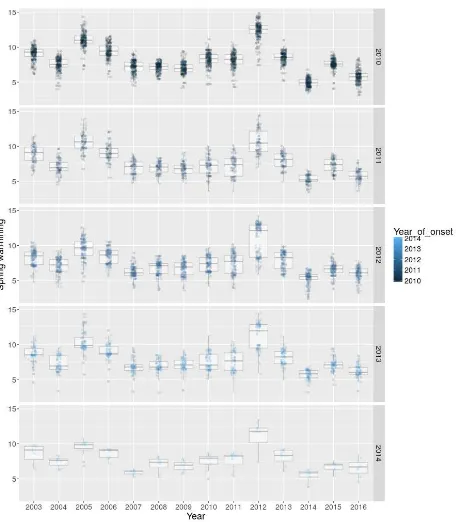
The slope of spring warming was steeper in 2010, compared to that in 2009, being highest (steepest) in 2012, year of the second most important number of reported WNV human cases (Figure 7). Autumnal cooling in 2010 (slope of September, October and November average temperatures, after the main outbreak) was the steepest cooling observed, both in time and space (not shown).
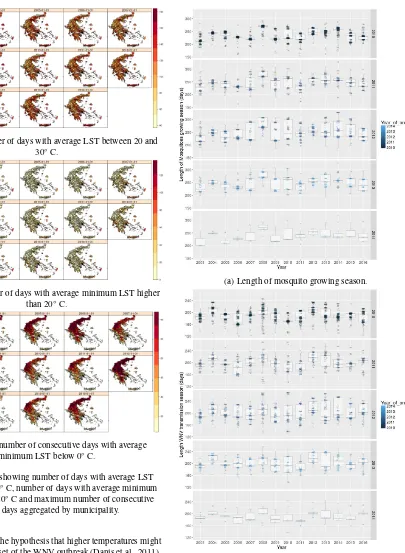
The number of days with average temperature higher than 20 and lower than 30° C was higher in 2010 in Pella municipality (the municipality with the highest number of reported cases). This index also showed higher values for Pella municipality the year before the main outbreak. On the other hand, the number of trop-ical nights (days with minimum temperature higher than 20° C) appeared to be higher in 2010 in localities in which the first out-break took place. This was also visible at municipality level both for 2010 and 2012. Moreover, the number of freezing days and the maximum number of consecutive freezing days in 2009-2010 (July 2009 - June 2010) appeared to be lower in the localities and municipalities where the main outbreak was observed later in 2010 (Figure 8).
Both the number of potential mosquito cycles and WNV EIPs, as well as the length of the mosquito growing season and the WNV transmission season were higher in 2012 and 2013. The differ-ences in the length of seasons are visible in both the localities with reported human cases and when aggregated by municipali-ties. For the localities with reported cases in 2010, however, there seems to be three groups that depict different season lengths (Fig-ure 9).
2.3 Discussion
(a) Standardized anomalies in the average minimum LST for locations with WNV reported cases split by year of onset.
(b) Standardized anomalies in the average minimum LST per municipality (2003-2016). Standardized anomalies per pixel were
aggregated with the arithmetic average by municipality.
Figure 5. Standardized anomalies in the average minimum LST.
Figure 6. Yearly average LST [° C] in the locality with the highest number of reported WNV human cases between 2010
and 2014.
coexist in the same area) should be related to temperature, too. It is well-known that higher than usual temperatures might
in-Figure 7. Spring warming slope for locations with WNV reported cases split by year of onset.
fluence vector competence, accelerate virus replication within mosquitoes (shortening the extrinsic incubation period, EIP), boost mosquito reproduction rates, and extend their breeding sea-son (Gibbs et al., 2006, Paz and Albersheim, 2008).
Remotely sensed temperatures come handy when resources are limited and meteorological stations scarce (most of the times). Sensors such as MODIS on board of Terra and Aqua satellites provide temporally and spatially continuous data. However, re-motely sensed LST is not free of problems, the main issue is the occurrence of gaps in the data due to cloud cover. Hence, LST needs to be gap-filled first to become fully useful (Neteler, 2010, Metz et al., 2014). A general evaluation of our recon-struction showed good global relationship between air temper-ature from meteorological stations in Greece and reconstructed MODIS LST. Since it was previously suggested that climatic con-ditions (higher temperatures, especially) might have favored the occurrence of the 2010 WNV outbreak in Greece (Danis et al., 2011) and Europe in general (Paz and Semenza, 2013), our main objective was to identify temperature-related variables that might show temporal differences in localities with reported human cases and spatio-temporal differences in areas with and without WNV infection. To this aim we estimated diverse indices that are known or hypothesized to represent limiting or favoring conditions for either mosquito or pathogen development and survival based on thresholds reported in the literature (Rueda et al., 1990, Vino-gradova, 2000, Reisen et al., 2006, Tachiiri et al., 2006, Gong et al., 2011, Ciota et al., 2014).
(a) Median number of days with average LST between 20 and 30° C.
(b) Median number of days with average minimum LST higher than 20° C.
(c) Maximum number of consecutive days with average minimum LST below 0° C.
Figure 8. Indices showing number of days with average LST between 20 and 30° C, number of days with average minimum
LST higher than 20° C and maximum number of consecutive freezing days aggregated by municipality.
are consistent with the hypothesis that higher temperatures might have favored the onset of the WNV outbreak (Danis et al., 2011). In the same line, we observed that the slope of spring warming was steeper in 2010 compared to the previous years. Further-more, indices that depict counts of days with conditions supposed to be limiting (number of consecutive freezing days) or favorable (number of tropical nights and number of days with temperature between 20 and 30° C) for mosquitos and WNV, also showed differences consistent with the former hypothesis. Moreover, the number of days with average temperature between 20 and 30° C showed higher values in Pella municipality the year before the main outbreak (i.e.: 2009), when bird surveys in hunting areas al-ready detected WNV antibodies (Valiakos et al., 2014). The num-ber of potential mosquito cycles and EIPs as well as their median length however, only showed marked differences for years 2012 and 2013. Meanwhile 2012 showed more than 150 human cases,
(a) Length of mosquito growing season.
(b) Length of WNV transmission season.
Figure 9. Length (in days) of mosquito and WNV seasons.
in 2013 the number of human cases was reduced to approximately one half of the previous year. This reduction in the number of cases, while conditions seem favorable might be highly likely re-lated to human behaviour, control measures over mosquito pop-ulations (Papa et al., 2013, Chaskopoulou et al., 2016) and in-munization of the bird and human population (Papa et al., 2013, Hadjichristodoulou et al., 2015, Chaskopoulou et al., 2016).
WNV human cases showed that a higher temporal resolution (i.e.: monthly or weekly) might be needed to better understand the relationship of outbreak onset and number of cases (or inci-dence) with temperature derived indices. Furthermore, if these indices are intended to be used to trigger early warnings and pub-lic health campaigns, higher temporal resolution is necessary to detect more specific and relevant differences. Notwithstanding this, reconstructed LST and the derived indices allowed us to identify likely meaningful differences that support the hypothe-sis of a favorable environment (even when spatially aggregated by municipalities with the average or the median).
Though some differences in LST-derived indices were observed both when considering localities and municipalities, some others are only (or better) observed in one or the other spatial scale. Not only that but there seems to be also an important level of variabil-ity in time series of localities and municipalities with reported cases (Figure 4). Furthermore, it might be possible as well that different variables or combination of variables might have trig-gered the onset of cases each year. The absence of reported WNV human cases in 2015 and 20163, even though the environmental conditions seemed to be propicious, remain an open question.
On the other hand, some other variables relevant for mosquito populations such as humidity, amount of sun hours, availability of breeding sites and vegetation, might interact with temperature and should be included in models as well. For example, the area in which the first outbreak started in the region of Central Mace-donia is characterized by many wetlands, rivers and lakes that serve as stopping areas for migratory birds during their migration from overwintering areas in Africa to breeding sites in northern Europe and viceversa (Chaskopoulou et al., 2016). The relative importance of different variables has not yet been evaluated.
The lack of differences in some indices at municipality level might be due to the loss of detail caused by the spatial aggrega-tion of already rather coarse data, a phenomenon known as mod-ifiable area unit problem (MAUP) (Atkinson and Graham, 2006). However, since the exact infection sites are unknown and only localities are reported, a resolution of 1 km might compensate for the mismatch between mosquito habitats and uncertainty in the precise identification of the infection sites. On the other hand, it might be as well that the thresholds used to derive some of the variables were not the optimal ones, since most of them (if not all) were obtained under laboratory conditions. This is an aspect that requires further investigation and especially, field surveys or experiments.
3. CONCLUSIONS
This study highlights the usefulness of remote sensing, and es-pecially LST, for the characterization and quantification of tem-perature changes. The major advantage of MODIS LST is that it captures climatic conditions with short revisit time and global coverage. This might reduce the need of meteorological field data, especially when resources are limited. Satellite tracking of LST is indeed useful and might be complementary to mosquito and virus surveillance and monitoring activities. Furthermore, the set of LST indices derived might be extended to other areas and vector-borne pathogens whose ecology and biology is strongly connected to temperature variations. Besides the application and the results per se, which are yet preliminar, the relevance of this
3
http://ecdc.europa.eu/en/healthtopics/west_nile_ fever/West-Nile-fever-maps/Pages/historical-data.aspx
study is also related to the use of open data and free and open source software that provide the advantage of automatization and reproducibility.
Further research is planned to actually relate this environmental information with WNV cases occurrence and incidence, in order to identify the temporal windows relevant to enhance the monitor-ing and early warnmonitor-ing systems to trigger vector control programs and public education campaigns. We intend to continue working in this topic by using higher temporal resolution in response and independent variables, other remotely sensed variables and mod-els that allow the inclusion of spatial and temporal dependencies.
ACKNOWLEDGEMENTS
The authors would like to thank NOAA for making the GSOM data freely available. We are grateful to the NASA Land Pro-cesses Distributed Active Archive Center (LP DAAC) for making the MODIS LST data available. We thank ECDC for providing the data on WNV human cases. Finally, we would like to thank all developers and contributors of FOSS.
REFERENCES
Atkinson, P. M. and Graham, A. J., 2006. Issues of Scale and Uncertainty in the Global Remote Sensing of Disease. In: A. G. a. D. J. R. Simon I. Hay (ed.),Advances in Parasitology, Global Mapping of Infectious Diseases: Methods, Examples and Emerg-ing Applications, Vol. 62, Academic Press, pp. 79–118.
Bisanzio, D., Giacobini, M., Bertolotti, L., Mosca, A., Balbo, L., Kitron, U. and Vazquez-Prokopec, G. M., 2011. Spatio-temporal patterns of distribution of West Nile virus vectors in eastern Pied-mont Region, Italy.Parasites & vectors4(1), pp. 230.
Bivand, R., 2016. rgrass7: Interface Between GRASS 7 Geo-graphical Information System and R. R package version 0.1-9.
Bivand, R. S., Pebesma, E. and Gmez-Rubio, V., 2013. Applied Spatial Data Analysis with R. Springer New York, New York, NY.
Calistri, P., Giovannini, A., Hubalek, Z., Ionescu, A., Monaco, F., Savini, G. and Lelli, R., 2010. Epidemiology of West Nile in Europe and in the Mediterranean basin. The Open Virology Journal4, pp. 29–37.
Chaskopoulou, A., L’Ambert, G., Petric, D., Bellini, R., Zgomba, M., Groen, T. A., Marrama, L. and Bicout, D. J., 2016. Ecol-ogy of West Nile virus across four European countries: review of weather profiles, vector population dynamics and vector control response.Parasites & Vectors9(1), pp. 482.
Ciota, A. T., Matacchiero, A. C., Kilpatrick, A. M. and Kramer, L. D., 2014. The Effect of Temperature on Life History Traits of Culex Mosquitoes.Journal of medical entomology51(1), pp. 55– 62.
Danis, K., Papa, A., Theocharopoulos, G., Dougas, G., Athana-siou, M., Detsis, M., Baka, A., Lytras, T., Mellou, K., Bonovas, S. and Panagiotopoulos, T., 2011. Outbreak of West Nile Virus Infection in Greece, 2010.Emerging Infectious Diseases17(10), pp. 1868–1872.
Gebbert, S. and Pebesma, E., 2014. A temporal GIS for field based environmental modeling.Environmental Modelling & Soft-ware53, pp. 1–12.
Gebbert, S. and Pebesma, E., 2017. The GRASS GIS temporal framework. International Journal of Geographical Information Science0(0), pp. 1273–1292.
Gong, H., DeGaetano, A. T. and Harrington, L. C., 2011. Climate-based models for West Nile Culex mosquito vectors in the Northeastern US. International Journal of Biometeorology
55(3), pp. 435–446.
GRASS Development Team, 2017. Geographic Resources Anal-ysis Support System (GRASS) Software, Version 7.2. Open Source Geospatial Foundation, USA.
Hadjichristodoulou, C., Pournaras, S., Mavrouli, M., Marka, A., Tserkezou, P., Baka, A., Billinis, C., Katsioulis, A., Psaroulaki, A., Papa, A., Papadopoulos, N., Mamuris, Z., Tsakris, A., Kre-mastinou, J. and MALWEST Project, 2015. West Nile Virus Seroprevalence in the Greek Population in 2013: A Nationwide Cross-Sectional Survey.PLOS ONE10(11), pp. e0143803.
Kilpatrick, A. M., Meola, M. A., Moudy, R. M. and Kramer, L. D., 2008. Temperature, Viral Genetics, and the Transmis-sion of West Nile Virus by Culex pipiens Mosquitoes. PLOS Pathogens4(6), pp. e1000092.
Marcantonio, M., Rizzoli, A., Metz, M., Ros, R., Marini, G., Chadwick, E. and Neteler, M., 2015. Identifying the Environmen-tal Conditions Favouring West Nile Virus Outbreaks in Europe.
PLOS ONE10(3), pp. e0121158.
Marka, A., Diamantidis, A., Papa, A., Valiakos, G., Chaintoutis, S., Doukas, D., Tserkezou, P., Giannakopoulos, A., Papaspy-ropoulos, K., Patsoula, E., Badieritakis, E., Baka, A., Tseroni, M., Pervanidou, D., Papadopoulos, N., Koliopoulos, G., Tontis, D., Dovas, C., Billinis, C., Tsakris, A., Kremastinou, J., Had-jichristodoulou, C. and project, f., 2013. West Nile Virus State of the Art Report of MALWEST Project. International Journal of Environmental Research and Public Health10(12), pp. 6534– 6610.
Metz, M. and GRASS Development Team, 2017a. r.hants. Geo-graphic Resources Analysis Support System (GRASS) Software, Version 7.2. Open Source Geospatial Foundation, USA.
Metz, M. and GRASS Development Team, 2017b. r.resamp.tps. Geographic Resources Analysis Support System (GRASS) Soft-ware, Version 7.2. Open Source Geospatial Foundation, USA.
Metz, M. and GRASS Development Team, 2017c. r.seasons. Geographic Resources Analysis Support System (GRASS) Soft-ware, Version 7.2. Open Source Geospatial Foundation, USA.
Metz, M. and GRASS Development Team, 2017d. r.series.lwr. Geographic Resources Analysis Support System (GRASS) Soft-ware, Version 7.2. Open Source Geospatial Foundation, USA.
Metz, M., Rocchini, D. and Neteler, M., 2014. Surface Tem-peratures at the Continental Scale: Tracking Changes with Re-mote Sensing at Unprecedented Detail. Remote Sensing6(5), pp. 3822–3840.
Neteler, M., 2010. Estimating Daily Land Surface Temperatures in Mountainous Environments by Reconstructed MODIS LST Data.Remote Sensing2(1), pp. 333–351.
Neteler, M., Bowman, M. H., Landa, M. and Metz, M., 2012. GRASS GIS: A multi-purpose open source GIS. Environmental Modelling & Software31, pp. 124–130.
Papa, A., Xanthopoulou, K., Tsioka, A., Kalaitzopoulou, S. and Mourelatos, S., 2013. West Nile virus in mosquitoes in Greece.
Parasitology Research112(4), pp. 1551–1555.
Paz, S. and Albersheim, I., 2008. Influence of Warming Tendency on Culex pipiens Population Abundance and on the Probability of West Nile Fever Outbreaks (Israeli Case Study: 20012005).
EcoHealth5(1), pp. 40–48.
Paz, S. and Semenza, J., 2013. Environmental Drivers of West Nile Fever Epidemiology in Europe and Western AsiaA Re-view.International Journal of Environmental Research and Pub-lic Health10(8), pp. 3543–3562.
Paz, S., Malkinson, D., Green, M. S., Tsioni, G., Papa, A., Danis, K., Sirbu, A., Ceianu, C., Katalin, K., Ferenczi, E., Zeller, H. and Semenza, J. C., 2013. Permissive Summer Temperatures of the 2010 European West Nile Fever Upsurge. PLOS ONE8(2), pp. e56398.
Pervanidou, D., Detsis, M., Danis, K., Mellou, K., Papanikolaou, E., Terzaki, I., Baka, A., Veneti, L., Vakali, A., Dougas, G. and others, 2014. West Nile virus outbreak in humans, Greece, 2012: third consecutive year of local transmission.Euro Surveill19(13), pp. pii20758.
Petersen, L. R., Brault, A. C. and Nasci, R. S., 2013. West Nile Virus: Review of the Literature.JAMA310(3), pp. 308.
Pradier, S., Leblond, A. and Durand, B., 2008. Land Cover, Landscape Structure, and West Nile Virus Circulation in Southern France.Vector-Borne and Zoonotic Diseases8(2), pp. 253–264.
R Core Team, 2017. R: A Language and Environment for Statisti-cal Computing. R Foundation for StatistiStatisti-cal Computing, Vienna, Austria.
Reisen, W. K., Fang, Y. and Martinez, V. M., 2006. Effects of temperature on the transmission of west nile virus by Culex tarsalis (Diptera: Culicidae). Journal of Medical Entomology
43(2), pp. 309–317.
Ros, R., Marini, G., Bolzoni, L., Neteler, M., Metz, M., Delucchi, L., Chadwick, E. A., Balbo, L., Mosca, A., Giacobini, M. and others, 2014. Early warning of West Nile virus mosquito vector: climate and land use models successfully explain phenology and abundance of Culex pipiens mosquitoes in north-western Italy.
Parasites & vectors7(1), pp. 269.
Rueda, L. M., Patel, K. J., Axtell, R. C. and Stinner, R. E., 1990. Temperature-dependent development and survival rates of Culex quinquefasciatus and Aedes aegypty (Diptera: Culicidae). Jour-nal of Medical Entomology27(5), pp. 892–898.
Semenza, J. C., Tran, A., Espinosa, L., Sudre, B., Domanovic, D. and Paz, S., 2016. Climate change projections of West Nile virus infections in Europe: implications for blood safety practices. En-vironmental Health15(S1), pp. S28.
Tachiiri, K., Klinkenberg, B., Mak, S. and Kazmi, J., 2006. Pre-dicting outbreaks: a spatial risk assessment of West Nile virus in British Columbia. International Journal of Health Geographics
5, pp. 21.
Tran, A., Sudre, B., Paz, S., Rossi, M., Desbrosse, A., Cheva-lier, V. and Semenza, J. C., 2014. Environmental predictors of West Nile fever risk in Europe. International journal of health geographics13(1), pp. 26.
Valiakos, G., Papaspyropoulos, K., Giannakopoulos, A., Birt-sas, P., Tsiodras, S., Hutchings, M. R., Spyrou, V., Pervanidou, D., Athanasiou, L. V., Papadopoulos, N., Tsokana, C., Baka, A., Manolakou, K., Chatzopoulos, D., Artois, M., Yon, L., Hannant, D., Petrovska, L., Hadjichristodoulou, C. and Billinis, C., 2014. Use of Wild Bird Surveillance, Human Case Data and GIS Spatial Analysis for Predicting Spatial Distributions of West Nile Virus in Greece.PLoS ONE9(5), pp. e96935.
Vinogradova, E. B., 2000. Mosquitoes Culex pipiens pipiens: taxonomy, distribution, ecology, physiology, genetics and control. PenSoft, Sofia.