38
Jurnal Geocelebes Vol. 1 No. 2, Oktober 2017, 38 – 42
RELATIONSHIP BETWEEN SEQUENCE STRATIGRAPHY
AND RELATIVE SEA-LEVEL CHANGES
Jamaluddin1, K. K. Romuald Sohores1,Muhammad Fawzy Ismullah M.2* 1Geological Engineering Department, School of Geosciences, China University of Petroleum, Qingdao, China
2
Geophysics Department, Science and Mathematics Faculty, Hasanuddin University, Makassar, Indonesia
*Penulis koresponden. Alamat email: [email protected]
Abstract
The continuous sea-level rise will result in conditions where the level of accommodation space is greater than that of sediment supply produced under transgression conditions. When the sea level reaches its maximum point, the sedimentation rate will exceed the sea level rise and aggrades becomes more dominant progradation will result in new High-Stand System Tract (HST) condition. Keywords: Accommodation, Sea level changes, Sedimentation, Sequence, Stratigraphy
Introduction
A concept introduced in the mid 70’s by a pioneer like Peter Vail, Sequence Stratigraphy appears to be a recent methodology in geology domain for stratigraphic interpretations. It can also be defined as a study of stratigraphic sequences in time and space which consist of repetitively organized facies assemblages and strata, bounded by unconformable or/ and conformable surfaces. The sequence of stratigraphy is the study of the relationship between rocks in a recurrent chronostratigraphic framework and composed by units of rock stratigraphy associated with a genetic scare limited by a plane of erosion or a non-deposition or a correlative whole plane. The basic unit of the stratigraphic sequence is the sequence, which is limited by its unrelatedness and correlative alignment.
The rationale for this research is accommodation space and relative sea
level change. Accommodation space is the space or volume available and allows for the accumulation of sediment (Jervey, 1988). The accommodation space of the marine environment lies between sea level and the seafloor where the formation and change of space is a direct function of relative sea level change. Relative sea level change is a function of sea level changes due to eustatic and tectonic. Changes in sea level occur over a broad range of temporal and spatial scales, with the many contributing factors making it an integral measure of climate change (Milne et al., 2009).
The primary contributors to contemporary sea level change are the expansion of the ocean as it warms and the transfer of water currently stored on land to the ocean, particularly from land ice (glaciers and ice sheets) (Church et al., 2011).
39 basement or a plane in the seabed sediment pile (Posamentier et al. 1988). Sea level change is the influence of a combination of eustasy, a decrease of the basin (tectonic, charge, and compaction) and sediment supply. Typically, a relative change occurs on a local or regional scale, but never in a global scale. Subsidence, removal of bedrock, sedimentary compaction involving the relative sea level reference plane, and tectonic changes, all may cause relative sea level change. Sea water levels can relatively rise due to subsidence, compaction and/ or decreased frustration; Sea level can be relatively decreased due to the lifting and/ or raising of eustation.
Therefore, for a better understanding, ideas like systems tracts, para-sequence and sequence boundaries were developed. However, sequence stratigraphy is sometimes associated with some Earth phenomena like global sea level changes (eustasy) and global tectonic process (subsidence) allowing to explain the filling up of the sedimentary basin (accommodation space) by sediments.
Data collection method
We started our data collection on April 1st, 2017 at 2.50 pm and it took us one month to gather all our data. Therefore, during that period, at the same time, every day, we were supposed to be at the seashore to measure the sea level and collect also other data like sea temperature, the ambient temperature, wind speed, wind direction and the humidity.
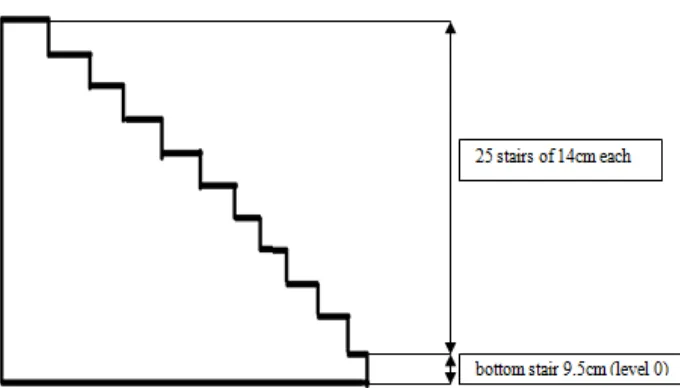
We have some stairs built at the seashore. We took our initial point at the bottom of the stairs cause the first day all the stairs were visible. The tide was so low that we can even see the sediment deposited at the bottom of the stairs. There were 26 stairs: 25 stairs of 14 cm each and the last one at the bottom was 9.5cm as shown in Figure
2. So in total, our maximal height at the
sea shore corresponding to the maximal value that the sea can reach when it rises was 359.5 cm or about 3.60 m ((25x14) +9.5).
40 level registered during our measurement campaign (276 cm). From that day, the sea level started dropping again until day 16 and reached (36.5 cm). From day 16 to day 25 it went up again until 270.5 cm before going down until the day 30 where the water level registered was 18 cm.
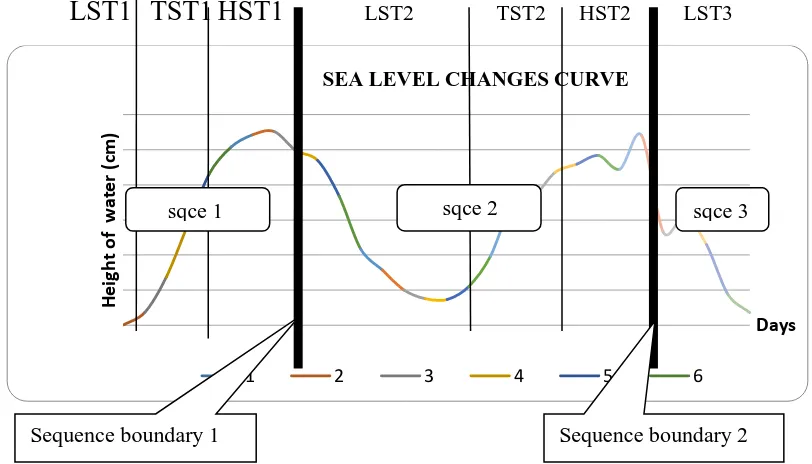
According to that result, we can easily divide the sea level curve into 3 parts corresponding to 3 sequences.
From day 1 to day 8
We have the end of the first low stand system tract (LST 1), the first transgressive system tract (TST 1) and the first high-stand system tract (HST 1). In general, we can say that this first part shows us the complete transgressive and high-stand system tract where the sea level was rising rapidly until the highest level (276 cm).
From day 8 to day 16 LST 2 and the second transgressive system tract (TST 2) followed by the second high-stand system tract (HST 2).
From day 25 to day 30
As the sea level is dropping again that part can be seen as a start of the third sequence, starting with the third low-stand system tract (LST3).
Low-stand systems tract forms a regression arrangement containing sediment deposits during the relative sea level decline, continuous still stand, and up to relatively slow sea level rise during regression on the shoreline can still be maintained. Low-stand systems tract is located above the sequence boundary, which is the visible unevenness of the surface of the shelf and correlative conformity toward the sea. Low-stand System Tract (LST) is formed when the sea level rises rapidly and steadily at the maximum sea level decrease and when the sea water begins to rise slowly. This system will produce precipitated deposits on the beach and delta and river deposits that fill the incised valley.
41
LST1 TST1 HST1
LST2 TST2 HST2 LST3Figure 2 Below show us the different sequence divisions.
The continuous sea level rise results in a condition where the level of accommodation space is greater than the sediment supply produced under transgression conditions. The deposition area of the sedimentation change towards the terrain results in retro-gradation para-sequence. Transgressive surface will be characterized by more marine sediments compared with non-marine sediment. Sediments deposited under these conditions result in a transgressive system tract. The transgressive system tract will consist of alluvial and coastal deposits, shallow marine deposits, offshore marine deposits, but excluding submarine-fan sediments. When sea level reaches its maximum point, sedimentation rate will exceed sea level rise and aggradation becomes more dominant progradation will result in new high-stand system tract condition.
Factor influencing the sea level changes
The goal of this data collection was to figure out, what was the other factor influencing the changes noticed in sea
level height. Until now, we know that the main causes of rising and dropping of the tide are:
1. Change of the volume of ocean water, 2. Change of the volume of ocean basin, 3. Attraction forces by the moon and the
sun on the Earth.
Therefore, we will correlate the data of the other collected with the sea level data.
Figure 3 Sea level and temperatures (ambient &
water)
According to sea level and temperatures graph, we can see that the falling and rising of sea level do not depend on sea water temperature neither to the ambient temperature.
H
e
ig
h
t
o
f
w
a
te
r
(c
m
)
Days SEA LEVEL CHANGES CURVE
1 2 3 4 5 6
Sequence boundary 1 Sequence boundary 2
42 Figure 4 Sea level and wind speed
The wind speed does not follow a constant evolution. It was not predictable. On contrary, for the sea level, the evolution follows a path which can allow us to predict the following value. They are both independent.
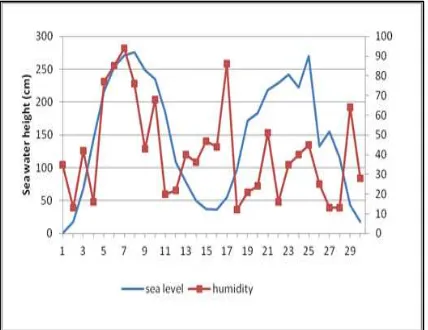
The evolution of humidity is different from the sea level. Here, it also difficult to predict the following value of humidity.
Figure 5 Sea level and Humidity.
Conclusions
By understanding this new concept in
geology, which is “Sequence
Stratigraphy”, Geologist were able to
explain or bring answers to some geological issues which were difficult to explain in the past. Sequence stratigraphy appears to be a modern approach to analyzing sedimentary rock record by knowing the way, the time and how that sediment were deposited.
It is true that its applications today in petroleum research are multiple and vary from the resolving detail of petroleum reservoir to the connectivity between depositional system but we must say that it took many years for a lot of scientists to adopt this concept.
References
Church, J.A., and White, N. J. 2011. Sea -Level Rise from The Late 19th to
The Early 21st Century. Surveys in
Geophysics 32 585-602.
Jervey, M.T. 1988. Quantitative
Geological Modeling of
Siliciclastic Rock Sequence and
Their Seismic Expression. 47-69.
Milne, G.A. 2009. Identifying the Causes
of Sea-Level Change. Nature
Geoscience 2.
Posamentier, H. W., Jervey, M.T., Vail, P. R. 1988. Eustatic Controls on
Clastic Deposition Sea Level
Changes (An Integrated
Approach). SEPM Special