Cite this:
Mol. BioSyst., 2012,
8
, 1760–1774
Short- and long-term dynamic responses of the metabolic network
and gene expression in yeast to a transient change in the nutrient
environment
w
Duygu Dikicioglu,
aWarwick B. Dunn,
bDouglas B. Kell,
cBetul Kirdar
aand
Stephen G. Oliver*
adReceived 26th October 2011, Accepted 9th March 2012
DOI: 10.1039/c2mb05443d
Quantitative data on the dynamic changes in the transcriptome and the metabolome of yeast in response to an impulse-like perturbation in nutrient availability was integrated with the metabolic pathway information in order to elucidate the long-term dynamic re-organization of the cells. This study revealed that, in addition to the dynamic re-organization of thede novobiosynthetic pathways, salvage pathways were also re-organized in a time-dependent manner upon catabolite repression. The transcriptional and the metabolic responses observed for nitrogen catabolite repression were not as severe as those observed for carbon catabolite repression. Selective up- or down regulation of a single member of a paralogous gene pair during the response to the relaxation from nutritional limitation was identified indicating a differentiation of functions among paralogs. Our study highlighted the role of inosine accumulation and recycling in energy homeostasis and indicated possible bottlenecks in the process.
Introduction
The survival of a free-living microorganism depends on its ability to deal with changes in its physicochemical environment, including variations in temperature,1 pH2 or nutrient availability.3–8 Appropriate mechanisms to deal with such changes rapidly and effectively were developed over evolutionary time, and the expression of more than half of yeast’s genes were observed to change in response to environmental perturbations.2,9 The mechanism underlying the sensing and utilization of glucose, which is the most abundant monosaccharide on earth and the most preferred carbon source for most organisms, are of particular importance and were studied extensively (see ref. 10).
Glucose has a central role in yeast metabolism, both as both a nutrient and a regulator. The introduction of excess glucose into the growth environment of respiring Saccharomyces cerevisiaecells switches metabolism to the fermentative mode, inducing various signal transduction pathways and causing several proteins to be activated or inactivated. Carbon catabolite repression is the ability of glucose to repress the expression of several genes that encode enzymes involved in gluconeogenesis, respiration, mitochondrial development, and the utilization of carbon sources other than glucose, fructose or mannose.11The regulation and control determined by the availability of glucose may be exerted at different levels; however, its main effect was reported to take place at the transcriptional level.12The increase in growth rate evoked by the introduction of glucose into a carbon-limited culture was observed to cause a distinctive restructuring of yeast’s transcriptional profile. The Snf1-Rgt pathway was reported to have a specific, but limited, role in this response; while protein kinase A and Sch9p were reported to be responsible for triggering more than 90% of all glucose-induced changes, including those in response to the respiratory and gluconeogenic pathways.13 Similarly, an increase in the glucose concentration of the growth medium was associated with a pronounced drop of adenine nucleotide content and the interconversion of adenine nucleotides and inosine was proposed to provide a rapid and energetically cost-efficient mechanism of adaptation.14
Ammonium is assimilated in yeast via its conversion into glutamate.15Although glutamate, itself, is the most preferred
a
Department of Chemical Engineering, Bogazici University,
Bebek 34342, Istanbul, Turkey. E-mail: [email protected], [email protected]; Fax: +90 212 287 2460;
Tel: +90 212 359 7126
bManchester Centre for Integrative Systems Biology,
University of Manchester, M1 7DN, Manchester, United Kingdom. E-mail: [email protected]; Fax: +44 161 30 64556; Tel: +44 161 30 65146
cSchool of Chemistry and Manchester Interdisciplinary Biocentre,
University of Manchester, M1 7DN, Manchester, United Kingdom. E-mail: [email protected]; Fax: +44 161 306 4556; Tel: +44 161 306 4492
d
Cambridge Systems Biology Centre & Department of Biochemistry, University of Cambridge, CB2 1GA, Cambridge, United Kingdom. E-mail: [email protected]; Fax: +44 1223 766 002; Tel: +44 1223 333 667
wElectronic supplementary information (ESI) available: See DOI: 10.1039/c2mb05443d
Molecular
BioSystems
Dynamic Article Links
nitrogen source for the organism, laboratory strains of yeast grow very well on ammonium as the principal source of nitrogen.16Thus, on ammonium-based media, yeast cells were reported to decrease the activities of enzymes involved in the utilization of poor nitrogen sources—a phenomenon termed nitrogen catabolite repression. The cellular response to sudden changes in the amount of available ammonium has received much less attention from researchers than the equivalent transition for glucose (see above).
The transient response of yeast metabolism to rapid changes in nutrient availability was investigated in several studies. The transient short-term transcriptome and metabolome response of yeast cells to glucose perturbation in continuous cultures was investigated by Kresnowati et al.,3 who interpreted the changes at both the transcriptomic and metabolomic levels to reflect two major responses: one involving the transition from fully respiratory to respiro-fermentative metabolism, and the other involving the preparation for an increase in growth rate.3 The transient transcriptional response to switching carbon sources between galactose and glucose was investi-gated by Ronen and Botstein4and their experimental design proved useful in elucidating the dynamic regulatory networks controlling central carbon metabolism.
In order to investigate nitrogen catabolite repression, ter Schureet al.17studied the transient response to an ammonium impulse in glutamine-limited yeast cultures. Their study revealed that the ammonium-induced repression did not represent a general stress response but, rather, the relief of ammonium limitation was a specific signal for nitrogen catabolite regulation.
Our previous studies of the transcriptomic responses of yeast cells to the sudden and transient relief of nutrient limitation encompassed both glucose and ammonium responses.8When a glucose impulse was applied to a glucose-limited chemostat culture, we found significant changes in the levels of trans-cripts related to translation; glucose transport; oxidation/ reduction; nucleobase, nucleoside and nucleotide metabolic processes; cell death; aerobic respiration; ion transport; sulphur assimilation; glycolysis; carboxylic acid metabolism; and oxidative phosphorylation. The transcriptomic response of ammonium-limited yeast cells to an ammonium impulse indicated significant changes in the expression of genes involved in translation and its regulation; ribosome biogenesis; non-coding RNA metabolism and processing (including rRNA biosynthesis and maturation); as well as transition metal ion transport. Thus, for both nutrient impulses, there was a response that could be attributed to the increase in growth rate,18 and another that was specific to the nutrient whose limitation was relieved.19
In the present study, we have used an integrative approach to map long-term dynamic transcriptome and metabolome data onto metabolic pathways and used such maps to reveal the important molecular events that occur in particular path-ways at distinct temporal phases following the transient relief of nutrient limitation. We believe this to be the first study to encompass both the transcriptomic and metabolomic responses of yeast from an initial nutrient-limited steady state, through the period of nutrient excess engendered by a glucose or ammonium impulse, to the re-establishment of
the nutrient-limited steady state. Thus we have followed the complete cycle of famine, feast, and famine to which yeast is thought to be frequently exposed in nature.20,21
Results and discussion
In order to understand the dynamic re-organization of cellular metabolism in response to the sudden and transient relaxation of glucose or ammonium limitation, a systems-based inte-grative approach, which maps both transcriptome and meta-bolome data onto metabolic pathways, was used to reveal the key molecular events that occur in specific pathways in distinct time periods following the perturbation. Re-organization of the pathways associated with the central carbon metabolism and energy homeostasis in yeast were given particular atten-tion in this investigaatten-tion.
Analysis of the time-course data revealed that the transcriptomic response following nutritional perturbations was organized into distinct periods or phases.8The dynamic transcriptional and metabolic responses were clustered into five distinct hierarchical phases in the case of the glucose impulse. These phases, which were formed by the clusters into which the responses fell, reflected the temporal organisation of the total response: the steady-state phase (CP1), the seconds phase (CP2), the minutes phase (CP3), the early-hours response (the first three hours) (CP4) and the late-hours response (the rest of the sampling period) (CP5). On the other hand, a delayed response to the perturbation of the ammonium level was observed rather than the immediate response found for the glucose perturbation. Instead, the phases developed such that the first sample collected (the 20th second sample) was clustered together with the steady states (NP1), the remaining two samples collected in the first minute (40th and 60th seconds) were clustered together with the first two samples collected within the first hour (8th and 16th minutes) (NP2), the remaining two samples collected in the first hour (24th and 32nd minutes) were clustered together with the response obtained in the early hours (the first three hours) (NP3). The rest of the sampling period was clustered together separately from the other phases (NP4) (Fig. 1, ESI 1).
In response to the impulse-like addition of ammonium, the endometabolome profiles of cells from the nitrogen-limited steady states were clustered together and the samples taken on an hourly basis could be separated in a cluster distinct from that of the samples taken within the first minute. On the other hand, the samples taken within the first hour following the ammonium impulse were distributed between these two clusters (Fig. 1). The dynamic profiles of the intermediary products related to lipid and sphingolipid metabolism, and the phosphatidylinositol signalling pathway displayed a decrease in concentration until NP3, and then recovered as the second steady state was approached. The intracellular concentrations of amino acids and their precursors decreased sharply following the ammonium impulse and recovered gradually as the extra-cellular ammonium supply gradually became limiting again.The drop in the amino acid concentration in response to ammonium impulse varied between 2-10 fold.
The difference in log. mean values between each response period and the steady-state period (corresponding to fold changes in the transcript and metabolite levels) were calculated for the phases CP2-CP5 in the case of the glucose impulse
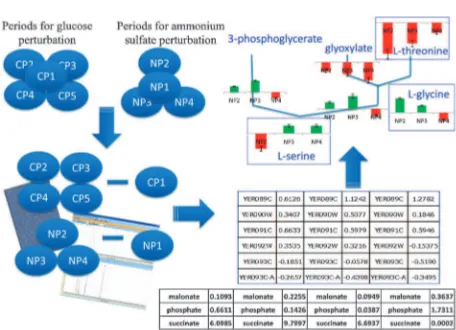
experiment and for NP2-NP4 in the case of ammonium impulse experiment. These differences were mapped onto the selected metabolic pathways (see Fig. 2 for a summary of the procedure). Consideration of each phase separately enabled a dynamic overview of the cellular decision-making processes involved in pathway selection (Fig. 3).
Changes in the central carbon metabolism
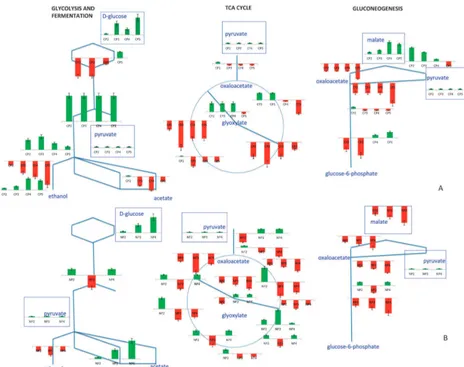
a. Response to the glucose impulse.Introduction of glucose into a carbon-limited steady-state culture evoked changes in the levels of both transcripts and metabolites involved in the TCA cycle, glycolysis, gluconeogenesis, and glucose fermenta-tion pathways. A down-regulafermenta-tion of the genes in the TCA cycle and an up-regulation of the glycolytic genes was observed and the transcriptional re-arrangement of the organism was directed towards ethanol productions. Several other studies have also described a switch towards a respiro-fermentative metabolism within 5 min upon addition of glucose into a continuous culture.3,14A strong and immediate down-regulation of the expression of the glucose utilizing genes;HXK1,HXK2 and GLK1 was observed upon addition of glucose. This immediate response remains unchanged for nearly an hour post-impulse, although these genes are up-regulated in the later phases of the experiment. Most of the genes that encode enzymes in the lower part of the glycolytic pathway were up-regulated during all phases compared to their expression levels at limiting glucose conditions. Walther et al.14 also reported an increase in the phosphorylated sugars of the glycolytic pathway following the release from glucose limita-tion, which was congruent with the present findings. From pyruvate, a critical cross-roads metabolite from which the flux may be directed towards either the TCA cycle or the fermenta-tion pathway through the enzymes encoded byPDC1,PDC5 and PDC6, the energy metabolism was observed to shift towards fermentation in response to the glucose perturbation. The up-regulation in the expression levels of PDC5 was
Fig. 1 Hierarchical organization of the transcriptomic response to the impulse like addition of glucose (A) or ammonium (B), the dynamic change in the concentration of the catabolite in its respective culture and the hierarchical clustering of the endometabolome in response to an impulse-like addition of glucose (C) and ammonium (D) into an ammonium-limited culture. The phases corresponding to each cluster are shown as P1, P2, P3, P4 and P5 in (A) and as P1, P2, P3 and P4 in (B).
Fig. 2 A schematic overview of the data-overlaying process. The geometric average of log2expression values and the arithmetic average
strikingly high enabling this shift. Kresnowati M. T. A. P. et al.3 also reported an up-regulation of PDC1 and PDC6 within 5 min of the addition of glucose into the medium of a carbon-limited culture growing on glucose. The pathway leading to ethanol production was prioritised through the up-regulation ofADH4 transcription, whereas the expression levels of the other alcohol dehydrogenases; ADH2, ADH3 andADH5remained low throughout the effect of the pulse. A similar down-regulation inADH5expression was previously reported.3 The ALD family of genes, involved in directing the relay of transcriptional information from the branch point indicated by acetaldehyde production along the trans-criptional relay of information towards the production of
acetic acid, were down-regulated mainly in CP3 and CP4 (Fig. 4, ESI 2).
Most of the genes encoding the enzymes of the TCA cycle were down-regulated throughout the effect of the pulse with the exceptions of the pyruvate carboxylase;PYC2, ligases of succinyl Co-A; LSC1 and LSC2, the aconitase; ACO2, the malate dehydrogenase; MDH1 and the isocitrate dehydro-genase; IDH2, which were slightly up-regulated in specific phases.DAL7of the glyoxylate shunt was strongly up-regulated until CP5. DAL7 was reported to be involved in allantoin degradation in purine catabolic processes.22The induction of this gene might have allowed the redirection of flux towards purine catabolism (Fig. 4).
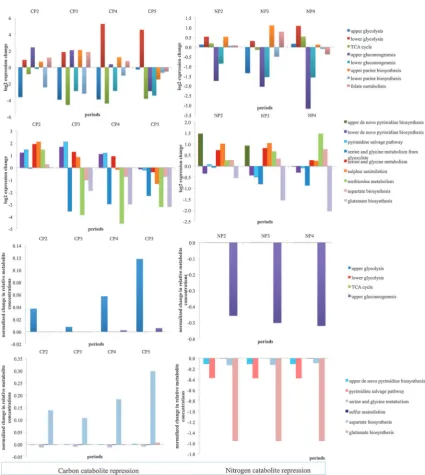
Fig. 3 General trends displaying the changes in the log2expression values of the genes in energy metabolism. The maximum changes in expression
The most pronounced down-regulation of the TCA cycle genes was observed during CP3. The expression levels of genes encoding subunits of the succinate dehydrogenase complex (SDH1, SDH2, SDH3 and SDH4) were all down-regulated throughout the effective period of the pulse.SDH1andSDH3 were previously reported to be down-regulated during carbon catabolite repression.3All of the identified and the measured metabolites, namely pyruvate, 2-oxoglutarate, succinate, fumarate and malate displayed slight accumulation in the cells in all periods except for the steady states. This might be the result of the down-regulation of genes that specify enzymes, which use these metabolites as intracellular intermediates (Fig. 4, ESI 3).
MAE1, catalyzing the production of pyruvate from malate, was up-regulated until CP5. The product of the reaction catalyzed by this enzyme, pyruvate, is also a precursor for the synthesis of several amino acids including leucine, isoleucine, valine and alanine in addition to being a key intermediate in
sugar metabolism.23SincePYC1, whose enzyme product plays arole in the conversion of pyruvate to oxaloacetate, and the malate dehydrogenase MDH2 were down-regulated throughout the effect of the impulse like addition of glucose andPYC2was down-regulated within minutes upon addition of glucose, it could be deduced that pyruvate was used as in the amino-acid production pathways upon relief from the glucose limitation as well as in ethanol production. The down-regulation of malate dehydrogenase (encoded byMDH2) and fructose 1,6-bisphosphatase (FBP1) upon addition of glucose following a long period of glucose limitation was in accordance with previous findings suggesting the degradation of the enzymes encoded by these genes by a vacuolar pathway24 (Fig. 4, ESI 4).
b. Response to the ammonium impulse. The impulse-like addition of ammonium to a steady-state nitrogen-limited culture also provoked changes in central carbon metabolism (Fig. 4B).
Genes involved in glycolysis were slightly up-regulated in NP2 and NP4 whereas they were down-regulated in NP3. Consequently, the relay of transcriptional information was conveyed towards both ethanol and acetate in NP2 and NP4 following the pyruvate branch point. On the other hand, in NP3, similar to the observations for carbon catabolite repres-sion, a strong down-regulation of the upper glycolytic genes; HXK1,HXK2andGLK1was observed as well as those of the aldehyde dehydrogenases;ALD4andALD6, thus limiting the direction of the flow of transcriptional message towards acetate production. Genes encoding the enzymes in the ethanol production pathway were slightly up-regulated in response to the addition of ammonium - except for ADH2, which was down-regulated throughout the period in which the impulse is effective (Fig. 4, ESI 2).
The expression levels of the TCA cycle genes were not constitutively up- or down-regulated in response to an ammonium impulse but they rather displayed phase-dependent expres-sion upon relaxation of ammonium limitation. The pyruvate carboxylase;PYC1was down-regulated upon the addition of ammonium with the effect on expression increasing in time. On the other hand, PYC2, its paralog, was down-regulated immediately at NP2 and was up-regulated in NP3, settling to its steady-state expression level in NP4. One of the genes for citrate synthesis; the dual citrate/methyl-citrate synthaseCIT3 and both malate dehydrogenase genes; MDH1 and MDH2 were down-regulated throughout the experiment; whereas the other citrate synthase genesCIT1andCIT2were only down-regulated in NP3 and NP4, taking more time for their expres-sion levels to decrease. Previous studies indicated a dramatic accumulation of acetate in the absence ofCIT3through the propionate metabolism in addition to glutamate and alanine. However, it was also reported that this metabolism was affected by CIT3only in the absence of glucose or glycerol as the carbon source.25The presence of glucose as the carbon source in the present study might have prevented an accom-panying accumulation of acetate, glutamate or alanine together with the down-regulation ofCIT3. A gene encoding a putative mitochondrial aconitase,ACO2, was slightly up-regulated and that for isocitrate lyase,ICL1, was down-regulated throughout the effect of the pulse. On the other hand,ACO1, the cytosolic counterpart of ACO2, was only up-regulated in NP2 with its expression decreasing in NP3 and NP4 (Fig. 4).
MLS1, enabling the glyoxylate shunt, was down-regulated throughout the effect of the impulse. MLS1 expression was previously reported as being repressed by glucose.26 During the ammonium perturbation, the constant supply of sufficient glucose, which was probably perceived by the cell as being in excess, would explain the repression of MLS1. The malate synthase, DAL7 was only down-regulated in NP2 and was then up-regulated in NP3 and NP4. It has been reported previously that DAL7was repressed under standard growth conditions.27 The introduction of ammonium might have created a temporary situation in which the environment was relieved from all stresses that were created by the limitation of ammonium as well as being supplemented with a sufficient (Or, perhaps, excessive) amount of glucose causing the down-regulation of the expression of that gene in NP2. Ammonium was used up during the course of the fermentation due to
the transiently increased growth rate and the loss by dilution that is intrinsic to continuous culture. Thus the medium gradually shifted back towards the limitation of the nitrogen source. In contrast to the observed during carbon catabolite repression, the intracellular malate concentration was lower following the impulse than it was during limitation during nitrogen catabolite repression. This might be due to the low flux from fumarate and glyoxylate as a result of the down-regulation ofMLS1andDAL7in NP2,MLS1andFUM1in NP3, andMLS1in NP4. This might indicate thatMLS1may be one of the most important factors determining malate accumulation (Fig. 4, ESI 3).
The expression of the gluconeogenic gene PCK1, whose protein product catalyses the conversion of oxaloacetate into phosphoenolpyruvate, decreased upon the addition of ammonium and this down-regulation was stronger in later period in the response to the addition of ammonium. The accumulation of oxaloacetate was prevented by directing the fluxes towards citrate production as an immediate response and the expression levels of the genes encoding the enzymes catalysing this reaction, the citrate synthases;CIT1andCIT2 increased. In NP3 and NP4, however, oxaloacetate accumula-tion would only be prevented through the activaaccumula-tion of the aspartate biosynthetic pathway and the up-regulation of AAT1supports this contention. Interestingly, a similar response to the relief from glucose limitation was observed for the malate dehydrogenase MDH2 and the fructose 1,6 bis-phosphatase FBP1. This might indicate that the cells perceived nutrient limitation followed by its abundance through the same mechanisms regardless of the identity of the nutrient; be it glucose or ammonium and this phenomenon requires further investigation (Fig. 4, ESI 4).
Re-organization of the nucleotide pools in response to catabolite repression
of adenine nucleotides and inosine facilitates the rapid and energy-efficient adaptation of the size of the AXP pool to changing environmental conversions. The accumulation and the recycling of inosine could be considered as a response to energy homeostatic perturbations under fermentative condi-tions. AXP concentrations were reported to recover quickly to about 80% of their initial levels within 5–10 min, whereas the GXP nucleotide concentration was reported to reach a new steady state that was significantly higher than that prior to the addition of glucose.14
Consistent with these studies, we also observed significant changes in the expression levels of the genes involved in glycolysis, oxidative phosphorylation, translation, and aspartate family amino-acid metabolic process as a response to the relaxation from both carbon and ammonium limitation.8In the present study, in order to shed light on the mechanisms that counter balance the reduction in AXP pools upon perturbation of energy homeostasis through a pulse injection of a major nutrient, the transcriptomic and the metabolomic data were mapped onto the metabolic pathways that were implicated to be involved in these processes in previous studies (Fig. 5).
Changes in the purine and pyrimidine biosynthetic pathways and their salvage pathways
a. Response to the glucose impulse.Since the tricarboxylic acid cycle becomes inactivated upon addition of glucose, the cells require the activation of alternate routes to satisfy their requirements for the purine nucleotides, ATP and GTP, to sustain the energy metabolism. The initial steps of thede novo synthesis of purine nucleotides were immediately activated as soon as glucose was introduced. The immediate up-regulation of the upper purine biosynthetic pathway upon glucose addition may be responsible for the accumulation of IMP,
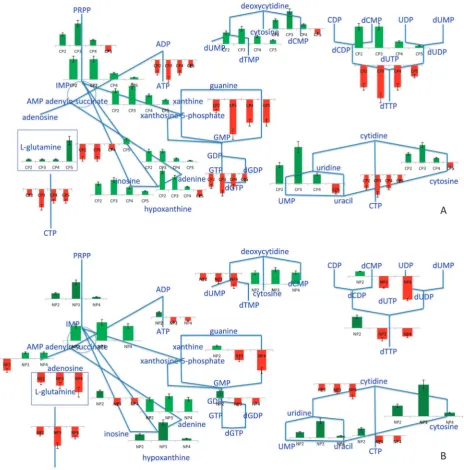
which was observed by Walther et al.14 This up-regulation was most pronounced during CP3. The observation of the up-regulation inADE12,ADE13andAMD1during CP2-CP4 indicated that the cyclic conversion of IMP to adenylosuccinate and AMP was possible. On the other hand, the up-regulation of SAH1, whose product catalyzes the release of adenine during methyl transfer from S-adenosyl-L-methionine to S-adenosyl-L-homocysteine, and the up-regulation of ADO1, which encodes the enzyme that converts adenosine to AMP, may provide an alternative route for the production of AMP. However, the production of ADP from AMP was compro-mised by the down-regulation of ADK1 andADK2 in CP2. The UMP kinase encoded by URA6, up-regulated in this perturbation throughout CP2-CP4, has been reported to compensate for the lack of function in ADK1.28This might have been used as an alternative route for ADP production. ADK1 and ADK2 were observed to become progressively up-regulated through CP3-CP5 enabling ADP synthesis from AMP. The accumulated IMP appeared to be converted first to XMP and finally to GMP, based on the transcriptional profiles of the enzymes encoded by the up-regulatedIMD3-IMD4and GUA1, respectively. GMP can then be converted to GDP by the product ofGUK1, which was observed to be up-regulated at all non-steady state phases of the experiment (Fig. 6).
On the other hand,YNK1, encoding the nucleoside diphos-phate kinase, catalysing the phosphorylation of ADP and GDP to ATP and GTP, respectively, was found to be down-regulated throughout the experiment. These results indicated that there might be some indirect route for the production of ATP and GTP when the tricarboxylic acid cycle becomes less active upon addition of glucose. One possibility might be an equilibrium shift towards ATP production in the presence of abundant AMP and ADP, throughADO1, or the up-regulation of the expression of guanylate kinase, GUK1 may catalyze the reaction between ADP and GDP to produce ATP. The produced GMP could then be recycled back to xanthosine-5-phosphate through GUA1, and thento IMP through IMD3 andIMD4(Fig. 7). Conversions between ADP and dADP, as well as between GDP and dGDP were identified to be active through the up-regulation of the transcription of genes RNR1, RNR2,RNR3 andRNR4 (Fig. 6). Additionally, the up-regulation ofAPT1,APT2 andAAH1may also account for the conversion of AMP to IMP, thenviaadenylosuccinate to adenine and then hypoxanthine.PNP1, which specifies purine nucleoside phosphorylase, was also found to be up-regulated. This enzyme catalyzes the reversible reactions between inosine and hypoxanthine as well as between adenine and adenosine. Therefore the accumulation of inosine within 5 min following glucose addition and a delayed accumulation of hypoxanthine within 10 min observed by Waltheret al.14can be explained in the light of these observations (Fig. 6).
SinceHPT1, encoding an enzyme that catalyses the conver-sion of hypoxanthine to IMP, was down-regulated at all non-steady state phases of the experiment, there are two possible ways to relieve the accumulation of hypoxanthine. Both of them require the conversion of hypoxanthine to xanthine as the first step and the latter’s conversion to uric acid. Although such an enzyme was identified in other fungi, including Aspergillusniger and Yarrowia lipolytica, the presence of a
similar enzyme could not be demonstrated in S. cerevisiae. A BLAST search of the S. cerevisiae genome29 using the amino-acid sequences of An03g01530, An04g05440 and 1.17.1.4 enzymes did not indicate the presence of any similar sequences inS. cerevisiae. However, it should be noted that the reactions of the purine salvage pathway in yeast have not been completely identified.30Waltheret al.,14for instance, included a similar potentially relevant reaction in the purine salvage pathway inS. cerevisiae based on the experiments that they have carried out using severalpspmutants. Since the conver-sion of xanthine to XMP was not possible due to the down-regulation ofXPT1, fluxes should be oriented from xanthine towards 5-ureido-4-imidazole carboxylate and later to glycine to be used in the superpathway to serine, threonine and glycine.
However, the detailed mechanisms and the enzymes catalyzing these reactions are, as yet, unknown. Another alternative route utilizing xanthine and hypoxanthine is purine catabolism, enabling the degradation of the purine compounds into uric acid, allantoin, urea and (later) into ammonium through the utilization of the gene products of DAL1, DAL2, DAL3 together withDUR1,2.31DAL1andDUR1,2were up-regulated at all non-steady state phases of the experiment.DAL2, on the other hand, was down-regulated at all non-steady state phases of the experiment andDAL3was up-regulated in CP2, CP4 and CP5, but was down-regulated in CP3. The reaction through Dal3p caused the accumulation of glyoxylate during the production of ammonium. As previously stated, a member of the glyoxylate shunt, Dal7p, may also take role in purine
catabolic processes22,32andDAL7was observed to be up-regulated during carbon catabolite repression (Fig. 6, ESI 5).
In CP5, almost all of the purine biosynthetic pathway components were down-regulated and, since the TCA cycle became active again, the ATP production necessary for respira-tion and maintenance would be supplied through that channel (Fig. 6, ESI 5).
Thede novobiosynthesis of pyrimidine ribonucleotides UTP and CTP fromL-glutamine was reduced, due to the observed
down-regulation ofURA3upon introduction of glucose into the steady-state glucose-limited culture. This effect, which was observed from the transcriptomic data, was persistent throughout the effective duration of the impulse. It was previously reported that the UXP and CXP profiles displayed a similar decrease in concentration to those observed for AXP and GXP pools upon the addition of glucose into its respective limited culture.3 Although the genes encoding the enzymes involved in the conversion of L-glutamine into
orotidine-5’-phosphate and the gene expression the minor orotate phos-phoribosyltransferase isozyme, URA5, were all up-regulated, thede novobiosynthetic pathway of pyrimidines appeared to be blocked by the down-regulation ofURA3throughout the phases during which the effect of the impulse-like addition of glucose persisted. This result may indicate that the de novo synthesis of UMP was reduced under these conditions. The up-regulation ofURA6, mediating theconversion of UMP to UDP, also the up-regulation ofFUR1, mediating the conver-sion of uracil to UMP may suggest the activation of the salvage pathway of pyrimidine nucleotides for the utilization of uracil, which was provided in the fermentation medium. FUR4, encoding uracil permease that mediates the uptake of uracil, was observed to be up-regulated in CP2 and CP3 and became down-regulated in CP4 and CP5. The presence of uracil was reported to result in the activation of uracil phosphoribosyltransferase (UPRTase) encoded by FUR1 and the repression of genes involved in the pyrimidine biosynthesis.33 The genes, which are associated with the pyrimidine salvage pathway, were found to be up-regulated through CP2-CP4, with expression peaking in CP3. The conversion of UDP and
CDP to UTP and CTP was also compromised by the down-regulation ofYNK1in CP2-CP4. However,URA7andURA8, whose gene products catalyze the conversion of UTP to CTP, were activated during CP2-CP5. Additionally,DUT1, encoding the enzyme which catalyzes the conversion of dUTP to dUMP, was up-regulated (ESI 6, ESI 7).
Alternative routes for the production of UTP and CTP are therefore required. One of two possibilities to overcome this obstacle would be the presence of as yet undefined gene products compensating for the role of YNK1. The other alternative may be an equilibrium shift among XDPs and XTPs to favour XTP generation in times of cellular need. The flux from UDP might be split, with some being used for the generation of ATP that, in turn, could be used for the conversion of UDP to UTP and further to CTP. It is interesting to note that although uracil was provided in the medium to ensure that it was always present in excess to compensate for the auxotrophy of the strain, the salvage pathways of pyrimidine biosynthesis was still responsive to the impulse-like addition of glucose to the fermentation medium, and hence to increased growth rates. Previous studies reported increased transcription of genes from the pyrimidine pathway with increased growth rate18and the findings of the present study accord with this (Fig. 6).
b. Response to the ammonium impulse.In response to the introduction of ammonium into a nitrogen-limited culture, the genes taking role in thede novosynthesis of purine nucleotides, as well as the salvage pathways for purines and their nucleo-sides, were up-regulated immediately in NP2 except for ADE16, XPT1 and RNR3. The upper purine biosynthetic pathway remained up-regulated through periods NP2-NP4, similar to what has been observed during carbon catabolite repression. This is most pronounced in NP3, which is later than in glucose repression. The genes that were required for the synthesis of ADP during NP2-NP4 were also up-regulated. The observation of up-regulation ofIMD4,GUA1andGUK1 indicated that GDP may also be synthesized during NP2-NP4. One of the most pronounced changes in NP3 was observed in the down-regulation ofYNK1taking a role in the production of XTPs from XDPs and dXDPs in a similar, but delayed, response to that of carbon catabolite repression of metabolism. As the effect of the impulse of ammonium began to be lost in NP4, the up-regulation of the genes in upper purine biosynthetic pathway became less pronounced (Fig. 6, ESI 5).
The effect of the addition of ammonium into a nitrogen-limited culture was observed to cause similar but less pronounced changes in thede novosynthesis of pyrimidine ribonucleotides pathway than the response to the addition of glucose to a C-limited culture. The most-pronounced down regulation in thede novosynthesis of pyrimidine ribonucleotides pathway was observed in the expression level ofURA3and, similar to the observation for the response to glucose impulse, the step catalysed by Ura3p may be a bottleneck, limiting the produc-tion of UMP, the precursor for the producproduc-tion of UTP and CTP.URA7andURA8, whose products catalyze the conver-sion between UTP and CTP were both up-regulated in NP2 and NP4 whereas only URA8 was down-regulated in NP3. The salvage pathway of pyrimidine deoxyribonucleotides was
Fig. 7 Schematic overview of alternative routes for ATP production during inactivation of the TCA cycle and the down-regulation of
also not as strongly affected in response to the ammonium perturbation as it was following the introduction of glucose (Fig. 6, ESI 6, ESI 7).
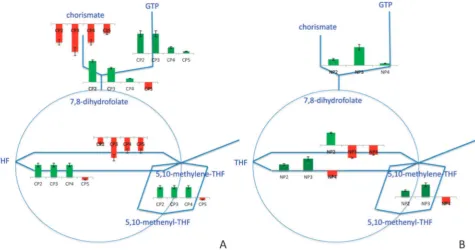
Changes in the folate metabolism
a. Response to the glucose impulse.The role of folates in metabolism is to donate 1C units to various biosynthetic pathways through the production of tetrahydrofolate (THF), which is an active form of folic acid.34Carbons C2 and C8 of purine rings are obtained from the metabolism of folate that takes place in the mitochondria.35 FOL1 and FOL2, whose products take part in the upper folate biosynthetic pathway starting from GTP, were up-regulated in CP2-CP4. The formation of 1C units was enabled through the interconversions between THF, 5,10-methylene-THF and 5,10-methenyl-THF. The expression levels of the genes encoding the enzymes facili-tating these interconversions were up-regulated in CP2 and CP3 and these paths gradually became inactive through CP4 and CP5. The conversion of glycine and THF into 5,10-methylene-THF, NH3 and CO2 was facilitated by the active glycine cleavage complex (Lpd1p, Gcv1p, Gcv2p and Gcv3p). All members except forLPD1were observed to be up-regulated in CP2-CP4. LPD1was previously reported to be down-regulated in response to catabolite repression and its release from repression requires the activity of the Hap2/3/4/5 complex.36Additionally,SHM1 and SHM2, which encode enzymes in the superpathway of serine and glycine biosynthesis, facilitated the conversion of serine and THF into glycine and 5,10-methylene-THF.34 Glycine was reported to donate the nitrogen at the N7 position of purine rings and their carbon atoms at the C4 and C5 positions.35 The folate metabolism switched back to the steady-state configuration as the amount of glucose became progressively limited in CP5 (Fig. 8, ESI 8).
b. Response to the ammonium impulse.In response to the addition of ammonium to an N-limited culture, the genes involved in the folate biosynthetic pathways and the folate interconversions were up-regulated in NP2 and NP3. The expression levels of the genes of the pathway were up-regulated except for those of LPD1, ABZ2 and CDC21, which were down-regulated. The interconversions among folate products were active throughout NP2-NP3 enabling the generation of 1C species to be utilized in purine biosynthetic processes. More genes were down-regulated in NP4 (Fig. 8, ESI 8).
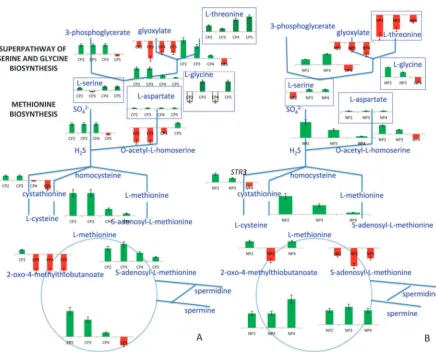
Changes in the superpathway of serine and glycine biosynthesis, sulphur amino acid metabolic pathways, the aspartate
biosynthetic pathway and the superpathway of glutamate biosynthesis
a. Response to the glucose impulse. The genes whose products mediate the interconversion of L-threonine and L-glycine in the superpathway of serine and glycine biosynthesis
were up-regulated, as soon as glucose was introduced into the carbon-limited culture.SHM2andSHM1, which both encode the enzyme that catalyzed the interconversion betweenL-glycine
and L-serine, were found to be up-regulated throughout
CP2-CP4, and down-regulated in CP5. A slightly increased accumulation L-serine and L-threonine was also observed
through CP3-CP5. One route leading to the synthesis of
L-glycine that from glyoxylate, was observed to be rendered
congested through the down-regulation ofAGX1throughout the experiment. This down-regulation was most pronounced in CP3 and CP4 (Fig. 9, ESI 9).
In response to carbon catabolite repression, methionine biosynthesis was up-regulated in CP2 and CP3viathe route utilizing sulphate rather thanL-aspartate. Genes with a role in
the upper biosynthetic pathway were gradually down-regulated
in CP4 and CP5. The only exception for up-regulation was observed forMET17, which was down-regulated at all post-impulse periods, and may create a bottleneck for the formation of L-methionine. A close paralog, CYS3 (BLASTP e-value:
5.7e-35), might have replaced its function, allowing continued flux through the pathway.L-cysteine was converted to
homo-cysteine and then toL-methionine through the up-regulation ofCYS3andSTR3.SAM1,SAM2andMET6(on the route towards L-methionine and S-adenosyl-L-methionine) were
up-regulated once homocysteine was produced. The enzyme product of the up-regulated MET6, enabling L-methionine
production from L-homocysteine, also facilitated the
inter-conversion between 5-methyl-THF and THF. The direction of fluxes fromS-adenosyl-L-homocysteine towardsL-homocysteine
was facilitated through the up-regulation ofSAH1, enabling the release of additional adenosine for the production of AMP in purine biosynthesis (Fig. 9, ESI 9).
Genes in the salvage pathway of methionine were up-regulated immediately. Genes of this pathway became progressively down-regulated through CP3 to CP5. The down-regulation in the genes of the salvage pathway was the most pronounced in CP5. Among these genes, the methylthioadenosine phosphorylase, MEU1 was previously reported to regulate the expression ofADH2, for which the strongest down-regulation of expression was also observed in CP537(Fig. 9, ESI 9).
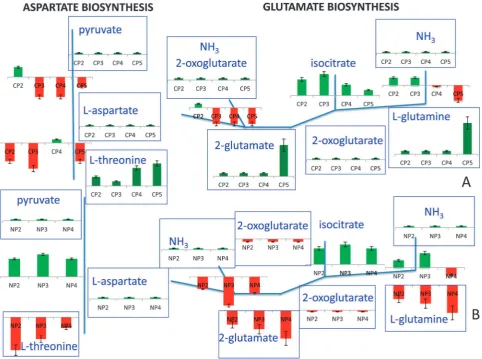
Aspartate biosynthesis donates the nitrogen in the N1 position of the purine ring.35In response to carbon catabolite repression, the expression levels of the genes in the aspartate biosynthetic pathway were not reduced immediately but remained active through CP2, being down-regulated in CP3-CP5. During CP2, althoughPYC1was down-regulated, its paralogPYC2was still up-regulated, enabling the formation of oxaloacetate then to be down-regulated throughout CP3-CP5. The down-regulation in the cytosolic aspartate aminotransferase, encoded by AAT2, and the up-regulation in the mitochondrial aspartate aminotransferase, specified by AAT1, indicated that L-aspartate biosynthesis from oxaloacetate was preferred through the mitochondrial, rather than the cytosolic, route. However, the route for the production of homoserine andL-threonine from aspartate was reduced (as a
result of the down-regulation of the pathway genes HOM2-HOM6 andTHR4, respectively) throughout the experiment. The accumulated aspartate would be converted to fumarate by the catalytic action of the up-regulated ADE12 andADE13 (through adenylosuccinate), or by the up-regulatedARG1and ARG4 (through L-argininosuccinate). The accumulation of fumarate throughout the effective period of the impulse-like addition of glucose also supported this hypothesis.
Another possibility would be the conversion ofL-aspartate
toN-carboyl-L-aspartate through the up-regulated URA2 to
shift the fluxes towards pyrimidine biosynthetic metabolism. The cyclic interconversion betweenL-aspartate andL-asparagine
was also facilitated through the enzymes of the up-regulated ASN1andASN2during CP2-CP5. The gene expression levels of the asparaginases mediating the conversion ofL-asparagine
toL-aspartate and ammonia (donating a nitrogen atom for the
purine ring) were also up-regulated during all post-impulse phases. The intracellular concentrations of L-aspartate, homo-serine andL-threonine were all high and the down-regulation
of the genes whose enzymes take role in the pathway from
L-aspartate and homoserine towardsL-threonine production
was accompanied by this intracellular accumulation (Fig. 10, ESI 10).
L-glutamine delivers the nitrogen atoms at positions N3 and
N9 of the purine ring.35L-glutamine biosynthesis initiates from
a component of the TCA cycle, isocitrate. The conversion of isocitrate in to 2-oxoglutarate through the catalysis by the product ofIDP1, which was selectively up-regulated throughout the period of carbon catabolite repression, allowedfurther alpha-ketoglutarate to be used in biosynthetic processes.38 2-oxoglutarate, together with NH3would then be converted into L-glutamate through the catalysis of the up-regulated
glutamate dehydrogenases, and 2-oxoglutarate would be con-vertedviathe up-regulated glutamate synthaseGLT1in CP2.
This process was observed to be down-regulated during CP3-CP5. The utilization of ammonia and its conversion into
L-glutamine were diverted through glutamine synthetase (Gln1p) during CP2 and CP3; however, the expression of GLN1 was reduced during CP4 and CP5. The intracellular concentrations of ammonia, 2-oxoglutarate, L-glutamate and
L-glutamine were all high throughout the catabolite repression
(Fig. 10, ESI 10).
b. Response to the ammonium impulse.Upon relaxation of ammonium limitation, the expression levels of the genes in the superpathway of serine and glycine biosynthesis were up-regulated in NP2 and NP3 except for the alanine:glyoxylate aminotransferaseAGX1, which was slightly down-regulated in NP2 and even more so in NP3, reducing the production of
L-glycine from glyoxylate. L-serine production from either
branch was reduced in NP4 due to the down-regulation of the genes catalysing the enzymes along the pathways (Fig. 9, ESI 9).
Genes encoding enzymes in both upper branches of the methionine biosynthetic pathway, utilizing either sulphate orL-aspartate, were up-regulated in response to an
ammonium perturbation. The down-regulation of MET17 during NP3 would be compensated byCYS3 as was found
for the glucose perturbation. The low expression levels that were observed forMET2orSTR3indicated that the produc-tion of L-methonine from L-aspartate or from L-cysteine, respectively, was reduced. The genes in the salvage pathway of methionine were up-regulated throughout nitrogen catabolite repression except for the branched-chain amino acid transferase BAT2and the aromatic aminotransferase II, Aro9p, and this pathway remained functional in NP4 just before regaining the steady-state as opposed to the down-regulation of the pathway genes observed towards exiting carbon catabolite repression (Fig. 9, ESI 9).
Nitrogen catabolite repression resulted in an up-regulation of the genes acting in the biosynthesis of L-aspartate from
pyruvate; the response increasing gradually from NP2 to NP4. The two genes encoding the isoforms of pyruvate carboxylase (PYC1orPYC2) were active at all periods, andL-aspartate
production was enabled through either the mitochondrial or the cytosolic aspartate aminotransferase during NP2-NP4. In contrast to what was observed during carbon catabolite repression, homoserine andL-threonine production were also
up-regulated during NP2-NP4. The intracellular concentra-tions ofL-aspartate and homoserine were high, whereas that of L-threonine was low in accordance with the observation of the
up-regulation of the pathway components from L-aspartate
and homoserine towardsL-threonine (Fig. 10, ESI 10).
The expression levels of the genes involved in the production of L-glutamate were observed to be low during NP2-NP4,
which was also observed in the intracellular concentration of the metabolite itself in response to the impulse-like addition of ammonium. Although the NADP-specific isocitrate dehydro-genase IDP1, which encodes the enzyme that mediates the conversion of isocitrate to 2-oxoglutarate, was up-regulated, the genes encoding glutamate dehydrogenases (GDH1,GDH2 andGDH3) were down-regulated in NP2 and NP3. The direct conversion of 2-oxoglutarate intoL-glutamate was reduced by the down-regulation ofGLT1in NP2 but induced in NP3 and NP4 as a result of the up-regulation in the expression level of the gene.L-glutamine production fromL-glutamate was active
as a response to nitrogen catabolite repression in NP2-NP3 but not in NP4. The intracellular concentrations of ammonia, 2-oxoglutarate andL-glutamine were all high (Fig. 10, ESI 10).
Materials and methods
Data acquisition
The dynamic transcriptome data were obtained from chemostat experiments in response to a nutritional perturbation8in pre-processed form. cDNA synthesis and double-stranded cDNA retrieval was carried out as described in the AffymetrixGeneChips Expression Analysis Technical Manual, using appropriate kits. Biotin-labelled cRNA was synthesized and was purified using clean up kits. Hybridization and loading onto Affymetrix Yeast2 arrays were carried out as described in the GeneChips Expression Analysis Technical Manual. The chips were then loaded into a fluidics station for washing and staining using Microarray Suite 5 with EukGe W S2v4 programme. Lastly, the chips were loaded onto the Agilent GeneArray scanner 2500 and another quality check was performed using Microarray Suite 5.
In compliance with MIAME guidelines,39the microarray data from this study has been submitted to ArrayExpress at the European Bioinformatics Institute under accession number E-MTAB-643. Full details of sampling and the transcriptome analysis were reported previously.8
Sampling and extraction of the endometabolome, analytical methods for fingerprinting
For metabolic fingerprinting, 5 ml of sample were rapidly quenched in 60% (v/v) methanol buffered with tricine at 501C and the endometabolites were extracted in boiling 75% (v/v) ethanol buffered with tricine at 801C as described by Castrillo et al.40The vacuum-dried samples were stored at 801C until analysis. For both footprinting and fingerprinting, derivatization and identification of peaksviaGC-ToF-MS were performed as described by Popeet al.41A total of 69 metabolites were semi-quantitatively identified in the analysis among the 118 peaks that were detected for the case of the glucose impulse whereas 64 metabolites were identified among the 155 peaks that were detected in response to an impulse like addition of ammonium into its limited culture. The samples for GC–MS analysis were spiked with 100ml 0.18 mg ml 1succinic d4acid as the internal
standard and the peak areas were normalized against the standard. The dynamic metabolome data are provided in ESI 11.
Identification of gene expression in co-clustered time spans and mapping of the transcriptome and the metabolome on metabolic pathways
The hierarchical clustering of the transcriptome and the metabolome data was carried out using Hierarchical Clustering Explorer (HCE) 3.042with the distance measure selected as the Pearson correlation. Average linkage method was used in the construction of the dendogram. All data was row normalized prior to analysis with mean 0 and standard deviation 1. The periods were identified from the determined clusters. The gene expression levels in each period were statistically confirmed to display insigni-ficant differences within a single period using the Student’s t-test with a significance threshold of 0.05. The geometric means of the logarithm-transformed expression levels in each period were then calculated. The differences in logarithmic mean values for the periods following a perturbation and the period consisting of the succeeding or preceding steady-state data (expressed as fold changes either in expression or in the amount of the measured metabolite) were mapped onto the metabolic pathways. Considera-tion of each period separately enabled the dynamic overview of the decision-making involved in the pathway preferences.
The complementary nature of the transcriptome and the endometabolome data was investigated by mapping expression levels and intracellular metabolite concentrations simultaneously onto metabolic pathways (SGD, http://pathway.yeastgenome. org:8555/expression.html). The direction and the reversibility of the reactions were assessed using the KEGG database43and the Yeast 4.0 model.44
Conclusion
these data with metabolic pathway information revealed the long-term dynamic re-organization of yeast metabolism (Fig. 11).
The glycolytic and gluconeogenic pathways and the TCA cycle were all affected by a glucose impulse injected into a carbon-limited culture, and different members of paralogous pairs of genes encoding isozymes involved in the central energy metabolism were observed to be active at different phases of the response to the perturbation. The transcriptional response of the genes involved in the upper glycolytic pathway was immediate and these genes remained down-regulated for at least three hours, limiting glucose phosphorylation to avoid glucose-accelerated death. The most pronounced down-regulation of the TCA cycle genes was observed within the first hour following the glucose impulse, displaying a rather late response. The impulse-like addition of ammonium into an N-limited culture triggered an even later response than that to the addition of glucose. The response observed in the lower glycolytic pathway was found to be glucose-specific as an equivalent response was not observed during the ammonium perturbation. The fluxes towards the lower gluconeogenic pathway were limited through the down-regulation of the genes encoding specific enzymes in both cases.
The initial steps in thede novosynthesis of purine nucleo-tides were immediately activated as soon as glucose was introduced. Upon depletion of glucose, almost all of the pathway components were down-regulated and, with the activation of the TCA cycle, the necessary energy for survival and maintenance would again be supplied through that channel. The time-dependent changes observed in the purine salvage pathway provided additional evidence about the role and organi-zation of this pathway to control energy homeostasis and
compensate for the sudden drop in the AXP pools. Further insight was provided into the accumulation of inosine, IMP, and hypoxanthine that had been reported in previous studies. Thede novobiosynthesis of pyrimidine ribonucletides was also reduced with the introduction of glucose into a C-limited culture. The salvage pathway of pyrimidine nucleotides was activated for the utilization of uracil, which was supplemented in the fermentation medium due to the auxotrophic require-ment of the yeast strain under study. The effect of the addition of ammonium to an N-limited culture was observed to cause similar, but less pronounced, changes in both the de novo synthesis of pyrimidine ribonucleotides and their salvage path-ways to those observed in the response to the addition of glucose under C-limitation.
The folate interconversions donating 1C units in purine metabolism were active during the first hour following the introduction of glucose, being gradually down-regulated until the effect of the impulse ceased to exist. A very similar pattern of regulation to what had been observed for the carbon catabolite repression was encountered in the first three hours following the addition of ammonium. The pathway gradually became inactive as the effect of the impulse began to cease.
In response to carbon catabolite repression, our integrative analysis of the methionine biosynthetic pathways indicated the prominence of sulphur metabolism, rather than that of L-aspartate. The direction of flux was re-arranged such that the release of additional adenosine was facilitated. Genes in the salvage pathway of methionine were also observed to be up-regulated immediately. All of the upper methionine bio-synthetic pathway genes were up-regulated in response to an ammonium perturbation. A similar pattern was observed for the genes in the salvage pathway of methionine to that of the biosynthetic pathway, except that this pathway remained functional until the return to the steady state.
In response to carbon catabolite repression, the down-regulation of L-aspartate biosynthetic pathway genes was
delayed, being prominent after the first minute. An accumula-tion ofL-aspartate would have been relieved by its conversion
to fumarate through various routes. Another possibility would have been its re-direction towards pyrimidine metabolism. In contrast, nitrogen catabolite repression resulted in an increasing up-regulation in the L-aspartate biosynthetic pathway in
response to the rapid introduction of ammonium.L-glutamine
production was up-regulated throughout the period of carbon catabolite repression, diverting alpha-ketoglutarate to bio-synthetic processes, and was down-regulated throughout the period of nitrogen catabolite repression.
This long-term integrative study revealed that, in addition to the dynamic re-organization of the de novo biosynthetic pathways, the salvage pathways appeared to be re-organized in a time-dependent manner by catabolite repression in yeast. The transcriptional and metabolic responses observed for nitrogen catabolite repression were not as severe as those for carbon catabolite repression. This may have been due to the fact that uracil, histidine, and leucine were supplemented in the fermentation medium to satisfy the auxotrophic require-ments of the strains employed. Selective up- or down regula-tion of different members of paralogous pairs of genes throughout the response to the relaxation from nutritional
limitation in yeast requires further investigation to assign specific functions to the isozymes encoded by such gene pairs. Although this study provided additional information on inosine accumulation and recycling, it has also indicated the requirement for further studies to shed light on specific phenomena such as the relief of the accumulation of hypoxanthine or the down-regulation of YNK1, whose product phosphorylates XDP nucleotides to XTP.
Transcriptome and metabolome data were observed to complement each other, providing useful information whenever they were simultaneously available. Additional metabolite measurements and studies at the proteome and phosphoproteome level, complemented by accurate measurements of mRNA decay, may provide better information to shed light onto the time-dependent re-organization of yeast cells as a dynamic response to a changing nutritional environment and thus provide a quantitative understanding of cell behaviour. Similar integrative systems-level approaches would also provide a solid understanding of metabolic processes that control the respiro-fermentative transition in human cells.
Acknowledgements
The authors greatly acknowledge the financial support for the research from the BBSRC (Grant BB/C505140/1 to SGO), and the travel grants for DD kindly provided by the Research Council of Turkey (TUBITAK) through the BDP programme and the Turkish State Planning Organization DPT09K120520. The research was also financially supported by Bogazici University Research Fund through Project No 631 and TUBITAK through Project No 106M444. Further support came from European Commission though the Coordination Action Project YSBN (Contract No.018942 to both BK and SGO) and UNICELLSYS Collaborative Project (No. 201142 to SGO).
Notes and references
1 D. Y. Shin, K. Matsumoto, H. Iida, I. Uno and T. Ishikawa,
Molecular and Cellular Biology, 1987,7(1), 244.
2 L. Viladevall, R. Serrano, A. Ruiz, G. Domenech, J. Giraldo, A. Barcelo and J. Arino,J. Biol. Chem., 2004,279(42), 43614. 3 M. T. A. P. Kresnowati, W. A. van Winden, M. J. H. Almering,
A. ten Pierick, C. Ras, T. A. Knijnenburg, P. Daran-Lapujade, J. T. Pronk, J. J. Heijnen and J. M. Daran,Mol. Syst. Biol., 2006,
2, 49.
4 M. Ronen and D. Botstein,Proc. Natl. Acad. Sci. U. S. A., 2006,
103(2), 389.
5 E. Braun and N. Brenner,Phys. Biol., 2004,1, 67.
6 J. van den Brink, P. Daran-Lapujade, J. T. Pronk and J. H. de Winde,
BMC Genomics, 2008,9, 100.
7 A. P. Gasch, P. T. Spellman, C. M. Kao, O. Carmel-Harel, M. B. Eisen, G. Storz, D. Botstein and P. O. Brown,Molecular Biology of the Cell, 2000,11, 4241.
8 D. Dikicioglu, M. E. Karabekmez, B. Rash, P. Pir, B. Kirdar and S. G. Oliver,BMC Syst. Biol., 2011,5, 148.
9 H. C. Causton, B. Ren, S. S. Koh, C. T. Harbison, E. Kanin, E. G. Jennings, T. I. Lee, H. L. True, E. S. Lander and R. A. Young,Molecular Biology of the Cell, 2001,12, 323. 10 H. Moriya and M. Johnston,Proc. Natl. Acad. Sci. U. S. A., 2004,
101(6), 1572.
11 M. C. M. Meijer, J. Boonstra, A. J. Verkleij and C. T. Verrips,
J. Biol. Chem., 1998,273(37), 24102.
12 J. M. Gancedo, Microbiology and Molecular Biology Reviews, 1998,62(2), 334.
13 S. Zaman, S. I. Lippman, L. Schneper, N. Slonim and J. R. Broach,
Molecular Systems Biology, 2009,5, 245.
14 T. Walther, M. Novo, K. Ro¨ssger, F. Le´tisse, M. O. Loret, J. C. Portais and J. M. Franc¸ois,Mol. Syst. Biol., 2010,6, 344. 15 B. Magasnik,Eukaryotic Cell, 2003,2(5), 827.
16 B. Magasnik and C. A. Keiser,Gene, 2002,290, 1.
17 E. G. ter Schure, H. H. W. Sillje, E. E. Vermeulen, J. W. Kalhorn, A. J. Verkleij, J. Boonstra and C. T. Verrips,Microbiology, 1998,
144, 1451.
18 J. I. Castrillo, L. A. Zeef, D. C. Hoyle, N. Zhang, A. Hayes, D. J. C. Gardner, M. J. Cornell, J. Petty, L. Hakes, L. Wardleworth, B. Rhash, M. Brown, W. B. Dunn, D. Broadhurst, K. O’Donoghue, S. S. Hester, T. P. J. Dunkley, S. R. Hart, N. Swainston, P. Li, S. J. Gaskell, N. W. Paton, K. S. Lilley, D. B. Kell and S. G. Oliver,
J. Biol., 2007,6, 4.
19 A. Gutteridge, P. Pir, J. I. Castrillo, P. D. Charles, K. S. Lilley and S. G. Oliver,BMC Biol.,8, 68.
20 C. Zeyl,FEMS Microbiol. Lett., 2004,233, 187.
21 M. P. Zustiak, J. K. Pollack, M. R. Marten and M. J. Betenbaugh,
Curr. Opin. Biotechnol., 2008,19, 518.
22 S. H. Yoo, F. S. Genbauffe and T. G. Cooper,Molecular and Cellular Biology, 1985,5(9), 2279.
23 E. Boles, P. de Jong-Gubbels and J. T. Pronk,Journal of Bacteriology, 1998,180(11), 2875.
24 G. C. Hung, C. R. Brown, A. B. Wolfe, J. Liu and H.-L. Chiang,
J. Biol. Chem., 2004,279(47), 49138.
25 E. B. Graybill, M. F. Rouhier, C. E. Kirby and J. W. Hawes,
Arch. Biochem. Biophys., 2007,465, 26.
26 M. A. van den Berg, P. de Jong-Gubbels and H. yde Steensma,
Yeast, 1998,14, 1089.
27 M. Kunze, I. Pracharoenwattana, S. M. Smith and A. Hartig,
Biochim. Biophys. Acta, Mol. Cell Res., 2006,1763, 1441. 28 R. Schricker, V. Magdolen, A. Kaniak, K. Wolf and W. Bandlow,
Gene, 1992,122–1, 111.
29 A. Goffeau, B. G. Barrell, H. Bussey, R. W. Davis, B. Dujon, H. Feldmann, F. Galibert, J. D. Hoheisel, C. Jacq, M. Johnston, E. J. Louis, H. W. Mewes, Y. Murakami, P. Philippsen, H. Tettelin and S. G. Oliver,Science, 1996,274(546), 563.
30 M. Kaneisha, M. Araki, S. Goto, M. Hattori, M. Hirakawa, M. Itoh, T. Katayama, S. Kawashima, S. Okuda, T. Tokimatsu and Y. Yamanishi,Nucleic Acids Res., 2008,36, D480.
31 R. Fluri and J. R. Kinghorn,Curr. Genet., 1985,9, 573. 32 E. Fernandez, M. Fernandez and R. Rodicio,FEBS Lett., 1993,
320(3), 271.
33 J. E. Kurtz, F. Exinger, P. Erbs and R. Jund,Curr. Genet., 2002,
41, 132.
34 K. E. Christensen and R. E. MacKenzie,BioEssays, 2006,28, 595. 35 D. H. Griffin, inFungal Physiology, Wiley, 2nd edn, 1996. 36 S. B. Bowman, Z. Zaman, L. P. Collinson, A. J. Brown and
I. W. Dawes,Molecular and General Genetics, 1992,231(2), 293. 37 A. L. Subhi, P. Diegelman, C. W. Porter, B. Tang, Z. J. Lu,
G. D. Markham and W. D. Kruger, J. Biol. Chem., 2003,
278(50), 49868.
38 R. J. Haselbeck and L. McAlister-Henn,The Journal of Biological Chemistry, 1993,268(16), 12116.
39 A. Brazma, P. Hingamp, J. Quackenbush, G. Sherlock, P. Spellman, C. Stoeckert, J. Aach, W. Ansorge, C. A. Ball, H. C. Causton, T. Gaasterland, P. Glenisson, F. P. C. Holstege, I. F. Kim, V. Markowitz, J. C. Matese, H. Parkinson, A. Robinson, U. Sarkans, S. Schulze-Kremer, J. Stewart, R. Taylor, J. Vilo and M. Vingron,Nat. Genet., 2001,29, 365–371.
40 J. I. Castrillo, A. Hayes, S. Mohammed, S. J. Gaskell and S. G. Oliver,Phytochemistry, 2003,62, 929.
41 G. A. Pope, D. A. MacKenzie, M. Defemez, M. A. M. M. Aroso, L. J. Fuller, F. A. Mellon, W. B. Dunn, M. Brown, R. Goodacre, D. B. Kell, M. E. Marvin, E. J. Louis and I. N. Roberts,Yeast, 2007,24, 667.
42 J. Seo, M. Bakay, Y. W. Chen, S. Hilmer, B. Shneiderman and E. P. Hoffman,Bioinformatics, 2004,20, 2534.
43 M. Kanehisa and S. Goto,Nucleic Acids Res., 2000,28(1), 27. 44 P. D. Dobson, K. Smallbone, D. Jameson, E. Simeonidis,