IN VITRO ANTIOXIDANT CAPACITIES AND ANTIDIABETIC PROPERTIES OF PLUCHEA LEAVES
AND GREEN TEA MIXTURES AT VARIOUS PROPORTIONS
Original Article
PAINI SRI WIDYAWATI
1*, YESIANA D. W. WERDANI
2, CHRISTINE SETIOKUSUMO
1, ADRIANA KARTIKASARI
11Food Technology Programme, Agricultural Technology Faculty, Widya Mandala Catholic University, Surabaya, East Java, Indonesia, 60265, 2
Received: 01 May 2017 Revised and Accepted: 30 Jun 2017
Nurse Faculty, Widya Mandala Catholic University, Surabaya, East Java, Indonesia, 60265 Email: [email protected]
ABSTRACT
Objective: This study was done to determine the effect of pluchea leaves and green tea mixtures at various proportions to antioxidant and antidiabetic properties.
Methods: The research used a single factor randomized block design. Research factors were pluchea and green tea mixture proportions, including 100:0; 75:25; 50:50; 25:75; and 0:100% (w/w), respectively. Each of factors was repeated five times. The parameters observed in this study were phytochemical compounds, total phenols, total flavonoids, free radical DPPH scavenging activity, iron ion reducing power, alpha amylase and alpha
glycosidase inhibition activities. The data were statistically α = 5%, if the data analysis showed a significant analyzed using analysis of variance
(ANOVA) at effect then it was continued with duncan's multiple range test (DMRT).
Results:The phytochemical compounds containing in pluchea leaves and green tea mixtures were alkaloids, flavonoids, phenolics, saponins, tannins, triterpenoids, sterols, and cardiac glycosides. The qualitative assay of phytochemical compounds from aqueous extract had a different pattern with total phenolic content (TPC) and total flavonoid content (TFC), especially at 75:25; 50:50 and 25:75 % (w/w) from pluchea leaves and green tea mixture proportions. The 50:50% (w/w) proportions of samples had the highest TPC and TFC, it was proposed that there was an interaction between bioactive compounds of pluchea leaves and green tea. TPC and TFC were correlated with free radical DPPH scavenging activity, iron reducing power and alpha glycosidase inhibition activity, but the alpha amylase inhibition activity had the different graph pattern with the TPC and TFC.
Conclusion: The antioxidant capacity of pluchea leaves and green tea mixtures at various proportions had the graph pattern similar to the alpha glycosidase inhibitory activity and different with the alpha amylase inhibitory activity.
Keywords: Pluchea leaves, Green tea, Antioxidant, Anti diabetic
© 2017 The Authors. Published by Innovare Academic Sciences Pvt Ltd. This is an open access article under the CC BY license DOI: http://dx.doi.org/10.22159/ijpps.2017v9i8.19545
INTRODUCTION
Pluchea leaves (Pluchea indica Less) and green tea (Camellia sinensis
(L) O. Kuntze) are two commodities that are potentially as antioxidant and anti-diabetic sources. These are related to phytochemical contents of these plants.
Pluchea indica Less are a herb plant from Asteraceae family that are potentially as antioxidant, especially DPPH free radical scavenging activity, iron reducing power, reactive oxygen species scavenging
activity, and β-carotene linoleic acid system inhibition activity [1-3], anti-warmed over flavor [4], anti-inflammatory [5], and anti-diabetic [6]. Pluchea leaves contain the phytochemical compounds, such as flavonoids, sterols, saponins, tannins, alkaloids, and cardiac glycosides [1, 2, 6, 7].
Green tea contains a major active group of tea leaves’ components (up to 30% of the dry weight of the water-extractable material) [8-10]. They are comprised on epigallocatechin gallate (23.4–112.4 lg/ml) as the major component, followed by epigallocatechin (18.4– 78.9 lg/ml), epicatechin gallate (5.6–29.6 lg/ml), epicatechin (4.6– 14.5 lg/ml) and catechin (3.2–8.2 lg/ml) [11]. The catechins effectively scavenge oxy-radicals involved in the pathogenesis of many chronic diseases, including cardiovascular diseases, cancer, neurodegenerative diseases, and ageing [12], antioxidant and prebiotic activities [13], anticancer [8], antidiabetic [14], anti-inflammatory and analgesic effect [15].
Pluchea leaves and green tea usually are used as a health beverage. Many people generally utilize this commodity as herbal tea that is packed in tea bag packaging. The potency of each commodity as antioxidant and anti-diabetic has been determined [4,5,13,14]. Therefore it is necessary to know the potency of pluchea leaves and
green tea mixtures as antioxidant and antidiabetic activities. The pluchea leaves and green tea mixtures can allow the interaction among bioactive compounds that can give synergism or antagonism effects of antioxidant and antidiabetic activities. Until now this interaction is not fully understood. Therefore it is necessary to investigate the effect of a mixture of them at various proportions to antioxidant and antidiabetic activities. This study was done to determine the effect of pluchea leaves and green tea mixtures at various proportions to antioxidant and antidiabetic properties.
MATERIALS AND METHODS
Chemicals and reagents
Pluchea leaves were harvested and collected from a pluchea garden in Manggrove areas, Wonorejo, Rungkut, Surabaya, East Java, a city in the middle of Indonesia in Java Island. The plant was authenticated in the Herbarium of Biology and Food Industry Microbiology Laboratory at the department of Food Technology, Agricultural Technology Faculty, the Widya Mandala Catholic University of Surabaya with voucher specimen no FTP-UKWMS-0001 for future reference.
tartrate tetrahydrate, 1,1-diphenyl-2-picrylhydrazyl free radical (DPPH), alpha amylase enzyme and yeast alpha glycosidase enzyme,
gallic acid, (+)-catechin and p-nitrophenil-α-D-glucopyranoside
were purchased from Sigma–Aldrich Company Ltd. (Gillingham, UK). Commercial mineral water with pH 7.65 was purchased from PT Erindo Mandiri (Surabaya, East Java, Indonesia) and aqua dest was bought from PT. Megah Sejahtera Scientific (Surabaya, East Java, Indonesia).
Sampling
Pluchea indicaless leaves were harvested from 1-6 age level [16].
The leaves were dried at room temperature and ground to a fine powder (45 mesh). The moisture content was around 15.06-16.72 % db. And then dried leaves powder was mixed before extraction.
Extraction
Pluchea leaves powder was mixed with green tea powder at 100:0; 75:25; 50:50; 25:75; and 0:100 % (w/w) proportions, respectively.
And then samples were extracted by Deetae et al. [16] method with
slight modification. Pluchea leaves were sorted from 1-6 segment level, and then they were washed and dried at ambient temperature for 7 d. After dried pluchea leaves were done crushing to get 45 mesh particle size. Pluchea leaves powder was homogenised before they were mixed by the similar particle size of green tea powder.
Phytochemical composition
The mixed samples (2g) in tea bag were macerated with 100 ml commercial mineral water at 95 °C temperature for 5 minutes with constant stirring. The residue of samples in tea bag was separated from the filtrate. And then the filtrate was analyzed further. Each analysis of water extract was always fresh condition.
Phytochemical compounds content in samples were detected by Harborne method [17]. The compounds identified included alkaloids, flavonoids, phenolics, triterpenoids, sterols, saponins, tannins, and cardiac glycosides (fehling test).
Total phenol content analysis
Total phenol content (TPC) in samples was analyzed with folin ciocalteu’s phenol reagent. The redox reaction between antioxidant compounds having an aromatic ring and phosphomolybdate compound in folin ciocalteu’s phenol reagent is the principle of this analysis. The formation of the blue colour solution was determined by UV-Vis spectrophotometer (Shimadzu spectrophotometer UV-Vis
1700) at λ 760 nm, the result was stated as mg gallic acid
equivalent/l samples (mg GAE/l samples) [19].
Total flavonoid content analysis
Total flavonoid content (TFC) was analyzed based on Al-Temimi and Choundary [19] method. This principle analysis is based on a stable
acid complex compound formation of reaction between AlCl3 and
Oxo group at C4 ring and a hydroxyl group at C3 or C5
DPPH free radical scavenging activity analysis
ring of flavones and flavonol. This reaction produced solution coloured yellow and NaOH solution addition resulted in quinoid compound colored red that measured by UV-Vis spectrophotometer (Shimadzu
spectrophotometer UV-Vis 1700) at λ 510 nm, the result was stated
by mg catechin equivalent/l samples (mg CE/l samples).
DPPH free radical scavenging activity analysis was measured by Brand
William et al. [20]. The principal analysis is electron or hydrogen
donating of antioxidant compounds to DPPH free radical colored purple to form DPPH-H non-radical colored yellow that was measured by
UV-Vis spectrophotometer (Shimadzu spectrophotometer UV-UV-Vis 1700) at λ
517 nm with a gallic acid compound as standard.
Iron reducing power analysis
Iron reducing power analysis was determined by Chanda and Dave [21] method that was used to measure the antioxidant capacity to reduce Fe3+to Fe2+
α-Amylase inhibition assay
. The complex compound from ferri ferrocyanide coloured Berlin blue was determined by UV-Vis spectrophotometer
(Shimadzu spectrophotometer UV-Vis 1700) at λ 700 nm with a
gallic acid compound as standard [20].
The α-amylase inhibition was determined by an assay described
from Bernfeld [22] with slight modification. The 500 μL of water
extract was incubated with 500 μL of a α-amylase solution (enzyme
solution (12.5 units/ml) was obtained by dissolving 0.1 g of α
-amylase in 100 ml of 0.2 M sodium acetate buffer pH 5 at ambient
temperature (32 °C) for about 10 min. After incubation, 500 μL of 1
% starch solution (dissolving 1 g of amylum starch in 100 ml of distilled water with boiling and stirring for 15 min) was added and incubated at ambient temperature (32 °C) for about 10 min. To the above, 2 ml of NaOH 1 M was added to stop the reaction and was incubated in a water bath (37 °C) for 10 min. After 10 min, reaction mixture color changed to orange-red and was removed from the water bath and cooled to ambient temperature. Absorbance was measured at 540 nm in Shimadzu spectrophotometer UV-Vis 1700. Extracts of pluchea leaves and green tea mixtures at different proportions (100:0; 75:25; 50:50; 25:75; and 0:100 mg/ml, respectively) were performed in five repetitions. Individual blank was performed by replacing enzyme with buffer. Control was performed by replacing extract with solvent. The inhibition
percentage of α-amylase was assessed by the following formula:
Inhibition (%)=(Ac(0)−Ac(t))−(As−Ab)
Ac(0)−Ac(t) x 100% … … … … …(Equation 1)
Where, Ac (0) that absorbance of 100% enzyme activity (only solvent with enzyme), Ac (t) that absorbance of 0% enzyme activity (only solvent without enzyme), As that absorbance of test sample with an enzyme, Ab that absorbance of test sample without enzyme.
α-Glucosidase inhibition assay
The inhibition of yeast α-glucosidase was determined by using the
method described by Da Silva Pinto et al. [23] with slight
modification). Briefly, 0.0019 mg yeast α-glucosidase (0.0833 unit/ml) was dissolved in 100 ml of 0.2 M phosphate buffer (pH 7).
The substrate solution, 2 mmol p-nitrophenyl-α-D-glucopyranoside,
was prepared in the same buffer. The water extract of pluchea leaves
and green tea at various proportions (50 μl), 50 μl of enzyme
solution, 50 μl of substrate solution, and 100 μl buffer phosphate
solution (pH 7) were mixed well and incubated at 37 °C for 15 min.
After incubation, the solution was added by 1000 μl of 0.2 M Na2CO3
Inhibition (%)=(Ac(0)−Ac(t))−(As−Ab)
Ac(0)−Ac(t) x 100% ………. (Equation 2)
solution to stop the reaction. Absorbance was measured at 410 nm in Shimadzu spectrophotometer UV-Vis 1700. Extracts of pluchea leaves and green tea mixtures at different proportions (100:0; 75:25; 50:50; 25:75; 0:100 mg/ml) were performed in five repetitions. Individual blank was performed by replacing enzyme with buffer. Control was performed by replacing extract with
solvent. The inhibition percentage of α-amylase was assessed by the
following formula:
Where, Ac (0) that absorbance of 100% enzyme activity (only solvent with enzyme), Ac (t) that absorbance of 0% enzyme activity (only solvent without enzyme), As that absorbance of the test sample with an enzyme, Ab that absorbance of test sample without enzyme.
RESULTS AND DISCUSSION
Phytochemical analysis
Phytochemicals are primary and secondary natural constituents occurring in the medical plants, leaves, vegetables and roots that have defence mechanism and protect from various diseases [25]. The qualitative analysis of the water extract from pluchea leaves and green tea mixtures at various concentrations confirmed the presence of alkaloids, flavonoids, phenols, saponins, tannins, triterpenoids, and cardiac glycosides (table 1). Data showed that pluchea leaves were very rich in alkaloids, flavonoids, phenolics, saponins, tannins, triterpenoids, and cardiac glycosides compared with green tea. The increasing of green tea proportion in samples
decreased the phytochemical quality. Keerthana et al. [25] said that
the phytochemical constituents can be used to treat diabetes if they
[26] and Nanumala et al. [27] said that the capacity to inhibit alpha amylase and alpha glycosidase enzymes are a result of the existence of various phytochemicals like flavonoids, tannins, saponins, anthraquinones, sterols, phlobatannins, terpenoids and polyphenols.
Total phenol content
Total phenol content (TPC) in the water extract from pluchea leaves and green tea mixtures at various proportions was showed in fig. 1. Generally, the TPC of pluchea leaves water extract was significantly (p<0.05) higher compared to the TPC of green tea water extract. This condition was similar to observation of the phytochemical assay, however, there were different phenomena that were observed of samples at 75:25, 50:50, and 25:75 proportions, respectively. These differences may be indicated by the differences in solved phenolic compounds and interaction between phenolic compounds from pluchea leaves and green tea mixtures. These phenomena determined structure of phenolic compounds, such as free or bound phenolics. Many studies have informed that phenolic compounds of fruits and vegetables are
usually in free structure higher than in bound structure [29,30]. There was a free form of phenolics of pluchea leaves and green tea in aqueous media showed that there was hydroxyl group free. The functional group can interact to form bound phenolics or hydrogen bound so that interferes with the reaction among hydroxyl group of phenolic compounds, tungsten and molybdenum ions of Folin Ciocalteu’s reagent.
The effectiveness of TPC assay is depended on the number and position of hydrogen-donating hydroxyl groups on the aromatic ring of the phenolic compounds [31].
Green tea comprises phenolic compounds, especially catechin [8-11], however, pluchea leaves contain phenolic acids i.e. chlorogenic acid and caffeic acid [4] and flavonoid compounds i.e. kaempherol, myricetin, and quercetin [32]. Natural properties of phenolic compounds have biological and pharmacological properties, such as antioxidant, anticancer, anti-aging, and anti-inflammatory activities [33,34]. Phenolic compounds have been used as antioxidants and mainly inhibit free radicals and block their chain reactions [32-34].
Table 1: The phytochemical content of pluchea leaves and green tea mixture at various proportions
Phytochemical constituents Pluchea leaves and green tea mixtures (% w/w)
100:0 75:25 50:50 25:75 0:100
Note: += indicates presense of phytochemicals and-= indicates absence of pytochemicals, +++++= shows high concentration,+= shows low concentration
Fig.1: Total phenolic content of aqueous extract of pluchea leaves and green tea mixtures at various proportions (n=5, Values expressed as mean±SD. Data were analyzed by one way
analysis of variance (ANOVA) followed by duncan's multiple range test (DMRT))
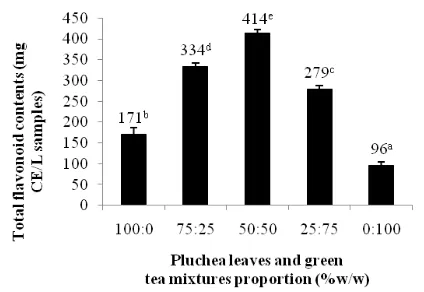
Total flavonoid content
Total flavonoid content (TFC) was determined by aluminum chloride method that was based on the formation of a complex between the aluminum ion, Al (III), and the carbonyl and hydroxyl groups of flavones and flavonols that produce a yellow color [38]. In this study, the flavonoid compounds measured are flavones and flavonols groups, the
TFC was ranged from 95.73 to 413.73 mg of quercetin equivalent L–1 of
samples (fig. 2). The results showed that pluchea leaves contained higher TFC than green tea leaves. The pluchea leaves and green tea mixtures at 50:50 % (w/w) proportions had the highest TFC compared with the other proportions. The TFC of samples had a similar pattern to the TPC, because the flavonoid compounds are the major component of phenolic compounds [33]. The existence of a functional group from the carbonyl and hydroxyl groups of flavones and flavonols in pluchea leaves and green tea in samples can cause synergism effect so that the formation of
a complex with aluminium ion increased in samples at 75:25; 50:50; 25:75 proportions, respectively. The flavonoid compounds can act as free radical scavenging, inhibition of hydrolytic and oxidative enzymes and anti-inflammatory action [39, 40].
Fig.2: Total flavonoid content of aqueous extract of pluchea leaves and green tea mixtures at various proportions (n=5, Values expressed as mean±SD. Data were analyzed by one way
analysis of variance (ANOVA) followed by duncan's multiple range test (DMRT))
Andarwulan et al. [31] informed that the flavonols contained in
pluchea leaves are kaempherol, myricetin, and quercetin. Peres et al.
[11] said that flavanols are the major flavonoid compounds in green tea so that they aren’t detected by aluminium chloride method.
DPPH free radical scavenging activity
compounds due to the formation of non radical DPPH-H form [12, 41]. The total antioxidant activities (TAA) determined by DPPH of water extract of pluchea leaves and green tea mixtures at various proportions were expressed as mg of quercetin equivalent L of samples (fig. 3). Total antioxidant activity (DPPH) was highest in 50:50 proportions, followed by 75:25 proportions, followed by 25:75 proportions, followed by 100:0 proportions, and then 0:100 proportions of pluchea leaves and green tea mixtures. There was trended that hydroxyl groups among phenolic compounds in pluchea leaves and green tea were antagonism effect so that the TAA of them was lower than the TAA sum of pluchea leaves and green tea. The graph pattern of this TAA was similar to the graph pattern of the TPC. The TAA of pluchea leaves was higher than it of green tea. The differences of TAA among all proportions of pluchea leaves and green tea mixtures were statistically significant. There were significant differences between total antioxidant activities of all proportions of pluchea leaves and green tea mixtures depending on
TPC of an extract of samples. Widyawati et al. [2] said that the
different antiradical activity of the extract was depended on the polarity of solvent and solute. These determined the intrinsic compounds to be extracted. The different structure of phytochemical
constituents determines scavenging activity. Rohman et al. [40]
informed that the phytochemicals responsible for the scavenging activity in this species are phenolic and flavonoid constituents. Har and Ismail [41] also explained that phenolic acid and flavonoids are
known to be contributing to the antioxidant activity. Chlopicka et al.
[42] said that among polyphenols the greatest antioxidant efficacies in pseudocereal breads are showed for quercetin, tannic acid, caffeic acid and gallic acid, while catechin and resveratrol have the lowest ones.
Fig.3: DPPH free radical scavenging activity of aqueous extract of pluchea leaves and green tea mixtures at various proportions (n=5, Values expressed as mean±SD. Data were analyzed by one
way analysis of variance (ANOVA) followed by duncan's multiple range test (DMRT)
Widyawati et al. [2] showed that aqueous extract of pluchea leaves is
potential to scavenge free radical. Ruskin et al. [43] added that there
is a positive correlation between phenolic content and free radical
scavenging activity. The high phenolic content of Chukrasia tabularis
(17.2 mg GAE/g) shows the linear correlation between phenolic
content and antioxidant activity. The general assessment of the analytical results for the plant extracts definitely shows the individual specificity of each sample and a rich diverse spectrum of phenolic compounds differing from flavonoid group.
Iron ion reducing power
The total antioxidant activities (TAA) determined by reducing power (RP) of aqueous extract of pluchea leaves and green tea mixtures at various proportions were expressed as mg of gallic acid equivalent per L of samples (fig. 4). Among samples evaluated, the 50:50 proportions of pluchea leaves and green tea mixtures had the highest reducing power, this graph pattern of the RP was similar to the graph pattern of DPPH free radical scavenging activity. There was trended that the RP had the same graph pattern as it of TFC.
Fig.4: Iron ion reducing power of aqueous extract of pluchea leaves and green tea mixtures at various proportions (n=5, Values expressed as mean±SD. Data were analyzed by one-way
analysis of variance (ANOVA) followed by duncan's multiple range test (DMRT))
This estimated that the hydroxyl group of flavonoid compounds between pluchea leaves and green tea mixtures was interacted to give the sinergism effect of RP. The differences of TAA among all proportions of pluchea leaves and green tea mixtures were statistically significant. There were significant differences between TAA of all proportions of pluchea leaves and green tea mixtures
depending on TFC of an extract of samples. Rohman et al. [40] said
that TAA of extracts and fractions of red fruit (Pandanus conoideus
Lam) determines the total phenolics content and total flavonoid content. He also suggested that phenolics compounds more likely contribute to its reducing activity (RP) than flavonoid compounds. On the contrary, the opposite results were found in this research that the RP was more likely contributed by flavonoid compounds than it of phenolic compounds. Gholivand and Piryaei [44] studies that the electron donation capacity reflects the reducing power of bioactive compounds which is related to antioxidant activity.
Antioxidants can be explained as reducers, and inactivation of oxidants by reducers can be described as redox reaction in which one reaction species is reduced at the expense of the oxidation of the
other. Fe3+
α-Amylase inhibitory activity
reduction is often used as an indicator of electron donating activity, which is an important mechanism of the phenolic antioxidant action.
The ability of aqueous extract from pluchea leaves and green tea
mixtures at various proportions in inhibiting the α-amylase is
presented in fig. 5.
Fig.5: α-Amylase inhibitory activity of aqueous extract of pluchea leaves and green tea mixtures at various proportions (n=5, Values expressed as mean±SD. Data were analyzed by one
The α-amylase inhibition activity in this study was ranged from 26.15±1.52 to 56.06±3.91%. The 0:100 proportions had the highest
inhibitory α-amylase activity compared to the other proportions. The inhibition activity of the green tea extract showed the significantly higher (p<0.05) than it of pluchea leaves extract. In this study, there was no significant correlation found between the TAA (DPPH radical
and RP assay) with the α-amylase inhibition activity of pluchea leaves and green tea mixtures at various proportions. This showed that the
graph pattern of the TAA and the α-amylase inhibition activity wasn’t
similar. The same study also is done by Lim and Loh [45]. However,
McCue et al. [46] suggested that the antioxidant activity of phenolic
from clonal oregano extracts is affected the five sets of disulphide
bridges located on the outer surface of α-amylase. The reduction of these cysteine residues causes inhibition by modifying in the structure
of the enzyme. Thus, the α-amylase inhibition activity of the pluchea leaves and green tea mixtures at various proportions may perhaps not due to the TAA but it also involves other mechanisms that worth to be
disclosed. This argument was supported by Lim and Loh [45]. Akah et
al. [47] informed that the phytochemical compounds, such as
terpenoids, saponins, flavonoids, glycosides and carbohydrate have similarly been implicated in the anti-diabetic activities of the plant. Therefore the alpha amylase inhibition activity of aqueous extract from pluchea leaves and green tea mixtures at various proportions may be contributed by phytochemical compounds (table 1).
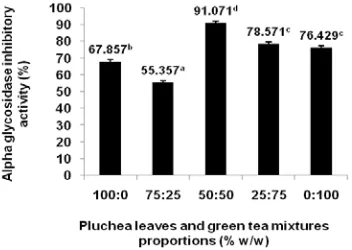
α-Glucosidase inhibitory activity
The α-glucosidase inhibitory activity of the extracts is summarised in fig. 6. Data showed that the 50:50 proportions of pluchea leaves and
green tea mixtures had the highest inhibitory α-amylase activity
compared to the other proportions. The green tea extract had the higher alpha glycosidase inhibitory activity than it of pluchea leaves extract. However, the TPC and TFC of green tea extract were lower than them of pluchea leaves extract. This phenomenon indicated that the alpha glycosidase inhibitory activity was no be caused by phenolic compounds activity but it was contributed the other phytochemicals.
Lim and Loh [45] reported that the α-glucosidase inhibition activity of
bound phenolic extract has higher than free soluble phenolic extract
because the bound phenolic mostly exists in a β-glycosides form that
prefers aqueous phase than the free phenolic which is in the form of aglycones, a non-sugar group. Thus, direct enzyme-inhibitor interaction
is predicted to be higher in bound phenolic extracts in the α-glucosidase
assay. McCue et al. [48] reported that the mechanisms of inhibition for α
-glucosidase may different from α-amylase. There is none disulphide bridges especially not on the surface of the molecule (possible site for
interaction with antioxidants) on the structure of Baker’s yeast α
-glucosidase. This indicated that the α-glucosidase inhibition activity of phenolic extracts doesn’t involve the interaction of the antioxidant capacity with the disulphide bridges. Therefore, the inhibition is caused by the phenolic extracts through another mechanism. There was a correlation among the TPC, TFC and alpha glycosidase inhibitory activity.
Oboh et al. [49] said that the higher inhibitory activities also are
contributed by the presence of some non-phenolic phytochemicals that probably act as enzyme inhibitors, exhibiting an additive or synergism effect with the phenolics present in the sample.
Fig.6: α-Glycosidase inhibitory activity of aqueous extract of pluchea leaves and green tea mixtures at various proportions
(n=5, Values expressed as mean±SD. Data were analyzed by one-way analysis of variance (ANOVA) followed by duncan's
multiple range test (DMRT))
CONCLUSION
The antioxidant activity and alpha glycosidase inhibitory activity of aqueous extract in pluchea leaves and green tea mixtures at various proportions were correlated with TPC and TFC, but the alpha amylase inhibitory activity wasn’t. There was contributed by the other phytochemicals to the alpha amylase inhibitory activity. The inhibition mechanism of alpha amylase and alpha glycosidase was different.
AUTHORS CONTRIBUTION
The first and second authors have participated in the work including participation in the concept, design, analysis, writing, and revision of the manuscript.
ACKNOWLEDGEMENT
The authors would like to thank the directorate general higher education (DIKTI) of the Indonesian’s Government for the financial support (The competitive research grant) and Widya Mandala Catholic University in Surabaya for this research.
CONFLICTS OF INTERESTS
Authors declare no conflicts of interest
REFERENCES
1. Widyawati PS, Wijaya CH, Hardjosworo PS, Sajuthi D.
Antioxidant activity of pluchea (Pluchea indica Less) leaves
methanolic extract and its fractions. Agritech 2012;32:249-57.
2. Widyawati PS, Budianta TDW, Kusuma FA, Wijaya EL.
Difference of solvent polarity to phytochemical content and antioxidant activity of Pluchea Indica less leaves extracts. Int J Pharm Pharm Res 2014a;6:850-5.
3. Widyawati PS, Budianta TDW, Kusuma FA, Wijaya EL, Yaunatan
DI, Wongso RS. Potency of beluntas (Pluchea indica Less) leaves
to extract as antioxidant and anti warmed over flavor (WOF) of duck meat. International Congress Challenges of Biotechnological Research in Food and Health. Surakarta; 2014b.
4. Widyawati PS, Budianta TDW, Utomo AR, Harianto I. The
physicochemical and antioxidant properties of Pluchea Indica Less
drink in tea bag packaging. Int J Food Nut Sci 2016;5:113-20.
5. Srisook K, Buapool D, Boonbai R, Simmasut P, Charoensuk Y,
Srisook E. Antioxidant and anti-inflammatory activities of hot
water extract from Pluchea indica Less herbal tea. J Med Plants
Res 2012;6:4077-81.
6. Widyawati PS, Budianta TDW, Gunawan DI, Wongso RS.
Evaluation antidiabetic activity of various leaf extracts of
Pluchea indica Less. Int J Pharm Pharm Res 2015;7:597-603.
7. Widyawati PS, Wijaya CH, Hardjosworo PS, Sajuthi D. Evaluation of
antioxidant activity from pluchea leaves extract (Pluchea indica
Less) based on leaf segment level. Rekapangan J 2011;5:1-14.
8. Carvalho M, Jerónimo C, Valentão P, Andrade PB, Silva BM.
Green tea: a promising anticancer agent for renal cell carcinoma. Food Chem 2010;122:49–54.
9. Moderno PM, Carvalho M, Silva BM. Recent patents on Camellia
sinensis: Source of health promoting compounds. Recent Patents Food Nut Agric 2009;1:182–92.
10. Yang CS, Lambert JD, Hou Z, Ju J, Lu G, Hao X. Molecular targets
for the cancer preventive activity of tea polyphenols. Mol Carcinog 2006;45:431–5.
11. Peres RG, Tonin FG, Tavares MFM, Rodriguez-Amaya DB.
Determination of catechins in green tea infusions by reduced flow micellar electrokinetic chromatography. Food Chem 2011; 127:651–5.
12. Kang KW, Oh SJ, Ryu SY, Song GY, Kim BH, Kang JS, et al. Evaluation
of the total oxy-radical scavenging capacity of catechins isolated from green tea. Food Chem 2010;121:1089–94.
13. Molan AL, Flanagan J, Wei W, Moughan PJ. Selenium-containing
green tea has higher antioxidant and prebiotic activities than regular green tea. Food Chem 2009;114:829–35.
14. Miura T, Koike T, Ishida T. Antidiabetic activity of green tea
(Thea Sinensis L.) in genetically type 2 diabetic mice. J Health Sci 2005;51:708-10.
15. Mota MADL, Landim JSP, Targino TSS, Da Silva S FR, Da Silva
SL, Pereira MRP. Evaluation of the anti-inflammatory and
analgesic effect of green tea (Camellia sinensis) in mice. Acta Cir
16. Deetae P, Parichanon. P, Trakunleewatthana P, Chanseetis C, Lertsiri S. Antioxidant and anti-glycation properties of thai herbal teas in comparison with conventional teas. Food Chem 2012;133:953-9.
17. Harborne JB. Phytochemical Method. Padmawinata K, Soediro I.
Eds. Bandung: Institut Teknologi Bandung; 1996.
18. Singleton VL, Orthofer R, Lamuela-Raventos RM. Analysis of total
phenols and other oxidation substrates and antioxidants by means of folin–ciocalteu reagent. Methods in Enzymol 1999;99:152-78.
19. Al-Temimi A, Choudhary R. Determination of antioxidant
activity in different kinds of plants in vivo and in vitro by using diverse technical methods. J Nut Food Sci 2013;3:1-9.
20. Brand-Williams W, Cuvelier ME, Berset C. Use of a free radical
method to evaluate antioxidant activity. Lebensm Wiss Technol 1995;28:25-30.
21. Chanda S, Dave R. In vivo models for antioxidant activity
evaluation and some medicinal plants possessing antioxidant properties: an overview. Afr J Microbiol Res 2009;3:981-96.
22. Bernfeld P. Amylases, alpha and beta. In: Colowick SP, Kaplan
NO. Eds. Methods in Enzymology. Vol. 1. New York: Academic Press; 1955. p. 149-58.
23. Da Silva Pinto M, Kwon YI, Apostolidis E, Lajolo FM, Genovese
MI, Shetty K. Functionality of bioactive compounds in Brazilian
strawberry (Fragaria x ananassa Duch.) cultivars: evaluation of
hyperglycemia and hypertension potential using in vitro
models. J Agric Food Chem 2008;56:4386-92.
24. Wadood A, Ghufran M, Jamal SB, Naeem M, Khan A, Ghaffar
R, et al. Phytochemical analysis of medicinal plants occurring in the local area of mardan. Biochem Anal Biochem 2013;2:2-4.
25. Keerthana G, Kalaivani MK, Sumathy A. In vitro alpha amylase
inhibitory and antioxidant activities of ethanolic leaf extract of Croton Bonplandianum. Asian J Pharm Clin Res 2013;6 (Suppl 4): 32-6.
26. Dastjerdi ZM, Namjoyan F, Azemi ME. Alpha amylase inhibition
activity of some plants extract of teucrium species. Eur J Biol Sci 2015;7:26-31.
27. Nanumala SK, Tulasi P, Sujitha E. In vitro antidiabetic activity of
seed extracts of Cassia auriculata and Cassia angustifolia. Eur J
Exp Biol 2015;5:12-7.
28. Hung PV, Duy TL. Effects of drying methods on bioactive
compounds of vegetables and correlation between bioactive compounds and their antioxidants. Int Food Res J 2012;19:327-32.
29. Adefegha SA, Oboh G. In vitro inhibition activity of
polyphenol-rich extracts from Syzygium aromaticum (L.) Merr. and perry
(Clove) buds against carbohydrate hydrolyzing enzymes linked
to type 2 diabetes and Fe2+
30. Priecina L, Karlina D. Total polyphenol, flavonoid content and
antiradical activity of celery, dill, parsley, onion and garlic dried
in convention and microwave-vacuum dryers. 2nd
International Conference on Nutrition and Food Sciences IPCBEE. Vol. 53. Singapore: IACSIT Press; 2013.
-induced lipid peroxidation in rat pancreas. Asian Pac J Trop Biomed 2012;2:774-81.
31. Andarwulan N, Batari R, Sandrasari DA, Bolling B, Wijaya H.
Flavonoid content and antioxidant activity of vegetables from Indonesia. Food Chem 2010;121:1231-5.
32. Calado JCP, Albertão PA, Aparecida de Oliveira E, Letra MHS,
Sawaya ACHF, Marcucci MC. Flavonoid contents and antioxidant activity in fruit, vegetables and other types of food. Agric Sci 2015;6:426-35.
33. Stanković MS. Total phenolic content, flavonoid concentration
and antioxidant activity of Marrubium Peregrinum L. extracts.
Kragujev J Sci 2011;33:63-72.
34. Stanojević L, Stanković M, Nikolić V, Nikolić L, Ristić D,
Čanadanovic-Brunet J, et al. Antioxidant activity and total
phenolic and flavonoid contents of Hieracium pilosella L.
extracts. Sensors 2009;9:5702-14.
35. Da Silva MCA, Paiva SR. Antioxidant activity and flavonoid
content of Clusia fluminensis Planch. and Triana. An Acad Bras
Cienc 2012;84:609-16.
36. Bag GC, Devi PG, Bhaigyabati TH. Assessment of total flavonoid
content and antioxidant activity of methanolic rhizome extract
of three Hedychium species of manipur valley. Int J Pharm Sci
Rev Res 2015;30:154-9.
37. Pontis JA, Da Costa LAMA, Da Silva SJR, Flach A. Color, phenolic
and flavonoid content, and antioxidant activity of honey from Roraima, Brazil. Food Sci Tech Campinas 2014;34:69-73.
38. Ghasemia K, Ghasemia Y, Ebrahimzadeh MA. Antioxidant
activity, phenol and flavonoid contents of 13 citrus species peels and tissues. Pak J Pharm Sci 2009;22:277-81.
39. Alaa S, Abdellah M, Hamadi L. Phytochemical screening,
contribution to the study of the anti fungal effect of flavonoids
from different parts of Ziziphus lotus of south west Algeria.
Asian J Pharm Clin Res 2017;10:13-6.
40. Rohman A, Riyanto S, Yuniarti N, Saputra WR, Utami R,
Mulatsih W. Antioxidant activity, total phenolic, and total
flavaonoid of extracts and fractions of red fruit (Pandanus
conoideus Lam). Int Food Res J 2010;17:97-106.
41. Har LW, Ismail IS. Antioxidant activity, total phenolics, and
total flavonoids of Syzygium polyanthum (Wight) Walp leaves.
Int J Med Arom Plants
42. Chlopicka J, Pasko P, Gorinstein S, Jedryas A, Zagrodzki P. Total
phenolic and total flavonoid content, antioxidant activity and sensory evaluation of pseudocereal breads. LWT Food Sci Technol 2012;46:548-55.
2012;2:219-28.
43. Ruskin RS, Vasanthakumari B, Citarasu T. In vitro activity of
various leaf extracts of Canthium coromandelicum (Burm F.)
Alston. Asian J Pharm Clin Res 2017;10:214-8.
44. Gholivand MB, Piryaei M. The antioxidant activity, total
phenolics and total flavonoids content of Bryonia dioica Jacq.
Biologija 2012;58:99–105.
45. Lim SM, Loh SP. In vitro antioxidant capacities and antidiabetic
properties of phenolic extracts from selected citrus peels. Int Food Res J 2016;23:211-9.
46. McCue P, Vattem D, Shetty K. Inhibitory effect of clonal oregano
extracts against porcine pancreatic amylase in vitro. Asian
Phram J Clin Nut 2004;13:401-8.
47. Akah PA, Uzodinma SU, Okolo CE. Antidiabetic activity of
aqueous and methanol extract and fractions of Gongronema
latifolium (Asclepidaceae) leaves in alloxan diabetic rats. J Appl Pharm Sci 2011;1:99-102.
48. McCue P, Kwon YI, Shetty K. Anti-diabetic and antihypertensive
potential of sprouted and solid-state bioprocessed soybean. Asian Pharm J Clin Nut 2005;14:145-52.
49. Oboh G, Akinyemi AJ, Ademiluyi AO, Adefegha SA. Inhibitory
effects of aqueous extract of two varieties of ginger on some
key enzymes linked to type-2 diabetes in vitro. J Food Nut Res
2010;49:14-20.
How to cite this article
• Paini Sri Widyawati, Yesiana DW Werdani, Christine
Setiokusumo, Adriana Kartikasari. In vitro antioxidant