INTRODUCTION
In Indonesia, corn is one of food sources which has important role for human and animal life. Centre of corn production in In-donesia is located 65% in Java and others are spread in Lampung, South Sulawesi and Nusa Tenggara. In Java island, corn was cultivated on dry land (77%) and field (23%) (Adi and Widyastuti, 2001). Production of corn in 2013 was 18.511.853 ton/ha then it increased to 20.666.702 ton/ha in 2015.
The growth of corn until reaching physiologic mature stage needs 120-180 kg/ha of nitrogen, while N which is carried to plant until harvesting and yielding are 129-165 kg/ha and 9,5 ton/ha,
respectively (Suwardi and Roy Efendi, 2009). To fulfill the needs of nitrogen in corn, cultivation of intercrop which could supply N (legume) is needed. One of legume plants is peanut which could fix nitrogen to available. Peanut is one of food sources which has high protein and con-tains niacin, magnesium, vitamin C, mangan, krom and others (Astanto, 2005). Peanut produc-tion in 2013 to 2014 decreased from 701.680 ton/ha to 638.896 ton/ha and increased to 657,595 ton/ha in 2015.
Vegetative growth stage of peanut plants begins from germination to first flowering on
26-31st days after planting (Trustinah, 1993). On
The Effect of Intercropping System of Corn (
Zea mays
, L.) and
Peanut (
Arachis hypogaea
, L.) on Yield Production in Ungaran
DOI: 10.18196/pt.2017.068.88-95
Dharend Lingga Wibisana*, Gunawan Budiyanto, Titiek Widyastuti Department of Agrotechnology, Faculty of Agriculture, Universitas Muhammadiyah Yogyakarta,
Jl. Lingkar Selatan, Kasihan, Bantul, Yogyakarta 55183, Indonesia Telp. 0274 387656, *Corresponding author, email: [email protected]
ABSTRACT
The research was conducted to examine transfer nitrogen from peanut to corn and determine the best planting time of peanut and corn which were cultivated by intercropping system. The research was conducted at dryland of Ungaran Central Java from December 2015 to April 2016. This research was complated using an experimental design with single factor, arranged in completely randomized block design. The treatments were monoculture system of corn (J), monoculture system of peanut (K), intercropping system: corn was planted two weeks after peanut (TS 1), intercropping system: peanut was planted two weeks after corn (TS 2), and intercropping system: corn and peanut were planted in the same time (TS 3). Each treatment was replicated 3 times. The results showed that the transfer of nitrogen from peanuts to corn occured when the corn plants were in the stage of maximum vegetative growth. In this research, treatment TS 2 is the best planting time than other treatments as indicated by the yield of 4.02 tonnes corn per hectare.
Keywords: Nitrogen, Peanuts, Corn, Monoculture System, Intercropping system
ABSTRAK
Penelitian ini dilakukan untuk mengetahui transfer nitrogen kacang tanah pada tanaman jagung dan penentuan waktu tanam jagung dan kacang tanah yang dibudidayakan secara tumpangsari. Penelitian ini telah dilaksanakan di Lahan Kering Kecamatan Ungaran, Jawa Tengah pada bulan Desember 2015 sampai April 2016. Penelitian ini dilaksanakan menggunakan metode eksperimental dengan faktor tunggal yang disusun dalam rancangan acak kelom-pok lengkap. Perlakuan yang diujikan yaitu Jagung monokultur (J), Kacang tanah monokultur (K), Tumpangsari Jagung ditanam 2 minggu setelah tanam kacang tanah (TS 1), Tumpangsari kacang tanah ditanam 2 minggu setalah tanaman jagung (TS 2), dan Tumpangsari Jagung dan Kacang Tanah ditanam bersamaan (TS 3). Setiap perlakuan diulang 3 kali dalam blok. Hasil penelitian ini menunjukkan bahwa transfer nitrogen terjadi pada saat tanaman jagung memasuki pertumbuhan vegetatif maksimum. Perlakuan TS 2 merupakan waktu tanam terbaik dari perlakuan lainnya yang ditunjukkan dengan hasil 4,02 ton jagung per hektar.
vegetative stage, nodule is formed and it fixes Nitrogen. Amin (2007) said that shading the plant from first reproduction stage until before harvesting could cause decreasing of yield about 45%. Therefore, if peanut is intercropped with corn, the growth of peanut could be decreased due to light reduction.
Nitrogen fixation is process where nitrogen from atmosphere is converted to ammonium, ionic form of nitrogen which is available for plant (Budiyanto, 2016). Nitrogen fixation on legume which is planted with non-legume could provide Nitrogen source for non-legume. Reeves (1990) said that transfer of Nitrogen was visible and important in the condition of low Nitrogen availability. Fujita et. al. (1992) said that 24,9%
of nitrogen fixed by Cowpea (Vigna unguiculata
L.) was transferred to corn and 10,4% of nitro-gen was transferred from soybean to corn. The number of nitrogen fixation through leguminose was 80-140 kg/ha per year (Rao, 1797). Gener-ally, nitrogen is taken in the form of ammonium
(NH4+) and nitrate (NO
3
-), but nitrate which is
taken soon will be reduced become ammonium through enzym containing molybdenum (Hary, 2008).
The cultivation of corn with peanut as inter-crop is called interinter-cropping system. Interinter-crop- Intercrop-ping system is one of cultivating systems where there are two or more different plants which are planted in the same or different time with regu-lar spacing on an area (Sarman, 2001). Buhaira (2007) said that peanut cultivation between two rows of corn on 100 cm space yielded 2,93 ton/ ha dry pod. The intercropping of peanut and corn could increase the efficiency of fertilizer and land use under appropriate planting space and time. Sarman and Ardiyaningsih (2000) cit. Buhaira (2007) said that double row of corn with 140 cm plant spacing between double rows x 40
cm significantly affected yield of corn, leaf area of soybean and dry weight of corn plant. While during the period of growth until postharvest, corn plants could be more competitive or aggres-sive than soybean with single row plant spacing (100 cm x 40 cm).
The aim of this research was to understand the effect of transfer of nitrogen from peanut to corn and determine appropriate planting time interval between peanut and corn by intercrop-ping system.
MATERIALS AND METHODS
The research was conducted at dryland Ungaran, Semarang and research laboratory of Faculty of Agriculture, Universitas Muhammadi-yah Yogyakarta. This research was conducted using an experimental design with single factor, arranged in completely randomized block design. The treatments were :
J = monoculture system of corn K = monoculture system of peanut
TS 1 = intercropping system, corn was planted two weeks after peanut
TS 2 = intercropping system, peanut was planted two weeks after corn
TS 3 = intercropping system, corn and peanut were planted in the same time
Each treatment was replicated 3 times. The observation was carried out on vegetative growth, generative growth and growth analysis.
RESULTS AND DISCUSSIONS
Vegetative Growth Plant Height
Measuring plant height purposed to deter-mine the vegetative growth process of the plant. The results showed that all treatments have same effect on corn and peanut. The average plant height of corn and peanuts are presented in Table 1.
Table 1. Plant Height of Corn and Peanut Plants
Treatments Plant Height (cm)
Corn 7 weeks old Peanuts 5 weeks old
J 121.83
-K - 26.00
TS 1 131.40 29.93
TS 2 145.93 28.80
TS 3 116.53 23.53
Note: The numbers in the table indicate no significant difference based on the analysis of variance at 5%.
J : Monoculture system of corn K : Monoculture system of peanut
TS 1 : Intercropping system, corn was planted two weeks after peanut TS 2 : Intercropping system, peanut was planted two weeks after corn TS 3 : Intercropping system, corn and peanut were planted in the same time
Table 1 showed that all treatments have same effect because when the corn plants were 7 weeks old (49 day after planting (DAP)) or in the stage of forming male flowers in which they needed high Nitrogen, the peanut plants in the treat-ment TS1 were 9 weeks old (63 DAP) or in the
forming of filled-seed phase in which they didn’t not require high nitrogen. In the treatment TS2, the peanut plants were 5 weeks old (35 DAP) or in the forming of gynophore phase requiring low Nitrogen. While on treatment TS3, the peanut plants were 7 weeks old (49 DAP) or in the form-ing filled-pods phase that did not require nitro-gen in high amounts. Therefore, the nitronitro-gen ele-ment produced by the peanut plants can be used for the growth of corn plants.
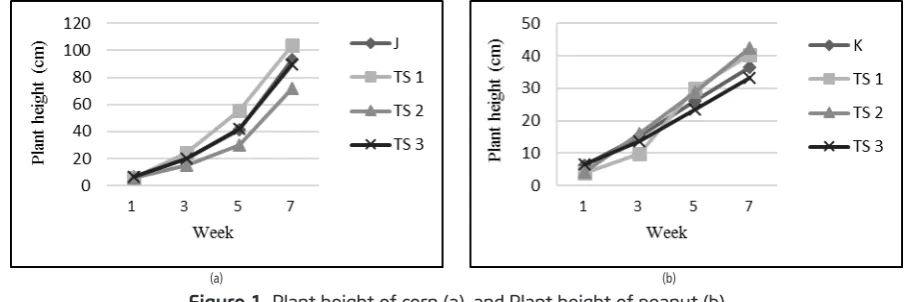
In peanut crops, the average of plant height on 5 weeks after planting in showed that all treat-ments have same effect (Table 1). The peanut plants in the treatment TS1, TS2 and TS3 on 5 weeks after planting were shaded by corn that resulted in disruption of the sunlight absorp-tion during photosynthesis and it led to the high growth of peanut plants, while the peanut plants in the treatment K were likely to get full absorp-tion of sunlight resulted in slower growth of pea-nut plants because peapea-nut plants were included to the plants requiring partial sunlight absorp-tion. The plant height of corn and peanuts on
the 1-7th week were presented in Figure 1.
Number of Leaves
The result showed that all treatments have
(a) (b)
Figure 1. Plant height of corn (a), and Plant height of peanut (b)
Note: J: Monoculture system of corn K: Monoculture system of peanut
same effect on number of leaves. The average of the number of leaves of corn and peanut plants were presented in Table 2.
Table 2. Number of Leaves of Corn and Peanut Plants
Treatments Number of Leaves (Sheet) Corn 7 weeks old Peanuts 5 weeks old
J 16,00
-K - 34,06
TS 1 16,06 38,46
TS 2 15,73 37,33
TS 3 15,80 31,40
Note: The numbers in the table indicate no significant difference based on the analysis of variance at 5%.
J : Monoculture system of corn K : Monoculture system of peanut
TS 1 : Intercropping system, corn was planted two weeks after peanut TS 2 : Intercropping system, peanut was planted two weeks after corn TS 3 : Intercropping system, corn and peanut were planted in the same time
Table 2 showed that the treatments have the same effect. When the corn plants were 7 weeks (49 DAP) entering generative growth phase indicated by the emergence of male flowers and the forming of the last leaf, the element of nitrogen was available from the peanut plants in the treatment TS1, TS2, and TS3. When the corn plants entered the phase of ear and seeds formation, the needs for Nitrogen element in the process of photosynthesis in vegetative growth has decreased (reduced). Actually, the element of nitrogen in plant growth affects leaf area and
pre-vents chlorosis, but it does not always determine the number of leaves formed.
Table 2 also showed that all treatments gave the same effect on number of leaves of peanut plants. This is because the peanut plants aged 5 weeks (35 DAP) has reached the phase of gyno-phore formation, so that the need for nitrogen in the vegetative growth of peanut plants decreased. The growth factor is does not always specify the number of leaves however, the influence of internal factors on peanut plants like the origi-nal gene of the peanut plants can determine the number of leaves that are formed in the vegetative growth phase and with the support of climatic conditions (environment) which both will affect the photosynthesis process, so that the leaves formation of peanut plants can still hap-pen. The data on number of leaves of corn and
peanut plants on the 1-7th week were presented
in Figure 2.
Generative Growth
Generative Growth of Corn
Yield component of corn consists of the number of ear, weight of ear with husk, grain dry weight and weight of 100 grains. The data were presented in Table 3. Table 3 showed that
(a) (b)
Figure 2. Number of leaves of corn plants (a), and Number of leaves of peanut plants (b)
Note: J: Monoculture system of corn K: Monoculture system of peanut
all treatments have same effect on the number of ear. It occurred because the peanut plants which supplied N began to enter generative phase so that Nitrogen production was decreased. It caused the low N when the second ear appeared. The low availability of N and fixed N was also caused by high rain fall.
The result showed that the weight of earwith
husk on all treatments were same. It is because the peanut plants supplied N for ear formation, but deficit of K during carbohydrates synthesis
in the grain could affect the weight of earwith
husk. Harvesting which was conducted after rain also affected the humidity of the husk.
Table 3. Number of Ear, Weight of Ear with Husk, Grain Dry Weight and Weight of 100 Grains
Treatments Number
Note: The numbers in the table indicate no significant difference based on the analysis of variance at 5%.
J : Monoculture system of corn
TS 1 : Intercropping system, corn was planted two weeks after peanut TS 2 : Intercropping system, peanut was planted two weeks after corn TS 3 : Intercropping system, corn and peanut were planted in the same time
The result showed that the dry weight of grain of all treatments were significantly differ-ent. Table 3 showed that grain dry weight of corn on TS2 was better than the others. It is because when the corn plants entered ear forma-tion phase (7 weeks), they need high N, while the peanut plants on TS1 were 9 weeks which entered pod and grain filling phase, so that N production was lower than on J. On TS2, the peanut plants were 5 weeks which entered gyno-phore formation phase, so that N production on their root was occurring meanwhile their need of N decreased, so that the N availability for the corn plants was high during ear and grain filling
phase. While on TS3, the peanut plants were 7 weeks which entered pod formation phase. In that phase, their need of N decreased, but N production was occurring so it could fulfill the N need of corn during ear and grain formation.
There was no significant difference on weight of 100 grains among all of treatments. Table 3 showed that intercropping the peanut plants gave the same effect on weight of 100 grains of corn compared to monoculture system. It is because the cell division of ear was occurring. It affected the form and size of the grains, which were also affected by nutrients especially N. Besides, the solid grain of corn was due to complete composi-tion of K in carbohydrate formed in corn grain.
Generative Growth of Peanut
Observation was carried out on number of pod, pod dry weight, and weight of 100 grains. The data were presented in Table 4.
Table 4. Number of Pod, Pod Dry Weight, and Weight of 100 Grains of Peanut
Treatments Number of pod Pod dry weight (g) Weight of 100 grains (g)
K 26,13 631,67 a 54,50
TS 1 28,73 466,67 b 53,63
TS 2 25,66 383,33 b 52,71
TS 3 24,80 385,00 b 50,51
Note: The numbers in the table indicate no significant difference based on the analysis of variance at 5%.
K : Monoculture system of peanut
TS 1 : Intercropping system, corn was planted two weeks after peanut TS 2 : Intercropping system, peanut was planted two weeks after corn TS 3 : Intercropping system, corn and peanut were planted in the same time
N for ear forming. While on TS3, the peanut plants were 7 weeks after planting (max filling of grain) in which the need of N decreased. Trusti-nah (1993) mentioned that reproductive phase of peanut was divided into 8 stadia, that were flow-ering (27-37 DAT), gynophore forming (32-36 DAT), pod forming (40-45 DAT), max pod filling (44-52 DAT), grain forming (52-57 DAT), max grain filling (60-68 DAT), maturing of grain (68-75 DAT) and mature harvesting (80-100 DAT).
There was significant difference on pod dry weight between monoculture and intercropping system (Table 4). Monoculture system produced the highest pod dry weight while TS1, TS2 and TS3 were the same. It is because monoculture system has the highest population. Beside that size and number of pod forming on K because of availability of N from peanut used for peanut without corn.
Table 4 showed that there was no significant difference on 100 grains weight among all treat-ments because the nutrients especially N affected pod forming on 6-7 weeks after planting, while pod forming would determine the size of and uniformity of the grain. It means that the compe-tition of N absorption between peanut and corn would cause the varied size of grain and affect the weight of 100 grains.
Yield and Land Equivalent Ratio (LER) of Corn and Peanut
The analysis results on yield of corn and peanut which was converted to ton/ha showed that there was significant difference among all treatments. While the results of analysis on LER showed that there was significant difference between monoculture and intercropping system. The average of yield and LER were presented in Table 5.
Table 5. Yield and Land Equivalent Ratio of Corn and Peanut
Treatments Yield of Corn (ton/ha) Yield of Peanut (ton/ha) LER
J 2,62 b -
-K - 2,58 a
-TS 1 2,35 b 1,91 b 1,76 b
TS 2 4,02 a 1,58 b 2,29 a
TS 3 2,64 b 1,59 b 1,63 b
Note: The numbers in the table indicate no significant difference based on the analysis of variance at 5%.
J : Monoculture system of corn K : Monoculture system of peanut
TS 1 : Intercropping system, corn was planted two weeks after peanut TS 2 : Intercropping system, peanut was planted two weeks after corn TS 3 : Intercropping system, corn and peanut were planted in the same time
Table 5 showed that yield of TS2 was higher than monoculture. It showed that intercrop-ping system of corn and peanut was better than monoculture system. Yield of TS1 and TS3 was same with monoculture system. But the average
(a) (b)
Figure 3. Number of leaves of corn plants (a), and Number of leaves of peanut plants (b)
Note: J: Monoculture system of corn K: Monoculture system of peanut
of corn yield on TS2 was not in accordance with certification standard. Balai Penelitian Tanaman Serealia (2010) determined that corn Bisi 18 have average yield about 9,1 ton/ha while in this re-search it only reached 4,03 ton/ha of dry shelled corn (Figure 3a). It occurred because the ear growth on TS2 was bigger than other which re-sulted in higher number of grain. Besides, when entering ear forming phase (7 weeks) which needs high N, the peanut plants on TS1 was 9 weeks after planting where N fixation decreased leading to lower availability of N compared to J. On TS2, the peanut plants were entering gyno-phore forming phase (5 weeks) in which N fixa-tion was occurring. Therefore, the N availability ear formation was increased. While on T3, the peanut plants were entering pod forming phase (7 weeks) where the need of N decreased but the N fixation was occurring resulted in the provi-sion of N to develop ear and grain.
The dry pod of peanut for monoculture system was higher than other because the growth process was without disturbance of climate dur-ing flowerdur-ing process so that the pod formdur-ing was optimal (Table 5). Besides, it was affected by bigger size and higher number of pod. The max yield in this research was 2,5 ton/ha (Figure 3b), which is in accordance with Suhartina (2005) who reported that peanut cv. Gajah reached 1,8-2,0 ton/ha of dry pod.
LER of TS2 was higher than other treatments (Table 5). While, TS1 and TS3 have the similar of LER value. If the value of LER is more than 1, it means intercropping system was success because it produced the higher yield than mono-culture did. The high value of LER means that productivity of land was also high. High pro-ductivity of land showed that the land use was maximal. In the same area, intercropping system produced higher yield than monoculture system.
CONCLUSION
Transfer of nitrogen from peanut to corn occurred when the corn plants were in the stage of maximum vegetative growth. In this research, intercropping system of peanut which was culti-vated 2 weeks after corn was is the best planting system as indicated by the yield of 4.02 ton corn per hectare. Farmers who will cultivate practicing intercropping system of corn and peanut are rec-ommended to plant peanut 2 weeks after corn. The next research needs to consider the better planting time of peanut and corn, the parameter used and the time when nitrogen production decreases.
ACKNOWLEDGEMENTS
Thanks to PT. Indofood Sukses Makmur, Tbk that has provided research grants through Indo-food Riset Nugraha 2015/2016 program. We also greatly appreciate to the two anonymous review-ers who gave us valuable and fruitful comments.
REFERENCES
Adi Sarwanto and Widyastuti. 2001. Increasing Corn Production. Penebar Swadaya.Jakarta.86 p.
Afandhie Rosmarkam and Nasih W.Y. 2002. Study of Soil Fertil-ity. Kanisius. Yogyakarta. 224 p.
Amin Zuhri. 2007. Optimalisasi Hasil Tanaman Kacang Tanah Dan Jagung Dalam Tumpangsari Melalui Pengaturan Baris Tanam Dan Perompesan Daun Jagung. Embryo 4(2): 156-163.
Astanto Kasno. 2005. Proil dan Perkembangan Teknik Produksi
Kacang Tanah di Indonesia. Makalah Seminar. Seminar Rutin Puslitbang Tanaman Pangan Bogor.
Badan Pusat Statistik. 2015. Survey of Agriculture : Corn and Peanut Productionin Indonesia on year 2013 – 2015. Ac-cessed on 1 july 2015. www.bps.go.id.
Balai Penelitian Tanaman Serealia. 2010. DescriptionSuperior Variety of Corn. Center of Research and Development Food Crop in Research Center of Sereal Crops. Maros. 118 p. Budiyanto, G. 2016. Pengendalian Pencucian Senyawa Nitrat
Guna Meningkatkan Produktivitas Lahan Marginal Pantai Ku-lon Progo DIY. PLANTA TROPIKA: Jurnal Agrosains (Journal Of Agro Science) 4(1): 46-57. doi:http://dx.doi.org/10.18196/ pt.2016.056.46-57.
Fujita K., Ofusu-Budu, K.G., and Ogata, S. 1992. Biological Ni-trogen Fixation in Mixed Legume-Cereal Cropping Systems.
Plant and Soil 141 (1-2): 155-175.
Gardner, F. P., R. B. Dearce dan R. L. Michell. 1991. Physiologhy of Crops (Translator Herawati Susilo). UI Press. Jakarta. 428 p. Hary Sarsini. 2008. Pengaruh Pengolahan Tanah Dan Pupuk N
Serta Pupuk Kandang Terhadap Serapan Ca, S Dan Kualitas Hasil Kacang Tanah (Arachis hypogaea L.) pada alisols. Skipsi. Fakultas Pertanian. Universitas Sebelas Maret Sura-karta. SuraSura-karta. 110 p.
Mul Mulyani Sutejo. 2002. Fertilizers and Fertilitation Way. Rineka Cipta. Jakarta. 177 p.
Reeves, M. 1992. The Role of VAM Fungi in Nitrogen Dynamics in Corn-Bean Intercrops. Plant and Soil 144 (1): 85-92. Sarman S. 2001. Kajian Tentang Kompetisi Tanaman dalam
Sistem Tumpangsari di Lahan Kering. Jurnal Agronomi 5 (1): 89-96
Suhartina. 2005. Description Superior Sariety of Peanuts and Tubers. Reasearch Center of Peanuts and Tubers Crop. Malang. 153 p.
Suwardi and Roy Efendi. 2009. Eisiensi Penggunaan Pupuk N
Pada Jagung Komposit Menggunakan Bagan Warna Daun. Ba-lai Penelitian Tanaman Serealia. Prosiding Seminar Nasional Serealia.