Bobbi Low
*, Robert Costanza
, Elinor Ostrom
, James Wilson
,
Carl P. Simon
eaSchool of Natural Resources and En6ironment,Uni6ersity of Michigan,Dana Building,430East Uni6ersity,Ann Arbor, MI48109-1115,USA
bUni6ersity of Maryland Institute for Ecological Economics,Center for En6ironmental Science,Uni6ersity of Maryland,Box38, Solomons,MD20688-0038,USA
cWorkshop in Political Theory and Policy Analysis,Indiana Uni6ersity,513North Park,Bloomington,IN47408-3895,USA dSchool of Marine Sciences,Uni6ersity of Maine,5782Winslow Hall,Orono,ME04469-5782,USA
eMathematics,Economics,and Public Policy,Uni6ersity of Michigan,412Lorch Hall,Ann Arbor,MI48109-1220,USA
Abstract
We develop an interactive simulation model that links ecological and economic systems, and explore the dynamics of harvest patterns as they simultaneously affect natural and human capital. Our models represent both single and multiple systems. The level of natural capital is influenced by interactions of (1) natural capital growth and (non-human influenced) depletion, (2) ecological fluctuations, (3) harvest rules, and (4) biological transfers from one ecological system to another. We focus first on isolated systems in which there are no biological transfers between units and humans rely for subsistence on the resource; thus both the economic and ecological portions of the system are relatively independent of other systems. In this case, the maximum sustainable harvest rate depends on the local carrying capacity, the stock growth rate, and fluctuations in such ecological variables as rainfall and temperature, which are ‘extrinsic’ to the stock – human harvest, but nonetheless affect stock levels. Next, we address spatially complex situations in which biological resources move from one spatial unit to others. In these models, the greater the potential movement of stocks across ecosystems, the more any particular human sub-system can increase its harvesting rate without danger of its own collapse — although at a cost to neighboring subsystems. © 1999 Elsevier Science B.V. All rights reserved.
1. Introduction
Managing human use of important ecosystem resources to be sustainable can clearly be prob-lematic (McCay and Acheson, 1987; Ludwig et
al., 1993; Jansson et al., 1994). We mine ocean and coastal ecosystems to provide important bio-logical resources — fish, whales, and lobsters, for example — yet these ecosystems remain particu-larly intractable for sustainable resource manage-ment. Both resource stocks and harvesters may cross boundaries; it is difficult-to-impossible to * Corresponding author.
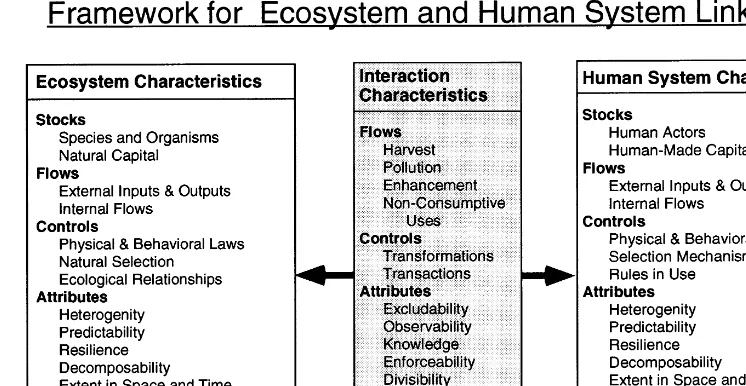
Fig. 1. Ecosystems and human social systems may be structured in parallel ways to facilitate analysis of interactions. Both systems have ‘stocks’ (resource stocks, human-made capital) that result from ‘flows’ (births, deaths, harvests of resource stocks; interests, taxes, and expenditures of human-made capital). ‘Controls’ (physical, behavioral, and legal laws) influence these flows. ‘Attributes’ of stocks and flows include predictability, resilience, efficiency, and extent in time and space.
Fig. 2. A simplified model of an isolated ecosystem in which some resource stock is harvested by humans.
census many resource stocks accurately; numer-ous and varied actors have conflicts over resource use, and may find it difficult to agree on rules. Even when formal agreement exists, if actors ex-ceed quotas, it can be extremely difficult both to monitor (because of physical scope) and to sanc-tion (because agreements are frequently interna-tional and interests differ greatly). Many fisheries resources are common-pool resources, with all the
attendant difficulties in resource management (Os-trom et al., 1994).
Fig. 3. Up to the sustainable harvest limit (here, 24% of carrying capacity), profit (human capital at the end of the 200-year simulation) increases as the harvest limit increases; the effect on natural capital is less dramatic. When sustainable limits are exceeded, the collapse in this model is relatively dramatic; there is little ‘early warning’ that sustainable limits are being approached.
ecosystems, and the impacts of ecological influ-ences such as rainfall or temperature, to name only a few. The relationships among these vari-ables are frequently non-linear. Interactions be-tween human systems and ecosystems also vary along many dimensions — the wealth and power of users, their harvesting strategies, whether any rules exist to limit use of an ecosystem, and the impact of population growth on resource demand, among others.
Such complex, non-linear, interactive systems present challenges. Empirical tests are difficult because field data may not include all variables (particularly those considered external to the sys-tem). Thus, field studies of ecosystems may of necessity ignore important economic, social, and political variables; and studies of human institu-tions and decision-making systems frequently
ig-nore important ecological variables. Yet if
ecological and economic realities interact, both approaches will miss patterns, and make unreli-able predictions.
Because ecosystems are complex, dynamic, and non-linear, no single model is appropriate to all
systems. Here we apply a flexible framework, within which we can construct diverse worlds by specifying five variables:
1. The carrying capacity of the resource system; 2. The regeneration rate at which the stock of a
system can grow;
3. The natural mortality rate of the resource units;
4. The predictability of external influences on stock growth and mortality; and
5. The natural transfer rate from one spatial unit to another.
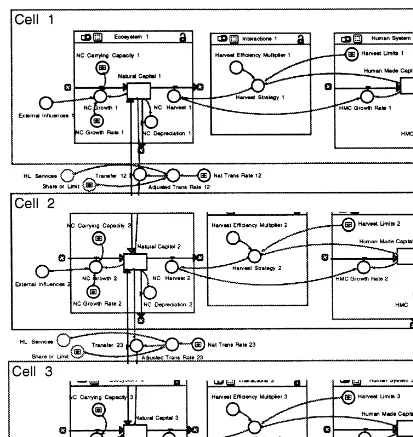
Fig. 5. When resource systems are not isolated, both resource stocks and resource users may move among systems. Here, movement of natural capital is shown.
coastal fisheries — in which the independent ac-tions of fishers in any subsystem can affect the harvests of fishers in other units, and fish can move from one harvesting region to another. In this three-unit system we compare the robustness of additional harvest rules. Wilson et al. (1999) add reality to test effects in structured metapopu-lations versus large single popumetapopu-lations.
Fig. 6. Transfer rates of natural capital and harvesting rates of all units interact. Here, combined harvest rates are reflected by the ‘harvest pressure bias’ ([exploiter rate−MSYe]−[MSYc−conserver rate]). This number increases as all harvest rates increase in any system. When natural capital transfer rates are low, the failure of the highest-harvesting unit is relatively independent of the total harvesting bias, and ‘exploiters’ fail at approximately the same harvest levels as for isolated systems. At higher transfer rates, units that harvest heavily can be protected and persist throughout the run (200 years), up to some harvest bias (e.g. when other units harvest near the MSY, or the exploiter takes]26% of the carrying capacity). This is shown by the flat portion of the high transfer rate curves.
boundaries. We examine the interactions of these as they affect the robustness of a system.
2. Structure of an ecosystem – human system model
Fig. 1 represents a general scheme of parallels between human and ecological systems, and the nature of their interactions (Cleveland et al., 1996). Both ecological and social systems have ‘stocks,’ ‘flows’, and ‘controls’ of those flows. All stocks, flows, and controls have attributes (e.g. richness, predictability). The interaction sector, where human decisions affect resources in ecosys-tems, lacks stocks; it has flows, controls, and attributes.
interacts with physical laws to constrain the life histories and behavior of living components of ecosystems. Ecological relationships (competition, predator – prey, mutualism) result from the inter-action of physical laws and natural selection, and further constrain the type of interactions possible in ecosystems. In human systems, controls include not only the same physical and behavioral laws that influence other species but also cultural rules (mores, laws). In the first model, the principal control in the human sector is simply the harvest rule; later, higher-order political controls will be added.
In interactions between humans and ecosys-tems, two controls, production and consumption, represent major transformations (physical changes of inputs into outputs). In addition, there are transactions: the transfers from one party to an-other, in exchange relationships, of rights to in-puts, outin-puts, and assets. Harvesting rules affect both transformations (how much of the stock is removed) and transactions (who receives the dis-tributions of benefits from productive activities). Here we focus on the effects of rules on transformations.
Attributes are the characteristics of stocks, flows, controls, and the relationships among these (Fig. 1). The number of attributes that potentially affect the capacity of human actors to manage resources sustainably is very large, including at least: heterogeneity, predictability, resilience, de-composability, range of variation, extremeness, extent in space and time, and productivity (Cleve-land et al., 1996). All of these attributes can be measured in ecosystems as well. Here we concen-trate on a limited number of attributes: range of variation (e.g. in ecological fluctuations affecting resources), and extremeness (of growth rates of stock), for example. Because this model includes human and ecosystems interactions, an additional set of attributes can be modeled in this frame-work: excludability, observability, enforceability,
an initial model as possible while retaining the crucial aspects of these complex systems (Fig. 2).
We useSTELLA, a dynamic programming software
(Hannon and Ruth, 1994). This first model repre-sents an isolated fishery, and (like our general framework) has three sectors: ecosystem, human system, and interactions.
3.1. Ecosystem
The ecosystem sector contains one state vari-able, labeled natural capital, that here represents the biomass of fish. Natural capital (NC) grows over time at a rate determined by the carrying capacity of the area, some intrinsic growth or recruitment rate (births, immigration of animal stocks), and a set of external influences. The growth of natural capital is represented by:
NCgrowth=NC×ExtInfl×NCgrowth rate[1-NC/K]
(1)
This formulation reflects logistic stock growth (including ‘r,’ the intrinsic growth rate) as it is influenced by ‘K,’ the carrying capacity, and exter-nal influences (e.g. weather, rainfall, and natural disasters) that can influence this growth rate. We reflect the fact that stocks are reduced by harvest-ing, death, emigration, etc., by the natural capital depreciation rate. We represent human harvest separately from other natural capital depreciation, as harvest strategy, defined in the interactions sector (below), rather than the ecosystem sector.
The overall equation for natural capital is:
d(NC)/dt
= NCgrowth−NCdepreciation−Transfer−NCharvest
(2)
where NCdepreciation=(NCdepreciation rate)*NC. We
xmsy=(KrE/4)(1−(D/Er))
2 (3)
where Kis the carrying capacity, r is the growth
rate, D is the depreciation rate, and E is the
external stochastic influences.
3.2. Human system
In the simplest model, the human system sector also has a single state variable, human made capital (HMC), representing the assets that hu-mans are able to amass to carry out the harvest. Human-made capital fluctuates as a result of its growth rate (e.g. interest), depreciation, and in some cases, taxes (we do not model taxation in this set of models). Depreciation and taxes are set at a value by the researcher to represent particular environments of interest. Here, the growth rate of human capital is simply revenues minus costs,
where revenue is (price per unit of NC)×(amount
of NC harvested) and cost is (cost per unit of
HMC)×(HMC used for harvesting). In these
simulations, we set the (price/unit NC)=10 and
the (cost/unit HMC)=500. As is true for biologi-cal stocks Eq. (2), the stock of human-made capi-tal is a function of prior human-made capicapi-tal, and the growth and depreciation rates for human-made capital:
dHMC/dt=HMCgrowth−HMCdepreciation−Tax
(4)
3.3. Human–ecosystem interaction sector
The interaction sector has no state variables, but two-way flows between ecosystems and hu-man systems. In this initial application we focus on two relationships: harvest efficiency and
har-TE. We call the multiplier (NC×TE) of HMC
the Harvest Efficiency, HE. For resources for which there is no search problem (i.e. when har-vest success is unrelated to resource abundance), we would use a constant HE, independent of NC. Harvest rules can now be chosen. In these initial models we do not allow for harvests above harvest limits (there is no cheating). Four harvest rules are compared: ‘per cent carrying capacity’ (maximum sustained yield), per cent population, open access, and sole owner profit maximizer.
The ‘per cent carrying capacity’ harvest strategy rule sets the harvest limit, HL, at a constant
percentage of the carrying capacityK. The harvest
is then given by:
HS1=min{HMC×HE, HL} (5)
Thus if the potential harvest, HMC×HE, is less
than the harvest limit, then the potential harvest is taken; otherwise, the harvest limit HL is taken.
In the ‘per cent population’ rule, harvest (HL) is simply a specified per cent of the current popu-lation of fish. This rule requires absolutely accu-rate censoring of the stock at the appropriate times to predict sustainable harvest (including ef-fects of ‘lag’ related to seasonality of stock repro-duction and growth, for example). In these simulations, harvesting 28.5% of the existing pop-ulation maximized HMC under this rule.
In the ‘open access’ regime, each actor responds to his/her current revenues minus costs, and keeps harvesting so long as profit is non-negative; entry continues in this regime until total profits are zero. Actors do not behave as if they could pre-dict a trend; they are short-term profit maximizers with no incentives for restraint.
level to produce a false signal. A 5-year trend generates a slower response but tends to find the sustainable profit-maximizing harvest level more reliably. The time horizon for sole owner’s deci-sions is thus longer than for fishers under the open access rule.
4. Rules and sustainability in a single-unit model
For convenience in the STELLA runs that
follow, K is set to 1000; the initial value of
natural capital is set to 10. We allow the system to run to a maximum of 200 periods (e.g. years), and unless otherwise specified, do 100 runs (equivalent to gathering empirical data on 100 fisheries for 200 years each). For such sys-tems, we explore how:
1. Harvest limits influence the stock levels of natural and human-made capital. When the system is not sustained (where ‘sustained’ is defined as having natural capital in excess of 20 units at the end of a 200-year run), we track the number of years until collapse of the system.
2. The growth rate of natural capital influences the sustainability of different harvest limits. 3. (1) and (2) interact, and finally,
4. Stochastic fluctuations in extrinsic ecological influences affect the resource stock (and thus sustainability). In all runs, fluctuations are randomly generated, so we explore the effects of range of variation, rather than temporal predictability.
In the first three analyses, we focus on determinis-tic relationships to explore the underlying curvi-linear structure affecting long-term survival of the natural capital. We then model stochastic envi-ronmental fluctuations that affect growth of
natu-ral capital, mimicking the complexities of
empirical data.
harvested during a defined time period. One type of harvesting rule assigns an upper limit on the quantity harvested based on a judgment made of
the carrying capacityKof the ecosystem. We can
see in Eq. (3) that if one assumes a constant harvest rate, the maximum sustainable yield (MSY) is the maximum reasonable harvest (as we note below, in actual practice, MSY is
problem-atic). One computes easily that xmsy=0.2401K
under our initial conditions of growth rate r=l,
death rate=0.2, and no external pertubations
(E=1). For a series of growth rates (0.9 – 1.1), we varied the authorized harvesting rate from 15 to
30% of K. One can see in Eq. (3) that the
maxi-mum sustained yield is an increasing function of growth rater: (xmsy/(r=E×K/4(1−(D/Er)2)\
0. That is, rapidly growing stocks can sustain heavier exploitation. In all systems, exceeding MSY caused the collapse of a system; the greater the excess, the more rapid was the collapse of the system.
4.2. Growth and har6est rates with ecological perturbations
The intrinsic growth rate of an exploited stock can have a great impact on the sustainability and effectiveness of management strategies. Extrinsic fluctuations (mimicked here by stochastic shifts
affecting stock levels by 910%) also affect
sus-tainability. In a series of runs tracking natural capital and human made capital in a single-unit system with stochastic perturbation, the strongest predictor of the amount of natural capital at the end of a run (200 years, or whenever natural
capital was exhausted) was harvest limits (d.f.=
2.98,r2
=0.63,PB0.00001), although the growth
rate of natural capital was also highly significant
(PB0.000l). When human-made capital was the
dependent variable (d.f.=2.98,r2=0.27), harvest
limits were again most significant (PB0.00001);
signifi-mates to set harvest limits ignores information. Fig. 3 reflects an additional management problem. Up to the sustainable harvest limit, human capital increases in a linear fashion as the harvest limit is increased; the decline in natural capital (biomass of the resource) is less dramatic. Up to the point of collapse, there is a relatively great increase in human capital for a relatively small decrease in natural capital. This concern is further heightened by the fact that most resource users are able to measure the change in human capital (the accu-mulation of assets such as buildings, boats, har-vesting equipment) more reliably than the change in natural capital.
When sustainable limits are exceeded even slightly, the collapse of both forms of capital is relatively dramatic. Thus, in this model, there is little ‘early warning’ that sustainable limits are being approached (Gulland, 1977). Nor is there any feedback that allows regulators to react to changes in stock size or growth. The pattern we uncover here may be related to the empirical observation that many resource-use systems fail relatively abruptly.
Unless we have chosen wildly inappropriate numbers, these results, combined with the infor-mation in Fig. 3, suggest precisely the sorts of difficulties actually encountered in the field. That is, high harvest limits, even when no cheaters exist, can build human capital at the expense of natural capital. Further, the level of human capi-tal gives little prior warning of impending system collapse. In fact, since all human capital is plowed back into harvesting capacity in this set of runs, the growth of human capital accelerates the rate at which the system approaches collapse. If other opportunities existed for the use of human capital or if the investment in harvesting capacity were
D, if no extrinsic fluctuations exist and the regen-eration rate is held constant at 1, a harvest rate of 24% of carrying capacity generates the maximum sustained yield. This rule is not responsive to ecological fluctuations: stochastic extrinsic factors influence resource stock levels, and the probability of an ecosystem remaining active to year 200 is reduced in the face of environmental fluctuations (Fig. 4). When the rule was ‘24% of carrying capacity’ and stochastic fluctuations occurred at
910%, approximately 15% of systems retained
some natural capital by year 200; most survived
up to 100 years (Fig. 4a). At 910% stochastic
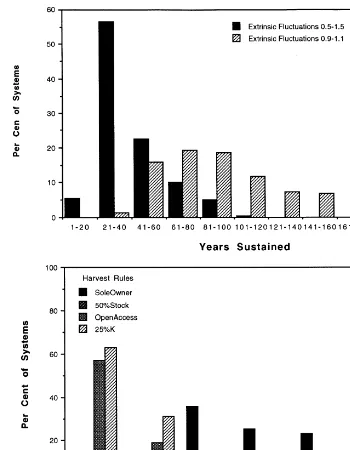
fluctuations in stock, systems using more conser-vative rules uniformly persisted to 200 years. Wealth accumulation under stochastic fluctua-tions differed with harvest rule (maximum about $500,000 per actor for sole owner and per cent stock rules; about $22,000 for open access).
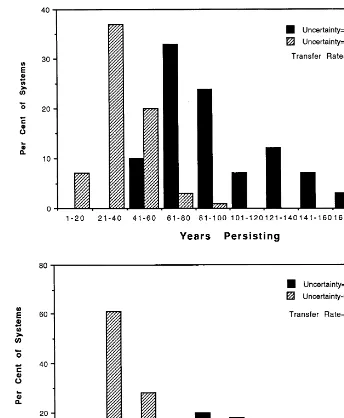
When extrinsic fluctuations were more severe, harvest rules were still differentially sensitive (Fig. 4b). With extrinsic fluctuations causing stock to
fluctuate 950%, 57% of ‘24% carrying capacity’
These results appear to be reasonably consistent with the expected behavior of a single exploited population. However, the ‘reasonable’ behavior explicitly assumes no significant interactions with other populations.
But populations are rarely isolated in this way. We now explore a series of coastal fisheries, in which the fish can move (‘transfer’) from one system to another along the coast (Fig. 5). Allow-ing harvesters to move across the limits of a system generates a similar transfer (Wilson et al., 1999). Maine lobster fisheries represent such com-plex conditions, and both political and biological difficulties arise from this fact. Although only older, mature (marketable) lobsters migrate, mi-gration can create significant biological transfers
when mature lobsters move across human
boundaries, as from inshore waters where one set of local rules obtains, to offshore waters where different rules exist. Inshore Maine fishermen may only retain lobsters above a minimum, and below a maximum, size. They are required to return to the sea lobsters outside this range. The (local) conservation idea behind the rule is to maintain a
size/age distribution in the wild population, to
minimize the risk of recruitment failure. However, because animals at and above the maximum per-missible size tend to migrate outside the area where the rule applies, boats from other areas (New Hampshire and Massachusetts) line up each fall at the Maine boundary to catch the migrating lobsters (Carl Wilson, personal communication).
This creates a variety of problems. It does not
simply mean a more compressed size/age
distribu-tion in all areas (and thus greater risk of recruit-ment failure), but Maine fishermen see outside lobstermen as free riders and question the collec-tive wisdom of their restraint — why should we restrain ourselves, for others to reap the benefits? At a larger scale, eliminating restraint for Maine fishermen would simply mean higher takes in all
that is, human rules and ecological realities do not
appear to match.1
5.1. Spatial representation of multiple ecosystems
Here we explore how, and at what levels, bio-logical transfers between non-isolated systems af-fect situations such as the Maine lobster fishery; we reserve exploration of the governance rules for a later paper. Each of the spatially identifiable systems in Fig. 5 has three compartments: ecosys-tem, human sysecosys-tem, and interactions (Sanchiro and Wilen, 1999, who have developed a remark-ably parallel system independently). To represent three spatial areas, all equations for a unit model are appended with a suffix to indicate the appro-priate unit. In the ecosystem portion of each spatial unit, initial values of variables such as natural capital, natural capital growth rate, and carrying capacity can be set independently, mim-icking spatial ecological variation. Local ecologi-cal areas, then, can differ from one another in terms of the stock-carrying capacity and the inci-dence of ecological fluctuations. In the human systems of each model unit, decision rules (e.g. harvest limits, effort) can also vary.
The natural transfer of natural capital between
units (T) is here assumed to be proportional to
the biomass differential in the two units. If the natural transfer rate is 0, the three spatial units are ecologically isolated from each other, as in the single-unit analyses above. A transfer rate of 50% between adjacent units will equalize the stock population in the two units. The higher the natu-ral transfer rate, the more biological transfer ex-ists between adjacent units.
2. When a moderate (here910%) level of extrin-sic fluctuations exists, how are these parame-ters shifted?
When no external ecological fluctuations exist, the amount that can be sustainably taken in any unit depends on the carrying capacity, the natural capital growth rate, and the transfer rate. If the transfer rate equalized all differences, then the sustainable total harvest pressure for a three-unit set of ecosystems, with the settings we have ex-plored here, would be 24% of the initial carrying
capacity for all three units (here, 24×3000). In
such a case, the three systems would be totally interdependent with regard to harvest limits. Most systems, while not completely isolated, do not have full movement of stocks throughout all sub-systems. When this incomplete flow of stocks occurs, what any unit can take sustainably is a complex function of its own harvest, the harvests of other units, and the transfer rate.
What happens when the central unit of the three-unit system receives flows from the first and third units, and adopts a harvesting rate above 24% of the initial carrying capacity of the linked systems? In other words, what happens when the two outer units are conservative (take less than the amount determined to be locally sustainable) in their harvesting practices, while fishers in the central unit exploit their conservative strategies by harvesting at a rate that would not be indepen-dently sustainable? When the transfer rate is very low (e.g. 1%), any single unit will be unsustainable if its harvest rules exceed 24% by even a small percentage.
When transfer rates are higher and the harvest rules in neighboring ‘conserving’ units are low, a highly exploitative harvesting unit, one that har-vests more than would be sustainable, receives
exploiter and the conservators. To reflect this complexity, we constructed a ‘harvest pressure bias’ index:
HPB=([exploiter rate−MSYe]
−[MSYc-conserver rate]) (6)
to represent the range of conservator-versus-ex-ploiter harvest limits that will leave the entire system’s natural capital sustainable. In our runs,
this measure ranged from −20 to +15,
depend-ing on the natural capital transfer rate. The effects of any level of harvest pressure bias differ, de-pending on the transfer rate of natural capital. For natural capital transfer rates as low as 5%,
when the harvest pressure bias was low (−5 for
5% transfer rate; 5 for transfers rates ]1), even
quite high harvest rates could be sustained in a single unit — if the other units were sufficiently conservative. When the limits are exceeded, the time an exploiting unit can be sustained declines precipitously (Fig. 6).
Although a combination of high transfer rates and conservative neighbors could theoretically shield an exploitative unit, it is likely in most circumstances that people in conserving units will learn of the situation (as in the Maine lobster example above). If ‘conserving’ units respond by raising their harvests, the entire system collapses. Thus, a real problem exists in matching local and supra-local rules to the ecological realities of transfer rates, as well as to more obvious phenom-ena such as carrying capacity and intrinsic growth rate (not varied in this set of runs).
influence population numbers from 90 to 110%.) An ‘exploiter’ in such systems with no extrinsic fluctuations would persist 150 years. 2. Transfer rate, 0. 1; range of stochastic
fluctua-tions, 0.5 – 1.5. An exploiter in such systems with no extrinsic fluctuations would persist 150 years.
3. Transfer rate, 0.2, range of stochastic fluctua-tions, 0.9 – 1.1 An exploiter in such systems with no extrinsic fluctuations would persist 200 years.
4. Transfer rate, 0.2; range of stochastic fluctua-tions, 0.5 – 1.5. An exploiter in such systems with no extrinsic fluctuations would persist 200 years.
Fig. 7 shows that the presence of any
fluctua-tions reduces the probable persistence of the ex-ploiter — even when protected by conservative neighbors and a 10% natural capital transfer rate. The greater the range of unpredictable fluctua-tion, the more persistence is lowered (Fig. 7a). When fluctuations are moderate (0.9 – 1.1), a higher transfer rate affords greater protection to an exploiter with conservative neighbors. When transfer rates are higher, the non-linear interac-tion changes the response. With a 20% transfer rate, 28% of exploiters survive more than 180 years (Fig. 7b), versus only 4% (Fig. 7a) when the transfer rate is 0.1. At the low transfer rate, 33% of exploiters fail before year 80. Thus, in the face of moderate extrinsic fluctuations, high transfer rates and conservative neighbors can protect ex-ploiters. In contrast, when both extrinsic fluctua-tions and transfer rates are high (Fig. 7b), the exploiter is likely to cause the entire system to crash relatively earlier; this is reflected in Fig. 7b by the fact that more than 60% of exploiters fail by year 40 under these conditions. Short-term gains by exploiters from exceeding ‘baseline’ sus-tainable harvest rates are reduced by external fluctuations as well as by (above) any response managers in nearby units might make.
The growth rate of natural capital interacts strongly with the harvest limits to affect the sus-tainability of systems. These variables are difficult to measure and frequently are only loosely incor-porated in current efforts to manage resources sustainably. Further, some variables that are rarelymeasured and analyzed by natural resource managers have a major impact on the sustainabil-ity of ecosystems. Many models of sustainable yield are based on averages over a long time period, and information about the quantity of a stock removed is recorded. The degree of exoge-nous variation — here a strong influence on long-term sustainability — is rarely measured or taken into account in textbooks, yet its effect argues that variance, not simply the long-term mean, in resources should be considered.
The sustainable management of complex eco-logical economic systems can be a tricky thing indeed, especially when incentives to maximize short-term economic gain are strong, as is typical. Even the relatively simple models we show here
demonstrate complex behaviors and subtle
thresholds that are difficult to foresee. The real world is much less tractable; perhaps it is not surprising that many resource systems, even rela-tively isolated ones, have collapsed in recent years.
tems are not simply small-scale systems writ large, nor are small ecosystems mere microcosms of large-scale systems. Thus, we suggest that man-agement systems that produce perfectly acceptable outcomes in ecosystems at one level can produce disruptive or destructive results when applied to higher-level or lower-level systems. The impor-tance of scale depends greatly upon the structure of both human systems and ecosystems, and the geographical range over which ecological interac-tions occur in that system. No wonder sustainable management of ocean fisheries is problematic!
When the scale of ecological interactions and human rules for their governance are appropri-ately matched, we suggest that governance sys-tems can be responsive and appropriate; whether a local or larger-scale rule is appropriate depends on the scale at which the relevant interactions take place. For example, if small coastal villages, spatially isolated from each other, take fish from independent populations of fish, to what extent are higher-level rules helpful in creating sustain-able use? In contrast, if, as in the lobster fisheries (above), certain age classes of lobster move across political boundaries, other problems arise. In fu-ture work we need to explore further what that means.
If one management goal is sustainability, then managers might consider some notion of invoking ‘safe minimum standards’ (Bishop, 1993) or the ‘precautionary principle’ (Low and Berlin, 1984; Costanza and Cornwell, 1992; Costanza et al., 1998) to ensure that harvest limits and other environmental thresholds are not exceeded. These are difficult to impose or get agreement on in most systems, because ‘safe’ levels may be difficult to determine, particularly when significant exoge-nous fluctuations exist. They are particularly
Acknowledgements
This is a report of the Social and Ecological System Linkages Project of the Property Rights and the Performance of Natural Resource Sys-tems Workshop, The Beijer International Institute of Ecological Economics, The Royal Swedish
Academy of Sciences B29 – 30 August 1994, and
28 May – 3 June 1995, Stockholm, Sweden). We appreciate the support provided our project by the Beijer Institute and by the Workshop in Polit-ical Theory and Policy Analysis at Indiana University.
References
Bishop, R.C., 1993. Economic efficiency, sustainability, and biodiversity. Ambio 22, 69 – 73.
Clark, C., 1990. Mathematical Bioeconomics: The Optimal Management of Renewable Resources. Wiley Interscience, New York.
Cleveland, C.J., Costanza, R., Eggertsson, T., Fortmann, L., Low, B., McKean, M., Ostrom, E., Wilson, J., Young, O., 1996. A framework for modeling the linkages between ecosystems and human systems. Beijer Discussion Paper Series no. 76. The Beijer International Institute of Ecologi-cal Economics, Stockholm, Sweden.
Conrad, J.M., Clark, C.W., 1987. Natural Resource Econom-ics: Notes and Problems. Cambridge University Press, Cambridge.
Costanza, R., Cornwell, L., 1992. The 4P approach to dealing with scientific uncertainty. Environment 34, 12 – 42. Costanza, R., et al., 1998. Principles for sustainable
gover-nance of the oceans. Science 281 (5374), 189 – 199. Gulland, J.A., 1977. The analysis of data and development of
models. In: Gulland, J.A. (Ed.), Fish Population Dynam-ics. New York, Wiley, pp. 67 – 95.
Hannon, B., Ruth, M., 1994. Dynamic Modeling. Springer, New York.
Ludwig, D., Hilborn, R., Walters, C., 1993. Uncertainty, resource exploitation, and conservation: lessons from his-tory. Science 260, 17 – 36.
Wilson, J., Low, B., Costanza, R., Ostrom, E., 1999. Scale misperceptions and the spatial dynamics of a social-ecolog-ical system, Ecologsocial-ecolog-ical Economics, in press.

![Fig. 6. Transfer rates of natural capital and harvesting rates of all units interact. Here, combined harvest rates are reflected by the‘harvest pressure bias’ ([exploiter rate−MSYe]−[MSYc−conserver rate])](https://thumb-ap.123doks.com/thumbv2/123dok/3136241.1382124/6.612.75.465.41.303/transfer-harvesting-interact-combined-reected-pressure-exploiter-conserver.webp)