Changes in agriculture and land use in Europe
R. Rabbinge
a,*, C.A. van Diepen
baGroup Plant Production Systems,Laboratory for Theoretical Production Ecology,Wageningen Uni6ersity,P.O. Box 430,
6700 AK,Wageningen, The Netherlands
bAlterra,Wageningen Uni
6ersity and Research Centre,P.O. Box125,6700 AA,Wageningen, The Netherlands
Received 19 February 1999; received in revised form 1 September 1999; accepted 14 March 2000
Abstract
Changes in land use and agriculture have occurred frequently during the last millennium in Europe. Now at the start of the millennium a review of how and why changes took place may lead to a better understanding of these developments. This insight based on scientific analysis and understanding may be combined with explorative studies to gain a view on future possibilities. Such an explorative study for Europe is described. It demonstrates that contraction of agricultural area in the coming decades is inevitable and in line with an historic development where periods of expansion and contraction of agricultural area were intermingled. The new millennium will start with a period of changes in land use to fulfill societal goals in an optimum way. The research agenda that helps to define optimal land use and agricultural methods is based on this analysis and helps to develop the policy agenda for the near future. © 2000 Elsevier Science B.V. All rights reserved.
Keywords:Scenario’s; Attainable and potential yield; Water limitation
www.elsevier.com/locate/eja
1. Introduction
Changes in land use and agriculture have oc-curred frequently during the last millennium in Europe. Now at the start of the new millennium it may be useful to consider in retrospect how and why changes took place. The rise in productivity per unit of area (ha) and per man hour has increased dramatically during the last century and will continue to do so during the first period of
the next century, at least in the majority of the agricultural areas of Europe. In other parts of the world such as Asia, these increases are dearly needed (Evans, 1998). The broadening of aims of agriculture and land use will in the first place be related to the quality of agricultural produce and agricultural production methods. Those functions of agriculture will be supported by government stimulus and directly through added value at the market.
Another function of agriculture related to its contribution to nature conservation, biodiversity and the European landscape is a public good which is scarcely valued at this moment at the market place, and that may require another ap-* Corresponding author. Tel.:+31-317-482141; fax:+
31-317-484892.
E-mail address:[email protected] (R. Rab-binge).
proach. Such goals and means are not discussed in this paper. It is limited to agriculture and land use related to agro-ecosystems.
The possibilities and limitations of agriculture and land use in Europe will be investigated with a simulation study that uses the bioclimatic data, soil characteristics and crop physiological, pheno-logical, optical and geometrical characteristics as input. The outcomes of the explorative study are confronted with the broadened aims of agriculture and its place in the society, when additional inves-tigations are done.
2. Land use change from 1000 – 2000, expansion and contraction of agricultural area
Expansion of agricultural area was for ages the only way to supply sufficient food for the increas-ing European population. At the beginnincreas-ing of the Middle Ages more than 80% of the population was working in agriculture using the land in the best possible way given the limited external re-sources that were available to increase productiv-ity and the absence of labour replacing machinery (Slicher van Bath, 1964).
Some two hundred farm families were needed to supply the 20 monks in a monastery in the neighborhood of Anvers (Belgium). Around 1400 Europe was confronted with the devastating ef-fects of the pandemic Black Death. Some 30% of the European population died and it was for that reason that the cultivated area contracted (Fig. 1). After a short period of contraction a new period of expansion continued until the end of the 17th Century when a new period of contraction of cultivated area started as a result of the increase of productivity per ha due to better agricultural
methods (Rabbinge and van Latesteijn, 1992). The use of new rotation systems and manure was widely applied and better grain varieties intro-duced. International trade also affected the need for cultivated area. After some 100 years of con-traction and stagnation, agricultural area ex-panded again as the European population increased more than productivity per ha.
That continued until the midst of the 20th Century. Then productivity rise per ha discontin-ued: the first green revolution where productivity rise per ha of 4 – 15 kg grain equivalents per ha per year increased up to a level of 80 – 150 kg grain equivalents per ha per year. The reason of this sudden increase of productivity was due to a combination of factors. New varieties with a high harvest index, better use of fertilizers that elimi-nated yield limitation due to plant nutrition, ap-propriate water management and (supplementary) irrigation and finally appropriate crop protection with sophisticated weed, pest and disease control led to a synergism that resulted in the increase of land productivity. Productivity rise per man hour was even more dramatic as labour replacing ma-chinery was widely applied.
That rise in productivity per hectare will lead to a surplus of cultivated land that is increasing considerably for the coming decades. The rise in productivity will continue for some time at the majority of agricultural land in Europe, since the gap between potential and actual productivity is still considerable, as will be shown in this paper. The major reason for the continued increase is the bonus at higher yields at well endowed lands as the productivity of labour, water, nutrients or biological and other weed, pest and disease con-trol measures increases at higher yield levels. In a detailed analysis de Wit (1992) illustrated how input efficiency and productivity per unit of labour or per unit of water is in general increasing when these factors are improved simultaneously. The synergistic effects of the various inputs will lead to a higher productivity for each individual input, provided the use of good soils. In an exten-sion of these analysis van Ittersum and Rabbinge (1997), elaborated and demonstrated the reasons and general applicability of these findings. Fig. 1. Expansion and contraction of cultivated area in
The optimum of each of the inputs may be different at various ecoregions and depend on societal aims but it is definitely at higher yield levels than the actual yields, which are attained at various places.
3. Development of agriculture and land use during the last 5 decades
During the last 5 decades changes in agriculture and its position in society were more dramatic than in several ages before. They can be charac-terised as follows:
Productivity rise per ha, per man-hour and per unit input.
From empirical and skill driven activity to a more science and understanding based activity with industrial characteristics.
Decoupling of productivity per crop, plant and animal on one hand and land use at the other. Recoupling land related agriculture and other societal aims (landscape, environment, nature conservation and development and biodiver-sity, social).
Generic extensification (cropping system level) and specific intensification (per crop) to reach biotechnical and environmental aims.
To elaborate on these typical characteristics the following remarks are made:
The productivity rise per ha, per man-hour, and per input was described at many places as a typical phenomenon of agriculture during the last few decades. They resulted from innovations from various disciplines. The mutual interaction be-tween these innovations created synergism that led to the enormous increase in productivity.
Each of the innovations gave a better, total result as compared with an addition of effects. Such a green revolution may be repeated in the near future as knowledge and insight from vari-ous disciplines may stimulate each other (Evans, 1998).
Green revolution occurred in the industrialised world in the early fifties and sixties and were repeated some decades later in the developing world where its impact for food production and food security are impressive (Conway, 1997).
Agriculture as an empirical science, where pro-gress is made through trial and error, is more and more strengthened by scientific insight in the basic physical, chemical, physiological and ecological processes that together determine growth and pro-duction. That insight combined with a detailed understanding of the genetic basis of various characteristics and the possibilities to effect them have created a new science based agriculture. The ecology revolution and biotechnology may help to reach ways of agriculture that are productive and environmentally friendly.
Since the fifties production with agro-ecosys-tems has been disconnected from land use for particular products. Production of flowers and vegetables in greenhouses, of mushrooms in closed containers, intensive cattle breeding, they are all typical examples of ways of producing that are similar to industrial processes. These ways of horticulture and agriculture are used for the high valued products and not for the bulk food pro-duction such as wheat, rice, maize, potato and soybeans. Energy use in such systems is still high, but may be considerable lower when all potential innovations are introduced.
In land related agriculture the variation in pro-duction techniques within Europe is extreme. Land productivity varies with a factor 6 and labour productivity with a factor 100. Neverthe-less, the development is such that the variation is decreasing, as the tendency to reach optimal way of producing becomes more and more the objec-tive of all farming systems. With a decreasing number of people directly related with agriculture, there is an unexpected increasing interest in the quality of products and the way they are pro-duced. Moreover, there is a growing valuation of landscape and 25 nature as a public good. Agri-culture plays an important role to fulfill that demand.
discus-sion on product quality and production process shows a lot of ideology and a considerable interest in agricultural techniques that are dominated by a particular view on life and man, such as in or-ganic farming. The ban on artificial fertilisers and synthetic biocides is justified on basis of a philoso-phy that originates from a time before the enlight-enment in agriculture started.
In spite of what was just stated, in the near future such discussions on agricultural methods and their consequences for the environment, as well as various accepted values, will continue.
Finally there is a growing awareness that too narrow crop rotation and in generic terms too intensive cropping and farming systems are sub-optimal in biotechnical and in environmental terms. In fact, a crop should be grown at nearly maximum production levels (potential levels), es-pecially on the better soils, to realise the highest productivity and efficiency for each of the individ-ual production factors. In general, it is therefore necessary to extensify too intensive generic sys-tems and, counter intuitively, to intensify individ-ual crops when grown to reach optimality in biotechnical and environmental terms. That movement is present at various places and most clearly in those areas of Europe where too inten-sive systems in generic terms were developed dur-ing the last few decades.
4. Biophysical possibilities of European agriculture: an explorative investigation
The rise in productivity of various crops under different conditions may be illustrated in various ways. In a detailed study for the European Union (Rabbinge et al., 1994) it is shown very clearly that the majority of agricultural area is still sub-optimally used. That will be illustrated with a simulation study on potential attainable and ac-tual yield of wheat in Europe.
4.1. Production potential for winter wheat in Europe
The biophysical production potential and its regional distribution can be estimated using data
generated by the MARS project (monitoring agri-culture with remote sensing). The MARS project was carried out by the Joint Research Center (JRC) of the European Commission to modernise the collection of regional agricultural statistics by combining GIS, remote sensing and crop mod-elling techniques. The MARS system includes the crop growth monitoring system (CGMS) (Vossen and Rijks, 1995; van Diepen et al., 1998) which makes year-specific estimates of the regional crop yields on the basis of the agrometeorological crop model WOFOST (Supit et al., 1994).
The MARS database covers Europe west of the Ural, and in addition Turkey and the Maghreb down to a latitude of 33°N. The CGMS informa-tion products include simulated potential and wa-ter-limited yields for eleven field crops and grass. The long-term average simulated water-limited yield of winter wheat can serve as indicator for regional production potential.
The geographical land unit to which the WOFOST model is applied is a unique combina-tion of soil, crop and climate. The grid cell (50×
50 km) dictates the climate unit that is used in the study. That may lead to errors but they seem to be acceptable. All suitable soils within a cell are clustered in groups of similar physical profile. The model is applied to each group with a crop variety that matches the regional crop calendar. The crop data have been derived from field experiments in Western Europe up to 1985.
meteo data were available for some 600 stations for periods of 15 – 30 years and have been ob-tained partly from the various national meteoro-logical services, and partly from US National Climatic Data Center (NOAA-NCDC). The daily station weather data have been transformed to a uniform format and interpolated from the stations to the grid. The soil data have been derived from the soil map of Europe at scale 1:1 million for West and Central Europe (Le Bas, 1996; Monta-narella, 1998), and from the FAO/Unesco, soil map of the world at scale 1:5 million for Northern and Eastern Europe (FAO, 1981), Turkey and the Maghreb. The coarser scale of the latter map suggests much less variation in soils than in Cen-tral and Western Europe. The soil data have been used as input to the crop model, and for the evaluation of the land resources for their suitabil-ity for cereal cropping.
The maximum crop production per grid can be roughly estimated by multiplying the average sim-ulated water-limited yield with suitable area. The mean simulated winter wheat yields and suitable areas were compared with FAO data on national agricultural statistics for 1995 (FAO, 1996) on yield, arable area and production volume of cere-als and wheat. A logical reference would be the average of the national yields over a number of recent years. This proved quite complicated be-cause of changes in political boundaries in East-ern Europe. In addition, the accuracy of the national figures is a problem. For the EU coun-tries the errors in the national figures are esti-mated at 95% for Northern Europe and higher for Mediterranean countries (Vossen and Rijks, 1995). Also, it is not yet known how the long term technology trend in national yields has been influ-enced by changes in the Common Agricultural Policy and politico economic developments in Central and Eastern Europe over the last decade. For the countries of EU12, Russell and Wilson (1994) did not observe a trend in national wheat yield over the period 1985 – 91 and they found that the inter-annual fluctuations in yield (coeffi-cient of variation) were close to 6% for most countries. When it exceeded 10% it could be re-lated to a year with an exceptional low yield, so it is only in years with extreme weather conditions
that large yield fluctuations occur. In 1995 the weather over the whole of Europe was rather favourable except for Spain and Portugal, which experienced a severe water shortage period in late spring. Also in Southeastern Russia there was a relatively strong summer drought in 1995 (MARS, 1995). In these countries the reported 1995 yield may be somewhat below average. The range in statistical yields over countries is larger than the within-country range in yields over the years. The differences in statistical yield level be-tween countries show a fairly consistent pattern over the years, except for extreme years. There-fore we may use the statistical yield data for the single not-extreme year 1995 as an approximation for the geographical pattern of average national yields. The figures are indicative only. The present study deals with Europe only, excluding Turkey and Maghreb. It demonstrates clear differences in regional cereal yield potentials, taking into ac-count that these data are used as an explorative first step in a further analysis on the options for agriculture and land use in Europe.
4.2. Land resources and regional distribution of suitable soil areas
The assessment of soil suitability for mecha-nised cereal cropping consisted of assigning a label ‘suited’ or ‘unsuited’ to each soil map unit on the basis of given or derived properties: un-suited may be due to steep slope, shallow soil depth, salinity, alkalinity, stoniness. The climatic suitability was not evaluated a priori, but will be discussed on the basis of the simulation results.
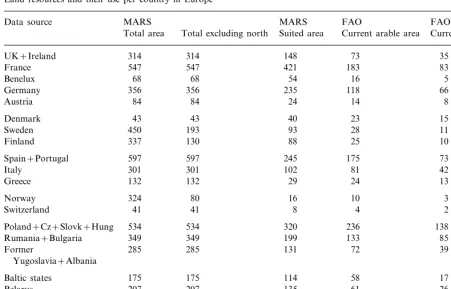
Table 1
Land resources and their use per country in Europea
MARS
Data source MARS FAO FAO
Total excluding north Suited area Current arable area Current cereal area Total area
314 148
UK+Ireland 314 73 35
547 421
France 547 183 83
68 54
68 16
Benelux 5
356 235 118 66
Germany 356
84 24 14
84 8
Austria
43 40
Denmark 43 23 15
193 93
450 28
Sweden 11
130 88 25
Finland 337 10
597 245
Spain+Portugal 597 175 73
301 102
Italy 301 81 42
132 29 24
132 13
Greece
80 16 10 3
Norway 324
41 8 4
41 2
Switzerland
534 320
Poland+Cz+Slovk+Hung 534 236 138
349 199
349 133
Rumania+Bulgaria 85
285 285 131
Former 72 39
Yugoslavia+Albania
175
Baltic states 175 114 58 17
207
Belarus 207 135 61 26
603 392
603 333
Ukraine 129
2885 1875
European part Russia 4215 751 299
7924 4669
All Europe 9962 2418 1099
aTotal area extents (1000 km2) of land surface, of land suited for the cultivation of cereals, of land currently (1995) used as arable
land, and of cereal land for the various (groups of) countries in Europe. MARS: MARS-CGMS data base (Vossen and Rijks, 1995). FAO: FAO, 1996. Production yearbook 1995. Climatically unsuited area in northern Europe is excluded.
largely unsuited because of alkaline soils. To the north, the suitability of the land for cereal grow-ing is determined largely by the temperature regime. The second largest patch of suitable soils is the western half of France, third comes the succession of plains along the Danube River in Central Europe. The lowest concentration of suit-able soils, with less than 50% suitsuit-able soils, is shown for Norway, Sweden, the United Kingdom and Ireland, and large parts of the Mediterranean countries, such as Italy, Greece, and the former Yugoslavia.
Statistics on land use resources and their use and use potential are given by country in Tables 1 – 4. The countries are grouped by political and climatic blocks for which subtotals are given in Tables 5 – 10. The political blocks are the
Eu-ropean Union, two non-EU countries Switzerland and Norway, Central Europe and the countries in the European part of the former USSR. The data on the Russian Federation refer to its European area only. The 15 EU-countries are grouped by climatic zone. EU-South includes Portugal, Spain, Italy and Greece. EU-North is Denmark, Sweden and Finland, and the other eight countries are labelled as EU Middle. The northern territories have been excluded from the land suitability as-sessment, because in these regions the climate is not suitable for cropping, and this overrules soil suitability. The dividing line runs roughly east west and attains 61° latitude North in Finland.
aggregate figures for climatic zones within EU15 are in Tables 5 and 6, and for political groups of countries are in Tables 8 and 9. The area used as arable land in the European Union is about half the area classified as suitable. When the possibil-ity of classification and mapping errors is ig-nored, the other half must be occupied by other land use including forest, permanent crops, pas-ture and grazing land, and build up area. A lower proportion of arable land indicates a pref-erence for other land use than arable farming, e.g. grassland in the Netherlands and forest in Sweden. A higher proportion arable land may
indicate the occurrence of few other kinds of land use, or a high pressure on the land, where arable farming is practised on unsuited soils. In Italy and Greece the area extent of arable land is about 80% of the suitable land, in Central Eu-rope about 70%. In Eastern EuEu-rope, the use in-tensity of suitable land is highest in the Ukraine, about 85%.
About half of the arable area is used for cereal cropping. The other half is under root crops, oil seeds, pulses and green fodder crops. The per-centage of arable land under cereals is highest in Central Europe, about 60%.
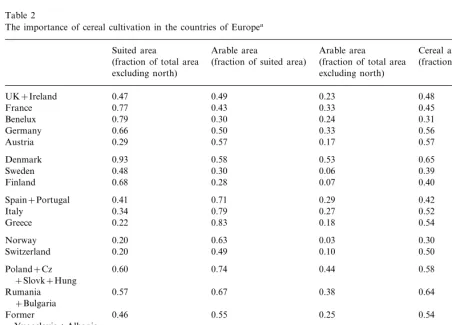
Table 2
The importance of cereal cultivation in the countries of Europea
Cereal area Arable area
Arable area Suited area
(fraction of suited area)
(fraction of total area (fraction of total area (fraction of arable area)
excluding north) excluding north)
UK+Ireland 0.47 0.49 0.23 0.48
0.33 0.45
France 0.77 0.43
Benelux 0.79 0.30 0.24 0.31
0.66
Germany 0.50 0.33 0.56
Austria 0.29 0.57 0.17 0.57
Denmark 0.93 0.58 0.53 0.65
0.48 0.30
Sweden 0.06 0.39
Finland 0.68 0.28 0.07 0.40
0.42 0.29
0.71 Spain+Portugal 0.41
0.34 0.79
Italy 0.27 0.52
Greece 0.22 0.83 0.18 0.54
0.30
0.20 0.63 0.03
Norway
0.20 0.49 0.10 0.50
Switzerland
0.58 0.60
Poland+Cz 0.74 0.44
+Slovk+Hung
0.64 0.57
Rumania 0.67 0.38
+Bulgaria
0.55 0.46
Former 0.25 0.54
Yugoslavia+Albania
0.65 0.51
Baltic states 0.33 0.29
0.43 0.29
0.45
Belarus 0.65
0.65 0.85
Ukraine 0.55 0.39
0.65 0.40 0.18 0.40
European part Russia
0.45
0.59 0.52 0.24
All Europe
aThe relative availability of suitable land and the relative importance of cereal cropping: cereal area as fraction of arable area,
Table 3
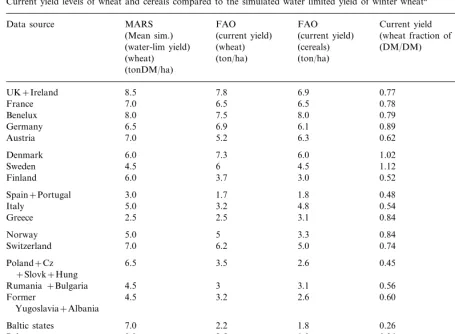
Current yield levels of wheat and cereals compared to the simulated water limited yield of winter wheata
FAO
Data source MARS FAO Current yield
(wheat fraction of wlim yield) (Mean sim.) (current yield) (current yield)
(cereals) (wheat)
(water-lim yield) (DM/DM)
(ton/ha) (ton/ha)
(wheat) (tonDM/ha)
7.8 6.9
UK+Ireland 8.5 0.77
6.5 6.5
7.0 0.78
France
Benelux 8.0 7.5 8.0 0.79
6.9 6.1
6.5 0.89
Germany
5.2 6.3
Austria 7.0 0.62
7.3
Denmark 6.0 6.0 1.02
6 4.5
Sweden 4.5 1.12
3.7 3.0
6.0 0.52
Finland
1.7
Spain+Portugal 3.0 1.8 0.48
3.2 4.8
5.0 0.54
Italy
2.5
Greece 2.5 3.1 0.84
5
Norway 5.0 3.3 0.84
6.2 5.0
Switzerland 7.0 0.74
6.5 3.5
Poland+Cz 2.6 0.45
+Slovk+Hung
3
Rumania+Bulgaria 4.5 3.1 0.56
4.5 3.2 2.6 0.60
Former
Yugoslavia+Albania
2.2
Baltic states 7.0 1.8 0.26
2.5 1.9
8.0 0.26
Belarus
6.0
Ukraine 3 2.5 0.42
2 1.5
6.0 0.28
European part Russia
– 3.1 –
All Europe –
aMARS: MARS-CGMS data base (Vossen and Rijks, 1995). FAO: FAO, 1996. Production yearbook 1995. See text in chapter
4 for explanation of fraction of wlim yield above 1.0. (DM, dry matter).
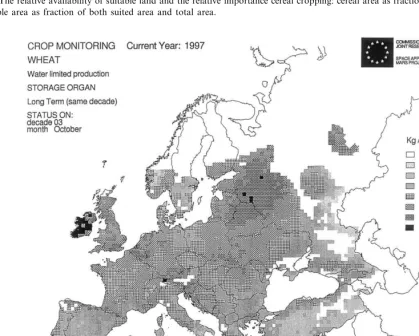
4.3. The water-limited yield le6el and their
regional distribution
The regional distribution of water-limited yields is shown in Fig. 2, and the national mean simulated water-limited yields are given in Table 3. The simulated yield is expressed as ton/ha dry matter grain. If we assume a standard moisture content of 16% in grain, the equivalent of 1 ton dry matter is 100/84=1. 19 ton of the real product.
The highest yields (above 8 tons/ha dry matter
Table 4
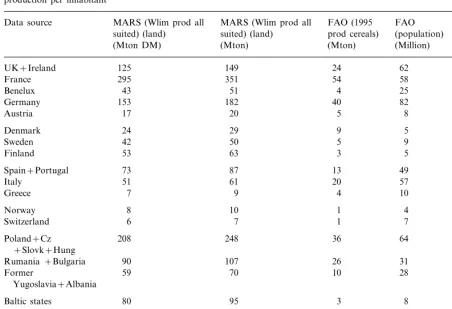
Theoretical maximum production volume (winter wheat on all suited lands) compared to current (1995) production volume, and production per inhabitanta
Data source MARS (Wlim prod all MARS (Wlim prod all FAO (1995 FAO Cereals (population)
suited) (land) prod cereals) (per capita) suited) (land)
(Mton) (Million)
(Mton) (kg/person)
(Mton DM)
24 62
149 387
UK+Ireland 125
351
295 54 58 931
France
51
43 4 25 160
Benelux
40 82
182 488
Germany 153
5
Austria 17 20 8 625
9 5
24 1800
Denmark 29
Sweden 42 50 5 9 556
63
53 3 5 600
Finland
13 49
73 87 265
Spain+Portugal
Italy 51 61 20 57 351
4 10 400
9 7
Greece
1 4
Norway 8 10 250
1 7
7 143
Switzerland 6
248 36 64
208 563
Poland+Cz
+Slovk+Hung
Rumania+Bulgaria 90 107 26 31 839
59
Former 70 10 28 357
Yugoslavia+Albania
3
Baltic states 80 95 8 375
5 10 500
Belarus 108 128
32 52
280 615
Ukraine 235
1339
1125 44 94 468
European part Russia
All Europe 2802 3334 339 668 507
aFor the comparison the simulated dry matter yield is converted to grain yield having a moisture content of 16%. MARS:
MARS-CGMS data base (Vossen and Rijks, 1995). FAO: FAO, 1996. Production yearbook 1995.
North of this area the yield decreases, and at only a few hundred kilometers distance the north-ern limits of cereal cultivation is found. The short
temperature determined growing season is the ma-jor limitation. Yet in Southern Finland a water-limited yield of nearly 6 ton/ha is found.
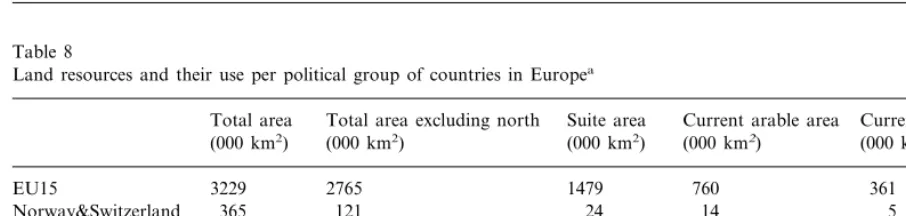
Table 5
Land resources and their use per climatic region of the European Uniona
Current arable area Suite area
Total area excluding north
Total area Current cereal area
(000 sqkm) (000 sqkm) (000 sqkm)
(000 sqkm) (000 sqkm)
882
EU — middle 1369 1369 404 197
830 366 221 76 36
EU — nordic
376
EU — south 1030 1030 280 128
3229 2765 760 361
Total EU15 1479
aCountries are grouped as shown in Tables 1–4. Total area extents (1000 sq km) of land surface, of land suited for the cultivation
Table 6
The importance of cereal cropping per climatic region of the European Uniona
Suited area (fraction of Arable area (fraction of Arable area (fraction of Cereal area (fraction suitable area)
total excluding north) total area excluding north) of arable area)
0.64
EU — middle 0.46 0.30 0.49
0.60
EU — nordic 0.34 0.09 0.47
0.74 0.27
0.37 0.46
EU — south
0.51 0.24 0.48
Total EU15 0.53
aThe relative availability of suitable land and the relative importance of cereal cropping: cereal area as fraction of arable area,
and arable area as fraction of both suited area and total area.
Table 7
Theoretical maximum production volume (winter wheat on all suited lands) compared to current (1995) production volume, and production of cereals per hectare and per inhabitant, per climatic region of the European Union
Wlim prod all Wlim prod all 1995 prod cereals Population Cereals (per Cereals (per ha) capita)
suited (land) suited (land)
(Mton) (Mton) (Million)
(Mton DM) (kg/person) (ton/ha)
753 127
EU — middle 633 235 540 6.4
EU — nordic 119 141 17 19 895 4.7
157 37 116 319 2.9
EU — south 132
1051 181 370 489
884 5.0
Total EU15
Table 8
Land resources and their use per political group of countries in Europea
Total area excluding north Suite area Current arable area
Total area Current cereal area
(000 km2) (000 km2) (000 km2) (000 km2)
(000 km2)
2765 1479
EU15 3229 760 361
121 24
Norway&Switzerland 365 14 5
1168 650
1168 441
Central Europe 262
Former European 5200 3870 2516 1203 471
USSR
7924 4669
All Europe 9962 2418 1099
World 6910
aTotal area extents (1000 sq km) of land surface, of land suited for the cultivation of cereals, of land currently (1995) used as
arable land, and extent of cereal land.
In reality, some of the areas with the highest simulated yields may not be the most favourable for the production of winter wheat, because some production and growth factors have not been included in the model. In the Atlantic top-yield regions (Ireland) such a factor is the high humidity, which is sub-optimum for maturing and harvesting, causing yield losses and grain quality problems. In the high elevation zones
the simulated growing season may be too long, so that the maturing period extends too far in the late summer or autumn. A choice for a short-season, lower yielding variety would be real-istic.
roughly above the line Stockholm-Moscow winter wheat has a great risk of crop failure due to winter frost. Next, the simulated growing season
starts too early because in the model, the crop reacts to air temperature only, ignoring the fact that in spring the soil temperature remains too
Table 9
The importance of cereal cropping per political group of countries in Europea
Cereal area (fraction Suited area (fraction of Arable area (fraction of Arable area (fraction of
total area including north) of arable area) suitable area)
total excluding north)
0.53
EU15 0.51 0.24 0.48
Norway&Switzerla 0.20 0.58 0.04 0.36
nd
Central Europe 0.56 0.68 0.38 0.59
0.39 0.65
Former European 0.48 0.23
USSR
0.45 0.24
0.52 0.59
All Europe
aThe relative availability of suitable land and the relative importance cereal cropping: cereal area as fraction of arable area, and
arable area as fraction of both suited area and total area.
low long after the winter frost. In addition the soil is then too wet because of the frozen under-ground. In the late summer also high humidity may cause problems in these regions, which pleads for early maturing varieties. All these fac-tors indicate that the water-limited wheat yield gives a too optimistic impression for Northeastern Europe. At the country level this applies espe-cially to Finland. The water-limited yield may be estimated 2 or 3 tons/ha too high; the exact yield effects can be quantified by experiments and im-proved models.
Another factor that could contribute to the relatively high simulated yield level in Russia is that the radiation data are derived from tempera-ture data, and not from cloud cover data as in the rest of Europe.
In Eastern Europe going from the high water-limited yield zone to the south, the simulated yield decreases by the shortening of the grain filling period and the effects of summer drought. Near the Black Sea it falls below 50% of the highest yield level. In the Balkan roughly south of 45° latitude (Beograd), the water-limited yield varies between 3 and 5 tons/ha. In the rest of Europe north of Alps and Pyrenees the yield level varies mostly between 4.7 and 8 ton/ha, forming a com-plex pattern related to elevation (rainfall and tem-perature), distance to the sea, latitude, soil depth and soil water holding capacity. Areas with re-markably lower yields down to 3.2 tons/ha are: (1) around Berlin because of rather low rainfall and high proportion of sandy soils; (2) parts of South Sweden, because of shallow sandy soils; and (3) the Mediterranean part of France (Languedoc-Rousillon), because of shallow soils and low summer rainfall.
In Italy there is a north-south gradient in yield from above 6 to below 3 tons/ha. The west coast is more humid than the east coast, the driest parts are the heel of the boot and Southern Sicily. The mild winter on the west facing coasts of Italy and also Portugal advances the growth cycle so that the grain filling takes place before the early spring and summer drought can hit the crop. In fact, water shortage is most severe in May and that may affect the attainable yield considerable. The lowest yield levels are found for the largest part of
Spain, where the yield level varies from 1.6 to 3.2 tons/ha, which is related to a short grain filling duration and severe water shortage. In areas where the occurrence of drought results in low water-limited yield levels it may be possible to obtain higher yields by applying supplementary irrigation or, even without irrigation, from soils with a more favourable water regime than as-sumed in the model, e.g. in river plains and on foot slopes. Where the simulated water-limited yield is very low, e.g. in Spain, the competition for water between plants can be reduced by applying a lower plant density than simulated in the crop model.
4.4. Comparison water-limited yield le6el with
obser6ed 1995 yield
75 – 80% of the water-limited yield. In Northeast-ern Europe (Baltic countries and east and north-east of them) the actual yields are about 25% of the calculated water-limited yields. Even if there is some doubt on the simulated yield level due to model and data deficiencies, there is evidence that the yields could be at least as high as in Finland. This means that the yields can be nearly doubled in these countries by improving land and water management and intensifying crop management. Doubling the yield level seems also possible in the long run for the Ukraine, where the actual yield level is at about 40% of the water-limited poten-tial. The aggregate production figures for climatic zones within EU15 are in Table 7, and for politi-cal groups of countries in Table 10.
4.5. Current and potential production 6olume
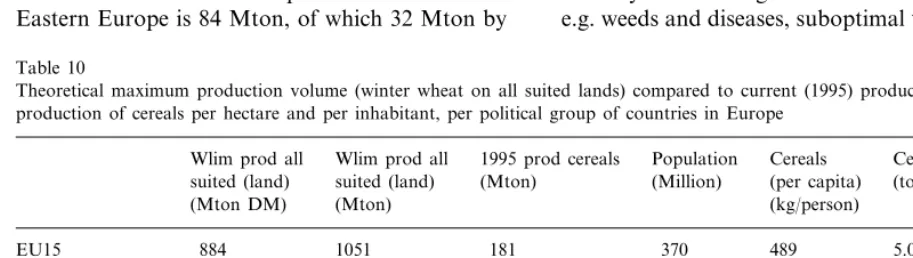
The total yearly cereal production of the EU amounts to 180 Mton, of which 54 Mton are produced by France and 40 Mton by Germany (Table 4). The average amount per capita is about 500 kg cereals, which is largely used to feed animals. The total production volume of Central Europe is about 72 Mton of which 26 Mton by Poland and 20 Mton by Rumania. This corre-sponds with nearly 600 kg per capita, largely sufficient to feed the population and a large num-ber of animals. A 40% yield increase will bring the production volume of Central Europe at 100 Mton. The current cereal production volume in Eastern Europe is 84 Mton, of which 32 Mton by
the Ukraine and 44 Mton by European Russia. The per capita production is about 500 kg.
It is not realistic to assume that the whole area classified as suitable for cereal production will be used for growing cereals. The land use pressure is too varied over the countries and regions to draw general conclusions on possible expansion or con-traction of the cultivated area. Whether intensifi-cation will take place depends on economic conditions, but it is definitely possible to realise higher yields.
The results of the analysis of regional produc-tion potential in Europe shown above suggest that large increases in rainfed crop production are feasible in Central and Eastern Europe, while these countries produce currently largely enough to feed their population, leaving a big surplus for their livestock. Although the analysis was done for winter wheat, this conclusion holds for cereals in general and also for other rainfed field crops or grass, under the assumed condition that soil drainage, nutrient supply and crop protection are adequate.
A constraint for this study was the use of a very heterogeneous database, combining many data from different sources and of varying accuracy. The explored regional yield potential was at the level of water-limited yield, but a number other limitations was not considered such as effects of frost and excess moisture. The effects of nutrient limitations were not considered. In reality, a num-ber of yield reducing factors will also play a role, e.g. weeds and diseases, suboptimal timing of farm
Table 10
Theoretical maximum production volume (winter wheat on all suited lands) compared to current (1995) production volume, and production of cereals per hectare and per inhabitant, per political group of countries in Europe
Cereals
Population Cereals (per ha) Wlim prod all
Wlim prod all 1995 prod cereals suited (land) (Mton)
suited (land) (Million) (per capita) (ton/ha)
(kg/person) (Mton)
(Mton DM)
181 370 489 5.0
EU15 884 1051
4.0 182
11
Norway & 14 16 2
Switzerland
2.7 585
123
Central Europe 357 425 72
164 512
Former European 1548 1842 84 1.8
USSR
507 3.1
All Europe 2802 3334 339 668
1902 5700 334
operations. These factors become important for the planning of measures to improve the efficiency of agricultural production.
More detailed analysis will be needed to assess the specific situation of each country, taking into account soil and climatic resources, the possibili-ties for expansion of the arable area and intensify-ing farming practices, in the context of socio-economic and political developments.
This analysis demonstrates evidently that there is still ample room for expansion of the agricul-tural production. It also shows that considerable innovations in agricultural production techniques and changes in land use are possible and needed. The availability of water and other limiting factors such as nutrients should be guaranteed and the effect of growth and yield reducing factors such as pests, diseases and weeds should be controlled and with biological means as is nowadays already widely demonstrated in practice. Best technical means lead to biotechnical and environmental technical improvements.
5. Multiple goals of agriculture and land use
The analysis above should be seen as a first step in an explorative study on land use in Europe. It is clear that the biophysical possibilities are influ-encing, but certainly not dictating the develop-ment in agriculture and land use. Other aims that are based on societal or ecological preferences define those developments. In an explorative study for the European Union (EU12) before extension these consequences are demonstrated (Rabbinge and van Latesteijn, 1992; Rabbinge et al., 1994).
It was shown that at nearly all places the gap between potential and actual yield is considerable and that sub-optimality in biotechnical and envi-ronmental terms is very general. It is for that reason that the explorative study towards the consequences of land use and environmental side effects at the level of the European Union is so striking and challenging.
The variation in land use in various scenarios is considerable, the area extent needed to reach opti-mal land use in various scenarios varies between 40 and 78×106 ha cultivated land. That is in all
cases much less than the present area of cultivated land 128×106ha. Diflerences in pesticide use are even more impressive. At present some 400×106 kg active ingredients, in the scenarios it varies between 5 and 40×106 kg active ingredients. The reason for these dramatic differences between the present situation and the possible future situation lies with the gap between potential and actual yields and the suboptimal use of land and inputs. A double green revolution (Conway, 1997) i.e. a dramatic increase in yields per ha and similar and probably more substantial increase in productivity of water and nutrients and decrease of pesticide use, is possible but requires appropriate policy choices, use of the proper institutions and instru-ments. In the extended European Union there are even more options and possibilities. The procedure to identify such options could follow the approach of the ‘Ground for choices’ study (Rabbinge et al., 1994). That requires an explicit formulation of goals. Socio-economic, ecological, environmental and agricultural objectives should be made more explicit and used in an interactive way to develop options for agriculture, land use and rural devel-opment for the extended European Union. The experience with earlier explorative studies and the biophysical possibilities described above make al-ready clear that there is ample opportunity for a more productive, environmentally less polluting and ecologically sound agriculture.
These challenging perspectives should be achieved and used rather than seen as a threat.
6. Towards a policy and research agenda for the 21st Century
Explorative studies (Rabbinge et al., 1994) may be useful to investigate possibilities and to investi-gate trade-offs. It needs in addition interaction and iterative approaches to see what are the conse-quences of particular choices and preferences. By a quantitative insight in the trade-offs it is better possible to make balanced and well argumented definite choices and decisions.
Such interactive and iterative studies are specifi-cally needed at the lower aggregation levels such as the regional level. Ecoregional approaches are becoming more and more desirable at these levels, and the methodologies and techniques are becom-ing available to do so.
The particular possibilities and limitations of specific regions become better visible through such explorative studies. It will become clear that at many places agriculture as an important way of land use, has still ample opportunities, under the condition that sufficient modernisation of the tech-nologies and approaches is attained (Rabbinge and van Latesteijn, 1992; Evans, 1998).
These studies require a rejuvenated agronomy as a scientific discipline. It is an integrative explo-rative and explanatory science that builds on the insight and knowledge derived from the basic disciplines such as physics, chemistry, physiology and ecology. That role of agronomy is challenging and will be rewarding. It requires other expertise and attitudes. The possibilities are there, the knowledge and skills are available. Now they should be used.
Acknowledgements
The authors gratefully acknowledge Jean Michel Terres of the JRC-Space Applications Institute, Ispra, MARS Project for providing data on mean long-term simulated yields of winter wheat.
References
Conway, G., 1997. The Doubly Green Revolution: Food For All in the 21st Century. Penguin Books, London. Diepen, C.A. van, Wal, T. van der, Boogaard, H.L., 1998.
Deterministic crop growth modelling fundamentals and application for regional crop state monitoring and yield forecasting. In: Dallemand, J.F., Perdigao V. (Eds.),
PHARE Multi-country Environment Programme. MERA Project. Proceedings 1994 – 1996 Results Conference. Publ. EUR 18050 EN, Series ‘Environment and quality of life’, Office for Official Publications of the EC Luxembourg, pp. 201 – 228.
FAO, 1981. Soil Map of the World L5 000 000 Volume V Europe. FAO-Unesco, Paris.
Evans, L.T., 1998. Feeding the Ten Billion. Cambridge Univer-sity Press, Cambridge.
FAO, 1996. FAO Production Yearbook 1995 vol 49. FAO Statistics Series, Rome.
van Ittersum, M.K., Rabbinge, R., 1997. Concepts in produc-tion ecology for analysis and quantificaproduc-tion of agricultural input-output combinations. Field Crop Res. 52, 197 – 208. Le Bas, C., 1996. Base de donne´es ge´ographique des sols d’Europe, Version 3.1 beta. Rapport EUR 16380 FR, Office des publications officielles de Communautes Eu-ropeennes, Bruxelles, Luxembourg.
MARS, 1995. Synthesis of the agricultural campaign, Novem-ber 1995. MARS Bulletin No. 8, Joint Research Center of the European Community, Institute for Remote Sensing Applications, Ispra.
Montanarella, L., 1998. The European Soil Bureau and its activities. In: Dallemand, J.F., Perdigao V. (Eds.), PHARE Multi-country Environment Programme. MERA Project. Proceedings 1994 – 1996 Results Conference. Publ. EUR 18050 EN, Series ‘Environment and quality of life’, Office for Official Publications of the EC, Luxembourg, pp. 21 – 34.
Rabbinge, R., van Latesteijn, H.C., 1992. Long-term options for land use in the European Community. Agric. Syst. 40, 195 – 210.
Rabbinge, R., van Diepen, C.A., Dijsselbloem, L, Koning, G.H.J., van de Latesteijn, H.C., Woltjer, E., van Zijl, J., 1994. Ground for choices: a scenario study on perspectives for rural areas in the European Community. In: Fresco, L.O., Stroosnijder, L., Bourna, J., van Keulen, H. (Eds.), The Future of the Land: Mobilising and Integrating Knowledge for Land Use Options. Wiley, New York, pp. 95 – 121.
Russell, G., Wilson G.W., 1994. An agro-pedo-climatological knowledge base of wheat in Europe. Publ EUR 15789, Office for Official Publications of the EC, Luxembourg. Slicher van Bath, B.H., 1964. Eighteenth Century agriculture
on the continent of Europe: evolution or revolution. Agric. Hist. 43, 164 – 180.
Supit, L, Hooijer, A.A., van Diepen, C.A. (Eds.), 1994. System description of the WOFOST 6.0 crop simulation model implemented in CGMS. Publ. EUR 15956 EN, Series ‘An Agricultural Information System for the European Com-munity’, Office for Official Publications of the EC, Luxem-bourg.
Vossen, P., Rijks, D., 1995. Early crop yield assessment of the EU countries: the system implemented by the Joint Re-search Centre. Publ. EUR 16318 EN, Office for Official Publications of the EC, Luxembourg.
de Wit, C.T., 1992. Resource use efficiency in agriculture. Agric. Syst. 40, 125 – 151.