EXPLOITATION OF THE FULL POTENTIAL OF
PERSISTENT SCATTERER INTERFEROMETRY DATA
M. Crosetto a, N. Devanthéry a, M. Cuevas-González a, O. Monserrat a, B. Crippa b
a Centre Tecnològic de Telecomunicacions de Catalunya (CTTC), Geomatics Division, Av. Gauss 7, E-08860, Castelldefels (Barcelona), Spain – [email protected], [email protected], [email protected], [email protected]
b Department of Earth Sciences, University of Milan, Via Cicognara 7, I-20129, Milan, Italy – [email protected]
Commission VII, WG VII/2
KEY WORDS: Radar, SAR, deformation, monitoring.
ABSTRACT:
The potential of Persistent Scatterer Interferometry (PSI) for deformation monitoring has been increasing in the last years and it will continue to do so in the short future, especially with the advent of the Sentinel-1 mission. The full exploitation of this potential requires two important components. The first one is the improvement of the PSI processing tools, to achieve massive and systematic data processing capabilities. The second one is the need to increase the capabilities to correctly analyze and interpret the PSI results. The paper addresses both components. The key features of the PSI processing chain implemented by the authors, which is named PSIG chain, are described. This is followed by a brief discussion of the key elements needed to analyse and interpret the results of a given PSI processing. The paper concludes with a description of the results obtained by processing a full frame of very high resolution TerraSAR-X data that covers the metropolitan area of Barcelona (Spain).
1. INTRODUCTION
This paper concerns the exploitation of the potential of Persistent Scatterer Interferometry (PSI) for deformation measurement and monitoring. The PSI techniques, and in general, the Differential Interferometric Synthetic Aperture Radar (DInSAR) techniques, have experienced a major development in the last twenty years. The most significant improvement has been based on C-band SAR data from the satellite missions ERS-1/2, Envisat and Radarsat. The data archives of these satellites cover long periods of time, which is a key aspect to guarantee a long-term deformation monitoring. PSI has experienced a major step forward from 2007, with the advent of very high resolution (VHR) X-band data acquired by the satellite missions TerraSAR-X and CosmoSkyMed. The use of VHR on X-band data allows obtaining a dense spatial sampling of Persistent Scatterers (PSs), achieving a high sensitivity to small displacements and a remarkable quality improvement of the time series with respect to the C-band. A further significant improvement for PSI is expected with the data acquired by the C-band sensor of the Sentinel-1 satellite, launched on April 3, 2014. Sentinel-1 will remarkably improve the data acquisition throughput with respect to previous sensors, considerably increasing the PSI deformation monitoring potential.
The aspect of exploitation of the increased PSI potential will become very important with the availability of SAR data from the Sentinel-1 mission. It is worth noting that this has always been an open issue with any SAR mission. In fact, the PSI data processing capabilities allow processing just a fraction of the data acquired by the SAR satellites. In addition, the subsequent stages of data analysis, interpretation and exploitation usually require more resources (especially time) than the data processing. Therefore, on one side there is a need to improve the PSI processing tools, to achieve massive and systematic data processing capabilities. From the other side, increasing the
capacity to correctly analyze and properly interpret the PSI results is required.
This article starts with a concise description of the PSI chain proposed by the authors to process entire frames of SAR imagery. Section 3 discusses some important aspects of PSI data analysis and interpretation. Section 4 describes some results obtained from processing a full frame of VHR TerraSAR-X data that covers the metropolitan area of Barcelona (Spain) using the PSI technique.
2. A PSI CHAIN TO PROCESS ENTIRE FRAMES OF INTERFEROMETRIC SAR IMAGERY
As mentioned in the introduction, a key aspect to fully exploit the growing potential of PSI is to have flexible PSI processing tools. In this section, the key features of the PSI chain of the Geomatics (PSIG) Division of CTTC, which has been successfully tested with VHR X-band PSI data, are concisely described. A complete description of the PSIG chain is provided in Devanthéry et al. (2014).
The PSIG chain works with redundant interferograms; typically more than 10 interferograms per image are used. This is a key aspect to perform data quality control during the processing. The procedure includes three main processing blocks. In the first block, a set of correctly unwrapped and temporally ordered phases is obtained, which are computed over a set of PSs that covers the area of interest as homogeneously as possible. In the second block, the Atmospheric Phase Screen (APS) is estimated using spatio-temporal filters. Finally, the main products of the chain are derived in the third block, namely deformation velocity map, deformation time series and a set of quality indices required to check the quality of the results.
The main processing steps are described below.
The International Archives of the Photogrammetry, Remote Sensing and Spatial Information Sciences, Volume XL-7, 2014 ISPRS Technical Commission VII Symposium, 29 September – 2 October 2014, Istanbul, Turkey
This contribution has been peer-reviewed.
The first step is the so-called candidate Cousin PS (CPS) selection. A set of PSs with phases characterized by a moderate spatial variation is sought. This is accomplished by using at least a seed PS and searching for its “cousins”, i.e. PSs with similar characteristics. The seed has to be located on the ground (i.e. with zero Residual Topographic Error, RTE), displaying no deformation or thermal expansion and characterized by small noise. The similarity condition, see Devanthéry et al. (2014), is more restrictive than the ones based on the classical two-parameter model (mean deformation velocity and RTE) and, at the same time, the proposed procedure is computationally lighter. If a single seed is not sufficient to cover the entire area of interest (e.g. the entire frame of the processed SAR images), an iterative process is used to ensure an appropriate CPS coverage and density.
The output of the previous step is a set of candidate CPSs. A two-dimensional phase unwrapping is performed on the candidate CPSs using a redundant set of interferograms. An implementation of the Minimum Cost Flow method (Costantini, 1998; Costantini et al. 1999) is used in this step.
The phase unwrapping consistency check is a key step of the procedure. This check is based on a least squares estimation, followed by the analysis of the residuals, which are associated with phase unwrapping errors. After this, a control of the spatial distribution of the CPSs is usually carried out to ensure a homogeneous density over the entire area of interest. If this is not accomplished, the procedure is resumed using new seeds to look for new candidate CPSs. The output of this step is the final set of selected CPSs.
In the second block of the procedure, the APS is estimated using the selected CPSs by means of spatio-temporal filters, e.g. see Ferretti et al. (2000) and Berardino et al. (2002). The APS is then removed from the original interferograms, obtaining a set of APS-free interferograms. These interferograms are then used to estimate the deformation velocity and RTE over a dense set of PSs, denser than the selected CPSs. This is accomplished using the method of the periodogram. An extension of the two-parameter model can be optionally performed to account for the thermal expansion of the imaged objects, see Monserrat et al. (2011) and Crosetto et al. (2014). The RTE phase component is removed from the wrapped APS-free interferograms. The linear deformation component can optionally be removed and then, in a later stage, added back to the deformation time series. The same procedure can be done with the thermal expansion component.
The last part of the PSIG procedure includes the so-called 2+1D phase unwrapping, which works with redundant networks of interferograms (more than 10 interferograms per processed SAR image are used). Firstly, a 2D phase unwrapping is performed separately on each interferogram using the Minimum Cost Flow method (Costantini, 1998; Costantini et al. 1999). The temporal component of the interferograms is then exploited through a 1D phase unwrapping, which is performed pixel wise. Its main goal is the detection and correction of the errors generated in the 2D phase unwrapping stage. For this purpose, it uses an iterative LS procedure which fully exploits the integer nature of the unwrapping errors.
The main outcome of the 2+1D phase unwrapping are the deformation time series for each processed PS. The deformation velocity is usually estimated from the time series. In addition, the 2+1D phase unwrapping generates a rich set of parameters.
The vectors of the residuals for all the analysed pixels, computed at the 1st and last least squares iterations, are useful to obtain an overview of the entire dataset. In particular, they can be used to identify anomalous interferograms or images, where clusters of high residuals typically occur. Another important output is given by a 3-class quality index associated with each deformation time series. Three classes are defined, “Good”, “Fair” and “Warning”, which are derived per each image of a given time series by computing the ratio between the corrections and the interferograms connected with the image at hand. In addition to the quality index, the corrections per image are obtained for each time series. This is the most complete information that can be used to assess the quality of each image of a given time series.
3. PSI DATA ANALYSIS AND INTERPRETATION
As already mentioned in the introduction, a second essential component to exploit the potential of PSI for deformation monitoring is the analysis and interpretation of the PSI data. Two major steps can be distinguished. The first one involves a preliminary analysis and interpretation of the PSI results. Screening the PSI results is a fundamental task, which may concern hundreds of different types of deformation phenomena for a given frame of SAR imagery. The second steps concerns the exploitation of the PSI results, which ideally involves the identification of an end user and which may require the analysis of PSI data and many other auxiliary data by an expert of the specific phenomenon at hand, e.g. hydrogeology, landslides, underground construction works, etc.
The screening of the PSI results is a fundamental task and the in depth analysis might only focus on the most relevant deformation phenomena. It usually requires basic cartographic information, including the topography of the area under analysis. An effective screening needs appropriate procedures to consider the specific characteristics of the PSI data. Some of the most important characteristics are briefly discussed below.
It is important to keep in mind the opportunistic character of the PS spatial sampling when analysing the PSI results. While in some areas, like the urban areas, PSI obtains a high spatial sampling, in others, like vegetated and forested areas, the PSI measurements can be very sparse, if not null.
Due to the ambiguous nature of PSI observations, PSI suffers limitations in its capability to measure “fast” deformation phenomena. This limitation basically depends on the spatial pattern of the deformation, its PS sampling density and the temporal SAR sampling, i.e. the temporal distribution of the analysed SAR images.
Many PSI approaches resolve the unwrapping phase by assuming a linear deformation model for deformation. This is not the case for the PSIG procedure described above. The use of a linear deformation model can have a negative impact on the PSI estimates for all deformation phenomena characterized by non-linear temporal deformation, i.e. where this assumption is not valid. In areas where the deformation shows “significant non-linear motion” the PSI products may lack PSs because the observations do not fit the assumed linear model.
It is also important to mention that PSI deformation rates may sometimes contain spatial tilts or trends, which can be due
The International Archives of the Photogrammetry, Remote Sensing and Spatial Information Sciences, Volume XL-7, 2014 ISPRS Technical Commission VII Symposium, 29 September – 2 October 2014, Istanbul, Turkey
This contribution has been peer-reviewed.
either to uncompensated orbital errors or low frequency residual atmospheric effects.
The deformation measurements estimated with the PSI technique refer to the Line-of-sight (LOS) of the used SAR sensor. Given a generic 3D deformation, PSI provides the estimate of the LOS component of this deformation (i.e. the projection of the 3D deformation in the LOS direction). This aspect is particularly important when analysing landslides since the correct interpretation of the displacement requires considering the local topography.
4. EXAMPLE OF PSI PROCESSING OVER A FULL FRAME OF TERRASAR-X IMAGES
This section describes an example of PSI results obtained by processing the full frame of 28 TerraSAR-X images that cover
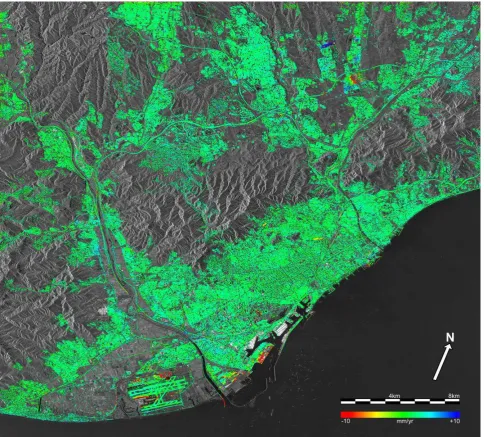
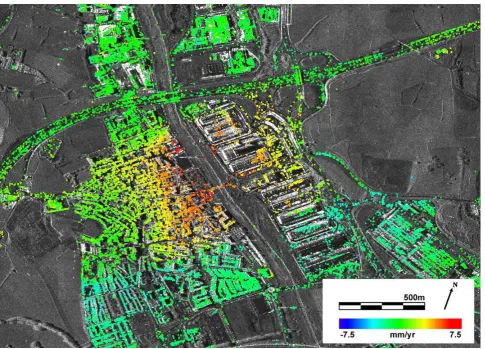
the metropolitan area of Barcelona. These images span the period from December 2007 to November 2009. The deformation velocity map of the full frame is shown in Figure 1. 5.4 million PSs were measured oven an area of 1019 km2. Only the major deformation phenomena are visible in Figure 1, e.g. the airport and the port of Barcelona and other subsidence and uplift areas located at the top right part of the image. However, hundreds of deformation phenomena of different size and magnitude were found. In this regard, more than thirty major deformation phenomena found over the entire frame are being analysed. Although not all of these phenomena have been analyzed yet, there are several examples of deformation caused by soil compaction, water abstraction (e.g. see an example in Figure 2), landslides, underground construction works (metro line and metro stations), etc. These results represent a valuable source of information for public and private entities in charge of the maintenance of indispensable assets of the Barcelona metropolitan area.
Figure 1: Deformation velocity map of the Barcelona dataset superposed to a mean SAR amplitude image. It includes more than 5.4 million PSs and covers 1019 km2.
The International Archives of the Photogrammetry, Remote Sensing and Spatial Information Sciences, Volume XL-7, 2014 ISPRS Technical Commission VII Symposium, 29 September – 2 October 2014, Istanbul, Turkey
This contribution has been peer-reviewed.
ACKNOWLEDGEMENTS
This work has been partially founded by the Fundación Ciudad de la Energía (http://www.ciuden.es). 20 of the 28 TerraSAR-X SAR images used in this work were acquired within the Project “Evaluation of DEM derived from TerraSAR-X data, LAN0634”, of the TerraSAR-X Science Service Program.
REFERENCES
Berardino, P., Fornaro, G., Lanari, R., & Sansosti, E., 2002. A new algorithm for surface deformation monitoring based on small baseline differential SAR interferograms. IEEE TGRS, 40, 11, 2375–2383.
Costantini, M., 1998. A novel phase unwrapping method based on network programming. IEEE TGRS, 36, 3, 813–821.
Costantini, M., Farina, A., Zirilli, F., 1999. A fast phase unwrapping algorithm for SAR interferometry. IEEE TGRS, 37, 1, 452– 460.
Crosetto, M., Monserrat, O., Cuevas-González, M., Devanthéry, N., Luzi, G., Crippa, B., 2014. Measuring thermal expansion using X-band Persistent Scatterer Interferometry. ISPRS J. of Photogrammetry and Remote Sensing (accepted for publication)
Crosetto, M. Monserrat, O., Iglesias, R., Crippa, B., 2010. Persistent scatterer interferometry: Potential, limits and initial C- and X-band comparison. Photogrammetric Engineering and Remote Sensing, vol. 76, no. 9, pp. 1061–1069.
Devanthéry, N., Crosetto, M., Monserrat, O., Cuevas-González, M., Crippa, B., 2014. An approach to Persistent Scatterer Interferometry. Remote Sensing, 6, pp. 6662-6679.
Ferretti, A., Prati, C., Rocca, F., 2000. Nonlinear subsidence rate estimation using permanent scatterers in differential SAR interferometry. IEEE TGRS, 38, 5, 2202–2212.
Monserrat, O., Crosetto, M., Cuevas, M., Crippa, B., 2011. The thermal expansion component of Persistent Scatterer Interferometry observations. IEEE Geoscience and Remote Sensing Letters, 8, 864–868.
Figure 2: Example of terrain deformation caused by water abstraction. The deformation velocity is superposed to a mean SAR amplitude image.
The International Archives of the Photogrammetry, Remote Sensing and Spatial Information Sciences, Volume XL-7, 2014 ISPRS Technical Commission VII Symposium, 29 September – 2 October 2014, Istanbul, Turkey
This contribution has been peer-reviewed.