JAMUNA RIVER EROSIONAL HAZARDS, ACCRETION
& ANNUAL WATER DISCHARGE
—
A REMOTE SENSING & GIS APPROACH
E.U.Pahlowan a, *, A.T.M. S. Hossain b
a Department of Geological Sciences, Jahangirnagar University, Savar, Dhaka-1342, Bangladesh – [email protected] b
Professor, Department of Geological Sciences, Jahangirnagar University, Savar, Dhaka-1342, Bangladesh – [email protected]
KEY WORDS: Jamuna River, Hazard, Remote Sensing, NDWI, Erosion, Accretion
ABSTRACT:
This paper presents the results of some of the Jamuna River erosional hazards from Bahadurabad Ghat to Bhuapur (near Jamuna Bridge). Results are also presented on the Jamuna River accretion and water discharge. Landsat images from 1977 to 2014 and water discharge data were analysed to find out a relationship between dynamics of erosion and accretion for different time intervals with average annual water discharge. It is clearly established that total amount of erosion and accretion rates varies with different times. The highest erosion rate 21.15 km2 year-1 was observed in the period of 1989-1992 and the highest accretion rate 13.57 km2 year-1 was observed in the period of 1980-1989. The erosion and accretion values fluctuated with increasing average annual maximum water discharge but the difference between erosion and accretion had remained low before water discharge reached to 67000 m3s-1 and it is estimated higher after crossing annual average maximum water discharge of 67000 m3s-1. This discharge value also plays an important role on bar development and active channel. It is also observed that unvegetated bar areas remained higher than active channel areas before average annual maximum water discharge reached to 67000 m3s-1. Finally, all the erosional hazards and accretion values are compared and evaluated to see their influence on the annual discharge.
* Corresponding author. Tel.:+880-01819693854. E-mail address: [email protected] (E.U.Pahlowan).
1. INTRODUCTION
Bangladesh is familiar globally with the countries most disclosed to the influence of global warming and climate change. This is owing to it's exceptional geographical location, supremacy of floodplains and low altitude from the sea and seductive dependence on nature. Riverbank erosion is a familiar natural disaster of Bangladesh and an issue of major distress. It causes indescribable desolations yearly people living alongside the banks of rivers in Bangladesh and turns into hazards. River bank erosion treats as geomorphic hazards. Geomorphic hazards demarcated as the instability of earth surface features treat that’s threat for human civilization (Gares et al., 1994). These features are significantly intense on landform response. Since 1973 major rivers similar to the Jamuna, the Ganges and the Padma have eroded around 1,590 km2 of floodplains making 1.6 million people homeless. Not only the floodplain inhabitants, but also the char land inhabitants are defenceless to river erosion (Aktar, 2013).
The Jamuna is the name known to the braided river downstream of the Old Brahmaputra distributary and is one of three large sand-bed rivers that cross the low-lying deltaic floodplain of Bangladesh (Ashworth, 1996). The Jamuna River growths in the Tibetan plateau, and 93% of its catchment lays outward of Bangladesh. By 2740 km beginning from its source and 220 km from the north borders of Bangladesh, the Jamuna contacts with the Ganges (after that becoming the `Padma') and then the Meghna, finally discharging into the Bay of Bengal (Ashworth, 1996). Jamuna have a history of 250 years (Bhuiyan et al., 2010). Since then the Jamuna River has sustained stable course, often detached by small islands/sandbars, called chars, within
the course. Unstable banks and rapid rates of sideways movement characterize this river. To arrange channels and chars within the Jamuna River changes by the year in response to the time’s sequence of flows (Khan and Islam, 2003). The annual discharge values are around 60000 m3s-1 which is three times greater than the Mississippi (Coleman, 1969) and may exceed 100000 m3s-1 in a 100-year flood (Halcrow et al., 1992). Amalgamation of variable discharges of water and sediment is responsible for the Jamuna’s braided plan. Braided rivers are regarded as unstable bank lines and rapid rates of sideways movement. There is sign of severe bank erosion and rapid rates of bank line retreat along the Jamuna River (Khan and Islam, 2003). The fourth Intergovernmental Panel on Climate Change (IPCC) Report forecasts for South Asia that monsoon rainfall will be higher, resulting in increased flows during the monsoon in the rivers. These flow well change the flood regimes and increase bank erosion (Rahman et al., 2010). Current climate change will alter the precipitation pattern including change in runoff and subsurface flow that have direct impact on future water ability of Jamuna River. Already The Jamuna has experienced expansion of flow over the years. Heavy rain on it's catchment area and water level rising by extreme snowmelt will increase discharge in future years due to current global warming (Rajib et al., 2011).
analysed for assessing active channel area, vegetated island, unvegetated bars, erosion and accretion of land along both sides of the river.
2. STUDY AREA
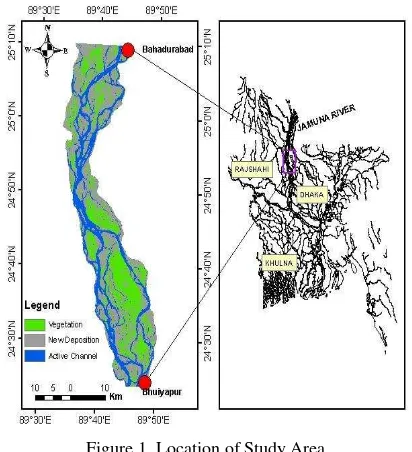
The Jamuna, geologically youngest River of the world (Archana and Nayan, 2012). Because of abnormal flood and tectonic movement Brahmaputra river started it's flow through a new course known as Jamuna from 1787 (Uddin et al., 2011).The starting point of the study area is Bahadurabad and the end point is Bhuiyapur. The investigated area is located (Figure 1) in between Latitude 24°20'-25°10’N and Longitude 89°30'-89°50'E. From the technical point of view, these two points have important significance in terms river flow and erosion (Ashworth, 1996). Because Bahadurabad is immediately upstream part experiencing river bank retreated and Bhuiyapur area river training works corrode Jamuna (Bhuiyan et al., 2010)..
Figure 1. Location of Study Area
3. GEOMORPHOLOGY AND HYDROGEOLOGY
The Jamuna displays dangerous forceful nature through its bank erosion rate (Coleman, 1969) and (Klaassen and Masselink, 1992). Gradual tilting triggered deviate of the Jamuna from the Brahmaputra and floodplain is aggressively descending due to echelon fault. The Jamuna contains different types and size of bars, Megaforms and Macroforms of bar in the Jamuna from hierarchical bedform classification (Jackson, 1975). Mid channel bar, one of the most common bar types in the Jamuna River. The actions and morphology of mid-channel bars in the Jamuna is strongly time dependent. Although bars also emergent without a change in flow stage or discharge because of anabranch cut (Leopold et al., 1957) and (Ashmore, 1982). The annual monsoons and tectonic settings dominate the sediment discharge in Jamuna (Rajib et al., 2011) and (Ashworth, 1996).
4. MATERIAL AND METHOD
4.1. Data
The basic data of the study area are Landsat satellite images of different years from 1977 to 2014. United States of Geological Survey (USGS) provides TM, MSS, ETM+, AND OLI (Path 148 and Row 43) images in the earth explorer website: http://earthexplorer.usgs.gov. All satellite images have taken at dry seasons. Atmospheric corrections were done for accuracy of the information that was extracted from different Landsat images. Geometric corrections were performed to fix each image into the UTM-46N projection. Because of flat land, the orthogonal transformation was not performed. All images were resample with the nearest neighbor method to a common resolution of 30m. Erdas Imagine software has been used for processing satellite images and analysis of the riverbank data. For analyzing, the historical flow patterns of Jamuna River from average yearly discharge data are collected from Bangladesh Water Development Board (BWDB). BWDB has historic records of Jamuna River discharge data frequency from many years from 1977-2006 were separately analyzed by using M.S. Excel to see the difference of flow
Satellite Sensor Path/Row Pixel
size(m) Date/year
Landsat 8 OLI 148/043 30 2014
Landsat 7 ETM+ 148/043 30 2011
Landsat 7 ETM+ 143/043 30 2004
Landsat 7 ETM+ 143/043 30 2000
Landsat 5 TM 143/043 30 1992
Landsat 5 TM 143/043 30 1989
Landsat 4 TM 143/043 30 1980
Landsat 3 MSS 143/043 60 1977
Table 1. Landsat images are used for extracting the information
4.2. Methodology
Satellite images for years 1977 and 2014 are used to get the important information about the study area. A detail methodology for extraction of the information from LS images is shown in Figure 2.
4.3. Preparation of NDWI and NDVI Image
The principle of NDWI (Normalized difference water index) (McFeeters) is similar to Normalized Difference Vegetation Index (NDVI). NDVI strengthen the presence of terrestrial vegetation and open water feature suppress from the soil features because of the different ways in which these features reflect these wavelengths McFeeters (McFeeters, 1996). NDVI values that are higher than zero consider as vegetated area and are less than zero consider as unvegetated area. The formula of NDVI as follows: (NIR – Red) / (NIR + Red).By reversing the equation and the green band used rather than the red, and then the result will reversed. The vegetation suppressed and the open water features strengthened (McFeeters, 1996). Though Landsat Multispectral Scanner (MSS) image data first used for NDWI (McFeeters), it is applicable for other sensor to find out extending open water. The equation for an NDWI is: (Green – NIR)/ (Green + NIR).(McFeeters, 1996) highlighted on the values of NDWI, which is larger than zero as water surfaces, which values are less than characterize to be non-water surfaces. For minimizing, the errors of selected feature to mottled pixels that are closest to water body and other low reflectance objects, only selected those pixels that has highest NDWI value. The sorted pixels than converted into one of the proposed class (signature) through use of mathematically settled on decision rule (maximum likelihood). Finally, identified the land cover features to which each proposed class matched. Active channel, Vegetated bar, and Unvegetated bar are identified from the image of NDWI and NDVI.
4.4.Demarcation of Jamuna River Bank Line
The river bank-line has been recognized and delimited aimed at all satellite images of 1977-2014. NDWI image is very useful for recognizing the river bank-line. Where the shallow water channel is considering as a part of river, old or newly deposited sand and silt near the riverbanks posture various doubt of interpretation as the river. The darker tone on satellite image, showing higher moisture and several soil spots those is close on the active water channel give sign and show bright signature and of low moisture. Here NDWI demark the area between higher and lower moisture content as well as bank line. Nevertheless, river flowing over recently when there was high flow and consider as a part of river. The identified river bank-line of the river, have been digitized in Arc Gis -10.1 software. Two riverbank lines have been prepared for the year 1977, 1980, 1989, 1992, 2000 2004, 2011, and 2014.Both left and right banks for all years have been identified using GIS software. Riverbank erosion and deposition has been calculated by superimposing two successive bank lines.
5. RESULTS AND DISCUSSIONS
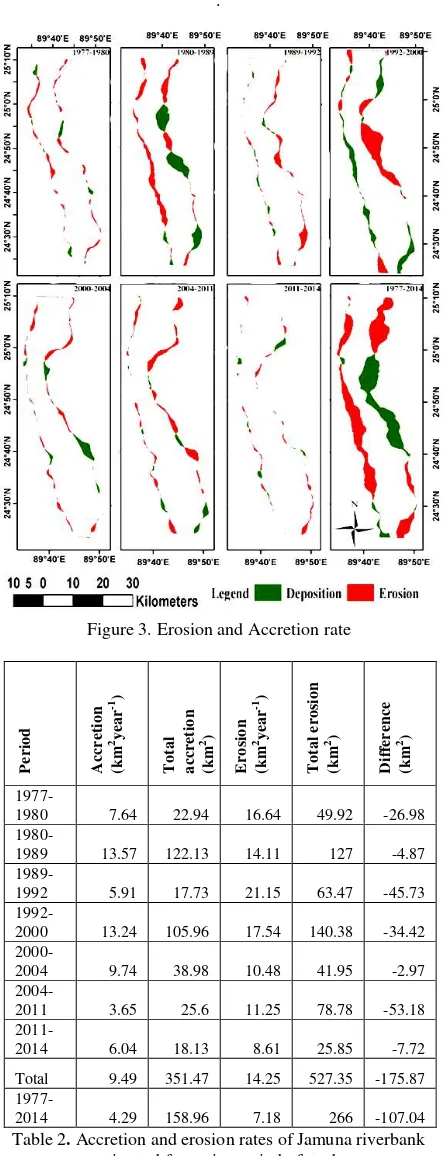
From the analysis, a series of different Landsat images from 1977 to 2014 reveal the yearly rates of erosion and accretion and their differences with different time in Figure 3 & Table 2. Through the time erosion and accretion are varied at different periods. The highest erosion rate was 21.15 km2year-1 in the period of 1989-1992 and the lowest erosion rate was 8.61 Km2year-1 in the period of 2011-2014. However, erosion rates swing between 17 km2year-1 to 10 km2year-1in the other periods. The summation of erosion rate from 7 different periods is 14.58 Km2year-1 and total land loss due to bank erosion was 540 km2. individual periods due to erosion was 160 km2 and net land loss because of erosion was 107 km2. So the remaining 53 km2 land was reworked during the period of 1977-2014. From this analysis, it is established that accretion and erosion were vigorous during this period. The total land change was about -107 km2, pointing out the overall loss of land was the dominant for the same period.
Figure 4. Bars area with time
The total area of river have been divided into three areas they area active channel area, Unvegetated Bar area and Vegetated Bar area. From Figure 4 maximum active channel area was 442 km2 in 2005. Minimum active channel area was 228 km2 in 1977.The maximum vegetated and unvegetated bar area was 291.71 km2 and 552.58 km2 during 2014 and 1992 respectively. In addition, minimum vegetated & unvegetated bar area was 148 km2 and 318 km2 during 1992 and 1989 respectively. Vegetated bars remain stable for several years and flooded during full stage of bank. Whereas unvegetated bars are composed by newly deposited sediment and reworked during every monsoon. The area of unvegetated bars remains higher than vegetated bars in every measurement. It indicates the dynamic nature of Jamuna on its bar depositions and erosions. These erosions and depositions have greater influence on riverbank erosion and accretion.
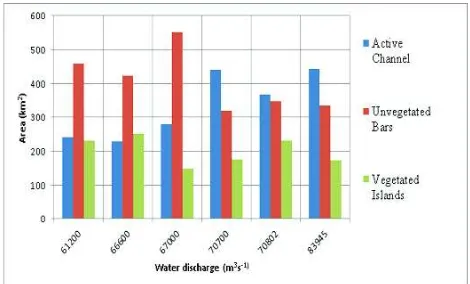
Figure 5. Bar dynamics with discharge
It can be seen from figure 5 that shows that water discharge control the river dynamics. Unvegetated bars area and active channel areas are fluctuated with increasing water discharge. But it significantly change when average annual maximum water discharge reached 67000 m3s-1.Unvegetated bar area remains higher than active channel area before average annual maximum water discharge reach 67000 m3s-1. After crossing average annual maximum water, discharge 67000 m3s-1 channel area tends to be greater than the area of unvegetated bars. The excess water, which is more than 6700 m3s-1, firstly erodes the unvegtated bars after those vegetated bars. These bar erosions help to change the river morphology during monsoon.
Figure 6. Erosion and Accretion with discharge
A relationship between river erosion accretion with discharge is shown in figure 6. It is observed that the erosion always greater than the accretion. Erosion show large fluctuation of area in a range of 42 km2 to 140 km2 over the past 37 years with general increasing trend. On the other hand, accretion (r = .126) shows less variation than erosion (r = .321) with general increasing pattern’s. The erosion and accretion showing with increasing average annual water discharge but the difference between erosion and accretion remains low before water discharge reaches 67000 m3s-1. Erosion and accretion tend to be higher after crossing annual average maximum water discharge 67000 m3s-1.The calculated 35 year average maximum water discharge of the Jamuna River at Bahadurabad is 67435 m3s-1 from 1971-2006 which is more than 67000 m3s-1. In the future year Jamuna will continue to increase its discharge due to ongoing climate change, which will increase its average annual discharge. Therefore, average annual maximum water discharge 67000 m3s-1 is a minimal discharge value for controlling the erosion and the accretion of Jamuna River. Erosion can be reduced by withdrawing excess water discharge from Jamuna.
6. CONCLUSION
REFERENCE:
Aktar, M.N., 2013. Impact of Climate Change on Riverbank Erosion. International Journal of Sciences: Basic and Applied Research (IJSBAR) 7, 36-42
Archana, S., Nayan, S., 2012. RS-GIS based assessment of river dynamics of Brahmaputra river in India. Journal of Water Resource and Protection 2012.
Ashmore, P.E., 1982. Laboratory modelling of gravel braided stream morphology. Earth Surface Processes and Landforms 7, 201-225.
Ashworth, P.J., 1996. Mid-channel bar growth and its relationship to local flow strength and direction. Earth Surface Processes and Landforms 21, 123.
Bhuiyan, M.A., MA, R., Kumamoto, T., M Julleh Jalalur, R., Shigeyuki, S., 2010. Regulation of Brahmaputra-Jamuna River around Jamuna Bridge Site, Bangladesh: Geoenvironmental Impacts. Journal of Water Resource and Protection 2010.
Coleman, J.M., 1969. Brahmaputra River: channel processes and sedimentation. Sedimentary Geology 3, 129-239.
Gares, P.A., Sherman, D.J., Nordstrom, K.F., 1994. Geomorphology and natural hazards. Geomorphology 10, 1-18.
Halcrow, S.W., Partners, institut, D.h., Borḍa, B.P.U., 1992. River Training Studies of the Brahmaputra River, River Bank Protection Project, Brahmaputra Right Bank Priority Works: Environmental Impact Assessment. Sir William Halcrow & Partners Limited.
Jackson, R.G., 1975. Hierarchical attributes and a unifying model of bed forms composed of cohesionless material and produced by shearing flow. Geological Society of America Bulletin 86, 1523-1533.
Khan, N.I., Islam, A., 2003. Quantification of erosion patterns in the Brahmaputra–Jamuna River using geographical information system and remote sensing techniques. Hydrological Processes 17, 959-966.
Klaassen, G.J., Masselink, G., 1992. Planform changes of a braided river with fine sand as bed and bank material.
Leopold, L.B., Wolman, M.G., Wolman, M.G., Wolman, M.G., 1957. River channel patterns: braided, meandering, and straight. McFeeters, S., 1996. The use of the Normalized Difference Water Index (NDWI) in the delineation of open water features. International journal of remote sensing 17, 1425-1432.
Rahman, M.U., Sarwat Jahan, Kamal, M.M., 2010. Response of Climate Change on the morphological behavior of the major river system. Institute of Water Modelling
Rajib, M.A., Rahman, M.M., McBean, E.A., 2011. Application of regional climate model simulation and flow data for assessing future water availability in the River Jamuna. Int. J. Environ. Sci 1, 884-896.
Uddin, K., Shrestha, B., Alam, M.S., 2011. Assessment of Morphological Changes and Vulnerability of River Bank Erosion alongside the River Jamuna Using Remote Sensing. Journal of Earth Science and Engineering 1, 30-35.
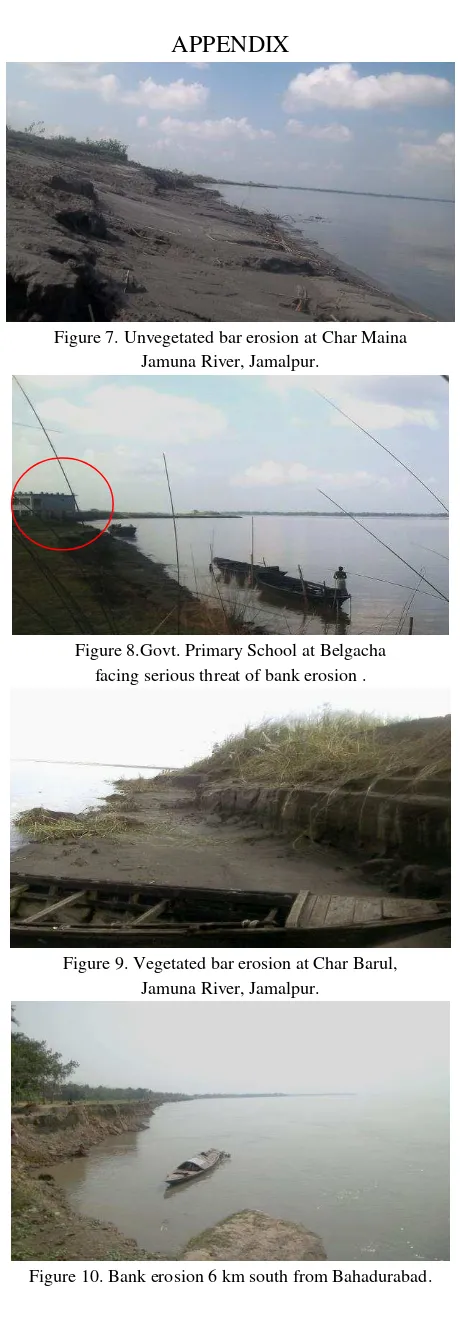
APPENDIX
Figure 7. Unvegetated bar erosion at Char Maina Jamuna River, Jamalpur.
Figure 8.Govt. Primary School at Belgacha facing serious threat of bank erosion .
Figure 9. Vegetated bar erosion at Char Barul, Jamuna River, Jamalpur.