UTILIZATION OF PISAR L-2 DATA FOR LAND COVER CLASSIFICATION IN
FOREST AREA USING PIXEL-BASED AND OBJECT-BASED METHODS
Bambang Trisakti a, *, Ahmad Sutanto a, Heru Noviar a and Kustiyo a
a
Indonesian National Institute of Aeronautics and Space (LAPAN), Jakarta, Indonesia – [email protected]
KEY WORDS: PiSAR-L2 data, Pixel-based method, Object-based method, Full polarization, Texture band, Forest
ABSTRACT:
Polarimetric and Interferometric Airborne SAR in L-band 2 (PiSAR-L2) program is an experimental program of PALSAR-2 sensor in ALOS-2 satellite. Japan Aerospace Exploration Agency (JAXA) and Indonesian National Institute of Aeronautics and Space (LAPAN) have a research collaboration to explore the utilization of PiSAR-L2 data for forestry, agriculture, and disaster applications in Indonesia. The research explored the utilization of PiSAR-L2 data for land cover classification in forest area using the pixel-based and object-based methods. The PiSAR-L2 data in the 2.1 level with full polarization bands were selected over part of forest area in Riau Province. Field data collected by JAXA team was used for both training samples and verification data. Pre-processing data was carried out by backscatter (Sigma naught) conversion and Lee filtering. Beside full polarization images (HH, HV, VV), texture imagess (HH deviation, HV deviation, and VV deviation) were also added as the input bands for the classification processes. These processes were conducted for 2.5 meter and 10 meter spatial resolution data applying two methods of the maximum likelihood classifier for pixel-based classification and the support vector machine classifier for the object-based classification. Moreover, the average overall accuracy was calculated for each classification result. The results show that the use of texture images could improve the accuracy of land cover classification, particularly to differentiate between forest and acacia plantation. The pixel-based method showed a more detail information of the objects, but has “salt and pepper”. In the other hand, the object-based method showed a good accuracy and clearer border line among objects, but has often some misinterpretations in object identification..
* Corresponding author: [email protected]
1. INTRODUCTION
Utilization of remote sensing satellite data has been carried out extensively to support various sectors, such as agriculture, forestry, water resources, marine fisheries and disaster mitigation. Nowadays, optical satellite sensor is still the most widely used sensor, because it can record the satellite data with high spatial, high temporal and high spectral resolution. By those capabilities, optical satellite data can give the detail information of the objects (i.e. shape, colour) which are closely similar to the condition of real objects on the earth's surface. The main problems of optical data are the presence of cloud cover (electromagnetic waves in the visible to infrared range are reflected by cloud), and also the dependency on sunlight as a light source. These problems caused a lot of data acquired by optical sensor could not be used due to the high cloud cover.
Synthetic Aperture Radar (SAR) is one of the most promising satellite sensors for monitoring the earth surface at a regional to global scale. SAR has many useful characteristics for supporting various applications, such as cloud-free, day or night observation capability, highly spatial resolution produced by the synthetic aperture technique, and also polarimetric and interferometric information (JAXA, 2012). In particular, cloud-free observation by SAR is a great advantage for monitoring in humid tropical regions such as Indonesia. Regarding to that reason, it is very important to explore the potentiality of SAR capability and utilize the SAR data to support various applications needed in Indonesia.
ALOS (Advanced Land Observing Satellite) is a Japan satellite that was launched on January 24, 2006 from Tanegashima
launch Centre, Japan. ALOS satellite is an advanced generation of JERS-1 and ADEOS which was equipped with more advanced technology. ALOS has three instruments, those are: Panchromatic Remote-sensing Instrument for Stereo Mapping (PRISM), the Advanced Visible and Near Infrared Radiometer type-2 (AVNIR-2), and the type L band Phased-Array Synthetic Aperture RADAR (PALSAR). PALSAR is a SAR sensor with spatial resolution 10-100 meter, and it has capability to record data in full polarization (HH, VV, HV, and VH) mode (JAXA, 2008). Some papers related to the PALSAR data utilizations have been published. The results showed that PALSAR data was potential to be used or identifying paddy field in small area with varied landforms (Raimadoya et al., 2007), land cover classification using multi polarization of PALSAR data (Sambodo et.al., 2005). The application of SAR (including PALSAR data) in forestry shows that SAR systems have a good capability in discriminating various types of forest cover (Sgrenzaroli, 2004). PALSAR also has been proven to be good data for mapping forest-non forest by combining with a time-series of Landsat-based maps (Lehmann et al., 2012), and could be used to estimate above ground biomass of dense forest (Watanabe et al., 2013).
Japan Aerospace Exploration Agency (JAXA) and some Indonesia research`s institutions under Ministry of Reseach and Technology of Indonesia to verify the potential uses of PiSAR-L2 data for some applications in Indonesia. Remote sensing application centre (LAPAN) has responsibility for PiSAR-L2 data utilization for some applications, such as: forest mapping, ship detection and disaster mitigation.
Table 1. Specification of PiSAR-L2 sensor
The research purpose is to explored the utilization of full polarization PiSAR-L2 data for land cover classification in forest area. Two classification method (pixel-based and object-based method) were carried out and compared and analyzed to know the appropriate method for forest mapping in Indonesia.
2. MATERIAL AND METHOD
The study area is located in Riau Province, as shown in Figure 1. Land covers in the study area were identified based on land data level 2.1(Ortho image), full polarization (HH, HV, VV and VH) and 2.5 spatial resolution for 5 August 2013 acquisition date. The data was obtained from JAXA.
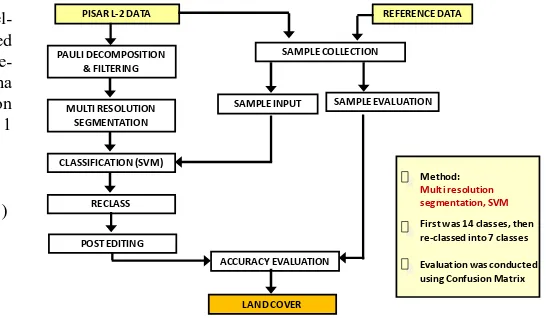
The flowcharts of the research are shown in Figure 2 for pixel- based classification method, and Figure 3 for object-based classification method. The first step was PiSAR-L2 data pre-processing. The pre-processing was conducted by doing sigma naught (backscatter) conversion and implementing Lee filter on the imagery. The conversion algorithm is shown in equation 1
CF is calibration Factor for PALSAR-2 data with the value -79.6
Figure 1. Study area in Riau Province, Sumatera Island, Indonesia
Figure 2. Flowchart of the pixel-based classification using PiSAR-L2 data First was 14 classes, then re-classed into 7 classes
Figure 3. Flowchart of the object-based classification using PiSAR-L2 data
classifier was used for pixel-based classification. On other hand, Multi Resolution Segmentation (MRS) and Support Vector Machine (SVM) classifier were used for object-based classification. Segmentation and SVM have been reported to be able to improve accuracy of object classification using SAR data (Li et al., 2008). The processing procedures for object-based classification were: 1) created Pauli decomposition image, 2) image segmentation using multi resolution segmentation method, and 3) land cover classification using SVM classifier with radial basis function kernel.
Classification was conducted for 2 different spatial resolution data (the original spatial resolution in 2.5 m and the re-sampled one in 10 m). To analyzed the effect of texture images on
Evaluation samples were collected for 6 sets of sample based on land cover map in 2009 produced by WWF and field survey data collected by REDD and JAXA team in 2012, and the evaluations were carried out using confusion matrix method. Each the land cover classification result was evaluated 6 times using 6 sets of evaluation sample, and then the final overall accuracy was calculated by averaging all the overall accuracy results. Finally, the classification accuracy produced from pixel-based classification and object-pixel-based classification method were compared and analyzed.
3. RESULT AND DISCUSSION
Figure 4, 5 shows the land cover classification results using 10 meter spatial resolution of PiSAR-L2 image by pixel-based classification method (Maximum likelihood Enhance Neighbour Classifier). The classification result in Figure 4 used 3 polarization (HH, VV, HV), otherwise the classification result in Figure 5 used 3 polarization images (HH, VV, HV) and 3 texture images (deviation HH, deviation VV and deviation HV).
FOREST
Figure 4. Land cover classification using 10 spatial resolution with 3 polarization images
In case of classification result with 3 polarization images (Figure 4), it was detected that misclassification occurred in all
classes, especially there are so many mixing pixel (salt and pepper) among forest, acacia and old acacia classes. The mixing pixels also followed rectangle patterns, which these patterns were also found in the original image (level 2.1). Based on the fact, the mixing pixels occurred in the rectangle area could be resulted by noise in the original image.
Implementation of texture images as input layer on classification process improved the classification result. Classification result using 6 images (3 polarization and 3 texture images) showed better performance comparing to the classification result using only 3 images (3 polarization). The mixing pixels reduced significantly in all classes. The highest improvement of classification result can be known by the reducing of the acacia pixels in forest class.
FOREST
Figure 5. Land cover classification using 10 spatial resolution with 3 polarization images and 3 texture images
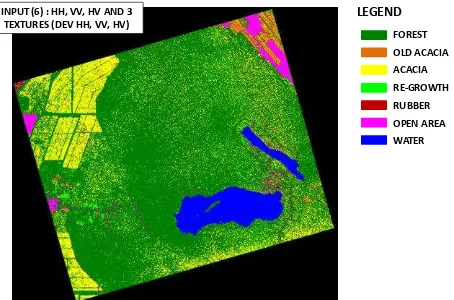
Figure 6 shows land cover classification results using 2.5 meter spatial resolution of PiSAR-L2 image by pixel-based classification method (Maximum likelihood Enhance Neighbour Classifier). The classification result shows that mixing pixels can be found in all classes and they have similar pattern with the mixing pixels of the classification result in Figure 4. Even though, the classification result based on 2.5 meter spatial resolution gives smoother and more detail information of land cover in study area. Comparison between Figure 5 and Figure 6 shows that the land cover classification result based on 10 m spatial resolution has better performance than the classification result based on 2.5 spatial resolution of PiSAR-L2.
FOREST OLD ACACIA ACACIA RE-GROWTH RUBBER OPEN AREA LEGEND
WATER INPUT (6) : HH, VV, HV AND 3
TEXTURES (DEV HH, VV, HV)
Figure 6. Land cover classification using 10 spatial resolution with 3 polarization bands and 3 texture bands
Figure 7 Segmentation result of PiSAR-L2 with scale 40, colour 0.5 and shape 0.5
INPUT (6) : HH, VV, HV AND 3 TEXTURES (DEV HH, VV, HV)
FOREST OLD ACACIA ACACIA RE-GROWTH RUBBER OPEN AREA LEGEND
WATER
Figure 8. Land cover classification using 10 spatial resolution with 3 polarization images and 3 texture images (Object-based)
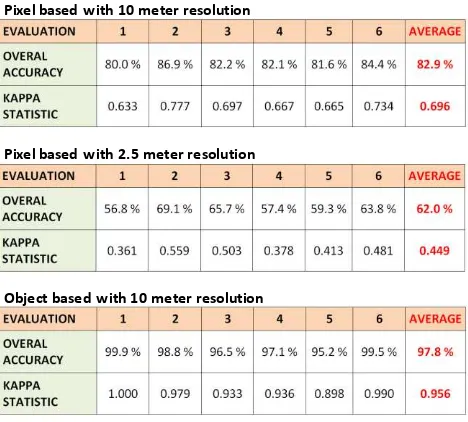
Accuracy evaluations were conducted for all classification results, and the evaluation results were shown in Figure 6. Comparing to pixel-based classification, object-based
classification shows better overall accuracy and kappa statistic value. Overall accuracy of pixel-based classification reached to 97 % with 0.95 of kappa statistic value. On other hand, pixel-based classification only reached to 83% for 10 m spatial resolution and 62% for 2.5 spatial resolution of PiSAR-L2 data. .
OBJECT
PIXEL Acacia
Miss Interpretation
Figure 9. Misinterpretations in object-based classification result
Pixel based with 10 meter resolution
Pixel based with 2.5 meter resolution
Object based with 10 meter resolution
Figure 10. Accuracy evaluations for all classification results
4. CONCLUSION
The utilization of full polarization PiSAR-L2 data for land cover classification in forest area was studied using two classification method (pixel-based and object-based method), some results from this study as shown below:
1. PISAR-L2 can be used to accurately map land cover in forest area using pixel-based and object-based classification 2. Some land cover types were difficult to be classified, but
3. Pixel-based method showed detail information of the objects but has many “salt and pepper”, in other hand object-based method showed good accuracy and clear border line among objects but has some misinterpretations in object identification.
4. Object-based method can be considered for accurately mapping forest-non forest area.
ACKNOWLEDGEMENTS (OPTIONAL)
Authors would like to thank to JAXA for PISAR L-2 data and other field data contribution, Authors also thank to LAPAN, BPPT and RISTEK for supporting this research activity.
REFERENCES
JAXA, 2008. ALOS User Handbook, NDX-070015, EORC-JAXA.
JAXA, RISTEK, BPPT, 2012. JAXA-RISTEK-BPPT-LAPAN-BIG joint airborne synthetic aperture radar campaign in Indonesia for forest carbon monitoring, ship detection, disaster monitoring, geometric evaluation, and crop monitoring, JAXA/EORC.
Lehmann, E.A., Caccetta P. A., Zhou Z.S., McNeill S.J., Wu X., Mitchell A.L., 2012. Joint Processing of Landsat and ALOS-PALSAR Data for Forest Mapping and Monitoring. IEEE Transactions on Geoscience and Remote Sensing, Vol. 50, no. 1, pp. 55-67.
Li, H.T., Gu H.Y., Han Y.S., Yang J.H., 2008. Object-oriented Classification of Polarimetric SAR Imagery based on Statistical Region Merging and Support Vector Machine. International Workshop on Earth Observation and Remote Sensing Applications.
Raimadoya, M.A., Trisasongko B.H., and Nurwadjedi, 2007. Eksplorasi Citra Radar Untuk Intelijen Ketahanan Pangan. Departemen Ilmu Tanah dan Sumberdaya Lahan. Faculty of Bogor Institute of Agriculture (in Bahasa)
Sambodo, K. A., Teguh K., and Santoso H., 2005. Klasifikasi Data Polarimetrik RADAR Dengan Menggunakan Metode Dekomposisi Cloude and Pottier. Proceeding of MAPIN XIV, page 79-84, Surabaya, Indonesia (in Bahasa).
Sgrenzaroli, M., 2004. Tropical forest mapping at regional scale using the GRFM SAR mosaics over The Amazon in South America. Ph.D. Thesis Wageningen University, 25 Feb 2004.
Shimada, M., Isoguchi O., Tadono T. and Isono K., 2009. PALSAR Radiometric and Geometric Calibration. IEEE Transaction on Geoscience and Remote Sensing (47), 12, 3915-3931
Shimada, M., Kawano N., Watanabe M., Motohka T., and Ohki M., 2012. Calibration and Validation of the PiSAR-L2. In: Proceeding of 53rd Autumn Conference of the Remote Sensing Society of Japan pp. 37-38, 2012
Shimada, M., Watanabe M., Motohka T., Shiraishi T., Thapa R.B., Kawano N., Uttank A., Sadly M., and Rahman A., 2014. Final Report on Japan-Indonesia PiSAR-L2 Campaign “Japan
-Indonesia PiSAR-L2 Campaign 2012”, March 2014, JAXA-RISTEK-BPPT
Watanabe, M., Motohka T, Shiraishi T., Thapa R.B., Kawano N., and Shimada M., 2013. Correlation between forest biomass and full polarimetric parameters derived from PiSAR-L2 data for a site in Riau, Indonesia. In: Proceedings of 34th