MAN IN BIOSPHERE RESERVE: A REMOTE SENSING STUDY IN SIMILIPAL, ORISSA
Anima Biswal1, Sumit Mukherjee2, A Jeyaram1 and YVN Krishna Murthy1 1
Regional Remote Sensing centre (East), NRSC, ISRO, Kolkata 2
Anthropological Survey of India, Kolkata KEY WORDS: SBR, core, RGB-NDVI, Zonal statistics, Change detection
ABSTRACT:
The Similipal is a densely forested hill-range in the heart of Mayurbhanj district,Orissa, lying close to the eastern-most end of the Easternghats. Similipal Biosphere Reserve is located in the Mahanadian Biogeographical Region and within the Biotic Province, Chhotanagpur Plateau.There are 4 villages in the core and 61 villages in the buffer area of the biosphere reserve .Agriculture is not well developed and employment opportunities are very poor , most of the people derive their income from collection of NTFP and sale of firewood and timber. A collaborative work is carried out by Regional Remote Sensing Centre(East) and Anthropological survey of India,Kolkata to study the impact of those four villages in the core area of SBR on the conservation of natural resources over the decades.Change in vegetation density as measured by NDVI over the decades is analysed to study the impact of these villages on the core area of Similipal Biosphere Reserve.
1. INTRODUCTION
Protected areas usually include ecosystems little modified by human activities. Similipal Biosphere Reserve is one of the seven biosphere reserve in india identified under man in Biosphere programme of UNESCO. SBR, a sanctuary from 1979 and a national park (1980/1986) given the biosphere status in the year 1994 with the broad objectives for Conservation of the area as a representative ecosystem under "Mahanadian Biographic Region". Tropical forests are exploited for varied purposes as timber, slash-and-burn cultivation and pasture development (de Moraes et al., 1998) and vegetation changes are often the result of anthropogenic pressure (e.g. population growth) and natural factors such as variability in climate (Guerra et al., 1998; Janetos and Justice, 2000). In this regard, protected areas need periodic monitoring for effective conservation, management and planning. Remote sensing is a proven technology that is effective for mapping and characterizing cultural and natural resources (e.g., Jensen, 1996; Campbell, 1997; Welch et al., 2002) which allows observation and measurement of biophysical characteristics of the landscape, and tracking of long term changes in landscapes (Parmenter et al., 2003; Wang & Moskovits, 2001). Change detection using remote sensing helps to discern and analyze areas that have been altered by natural or anthropogenic processes (Jantz et al., 2003;Hansen et al., 2002) . The NDVI is a reliable ecological indicator for successfully monitoring temporal and spatial variation in vegetation density as well as the health and viability of plant cover (Fung and Siu, 2000; Jiang et al., 2008; Wang, Price, and Rich, 2001; Weng, Lu, and Schubring, 2004) over a long period of time.
The ease of calculating NDVI from various types of satellite data and the success of the NDVI in detecting vegetation along with easy interpretation has made it a popular spectral vegetation index (Cohen, 1994; Gao, 1996; Myneni & Asrar, 1994. Normalized Difference Vegetation Index (NDVI) is one of the most widely used spectral index related to ecosystem functions which could greatly enhance the assessment and monitoring of protected areas and the implementation of management approaches, such as Adaptive Management (Walters 1986), Ecosystem Management
(Grumbine 1994),Systematic Conservation Planning (Margules and Pressey(2000) .
Base line conditions and temporal NDVI trends in protected areas have also served as a reference for comparing the effects of land-use changes in adjacent areas (Garbulsky and Paruelo 2004; Paruelo and others 2005). Hayes and Sader (2001) compared image differencing, principal component analysis, and RGB-NDVI methods for a tropical forest study site and they found that RGB-NDVI change detection method to be the most accurate and efficient to analyze several dates of Landsat TM imagery. RGB-NDVI incorporated three dates at one time as opposed to two-date images used with other methods (Wilson & Sadar,2001) for change detection such as image differencing, delta classification, and multi temporal linear data transformations. For these reasons, the RGB-NDVI classification was selected along with NDVI differencing as the change Detection method suitable for analyzing multiple dates of satellite imagery in this study.
The present study aims to evaluate the decadal changes in terms of vegetation density as measured by NDVI in the core area of Similipal biosphere reserve particularly in the area surrounding the four core villages.
2. MATERIALS AND METHODS
2.1 Study Area
ISPRS Archives XXXVIII- 8/W20; Workshop Proceedings: Earth Observation for Terrestrial Ecosystems Three distinct seasons are felt during the year. Rainy season starts
from middle of June and continues till October with average rain fall of about 1250 mm in the monsonic leeward valleys, over 2000 mm is the general spread of the rainfall in the plateau..The Similipal hills are drained eastward by a large number of perennial streams and nalas flowing in all directions. They ultimately join with one of the main river systems such as the Budhabalang, Baitarani and Subernarekha.There are four villages inside the core (Fig.1) namely Bakua, Jenabil, Kabatghai and Jamunagarh. The human population in core has increased from 394 to 576 from 1981 to 1991 censuses. Khadia, a primitive tribe inside the Reserve subsists on collection of non-timber forest products. People in the Reserve area are largely tribal with low level of skills, lower educational levels, socio-culture traits, they are mainly dependent on local resources. There was nearly forty per cent rise in human population between 1971-1991.
2.2 Data Used
Survey of India toposheet of 50,000 scale was used along with LISS IV images of IRS P6 for locating the core villages in the SBR.For studying the decadal changes, Landsat MSS of 1975 ,TM of 1990 and 2005 were used. The details of the path /row are given in table 1. Images were downloaded from the Global Land-cover Facility site hosted by the University of Maryland (glcfapp.umiacs.umd.edu). All the landsat images were acquired during the dry season, which enables us to ensure that the images are completely cloud free, and also allow us to differentiate forest from nonforest areas, with a greater degree of accuracy. All image processing was carried out using the ERDAS Imagine image processing software. The biosphere was delineated in to core, buffer and transition zones as per the map provided by the state forest department. The ancillary information was collected by Anthropological Survey of India, Kolkota.
Landsat Path-row Date Year
MSS 150045 19-Nov 1975
TM 139045 21-Nov 1990
TM 139045 14-Nov 2005
Table 1. Details of the Landsat images used in the study 2.3Methodology
After atmospheric correction and elimination of offset value of satellite data, in order to prepare two or more satellite images for an accurate change detection comparison, it is essential to geometrically rectify the imagery (Macleod and Congalton,
1998). Erroneous land cover change results may occur if any misregistration greater than one pixel occurs (Lunetta and Elvidge, 1998). The accuracy of image registration is usually conveyed in terms of Root-Mean-Square (RMS) error. The TM 1990 image using 30 ground control points (GCPs) was registered to SOI digital topographical map. After this process of image-to image registration, TM 2005 and MSS 1975 were then adopted for the registration with TM 1990 using 30 GCPs. Care was taken to ensure that the RMS error of image-to-image coregistration was less than 0.5 pixels (15 m). The registration error (RMS) obtained was 0.3 pixel for TM 1990 image and 0.4 pixel for MSS 1975 image. Both images were resampled using the nearest neighbor resampling algorithm (Jensen 2000). Vector module of ERDAS 9.1 software has been used for building the mask and for obtaining the boundary of different zones as specified by the forest department.
An assessment of vegetation cover change in terms NDVI between 1975,1990 and 2005 was conducted using post classification change detection analysis, NDVI differencing and RGB -NDVI method. The biosphere boundary was digitized from a 1:50,000 survey map provided to us by the Forest Department and the 1:50,000 Survey of India topographic maps were used to create point coverages of the centroids of the four villages located within the core zone. For the purpose of studying the effects of these villages on the vegetation cover in the core area, zonal statistics of NDVI were extracted for 5 km buffer around each village using the zonal statistics function in ERDAS. The change in NDVI was also visualized using RGB-NDVI method.
3. RESULTS AND DISCUSSION
3.1 Change Detection
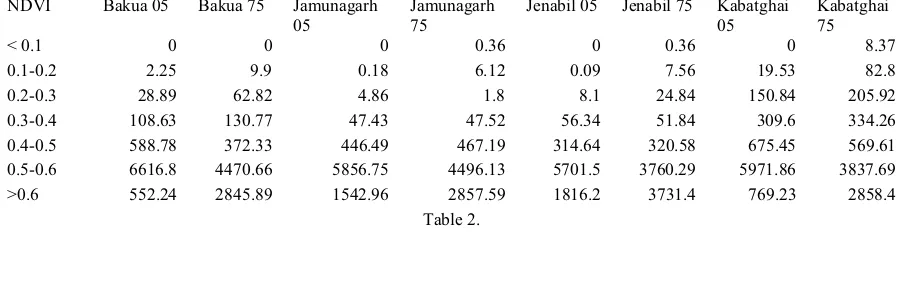
NDVI was computed as per the formula: NDVI= (NIR-R)/(NIR+R) for all the landsat images, Where R and NIR are the reflectance in red and infra red region respectively. These NDVI maps were then classified by a maximum likelihood algorithm in order to map the spatial distribution of NDVI in the 5 km buffer area surrounding the villages. The different classes of NDVI and their aerial extent for 1975 and 2005 were presented in the table 2, it is observed that the NDVI class 0.5-0.6 occupies the maximum area for all the villages in both the year followed by the class >0.6.The decadal change (in terms of absolute values) is also the highest in these classes where as other classes was very insignificant.
NDVI Bakua 05 Bakua 75 Jamunagarh 05
Jamunagarh 75
Jenabil 05 Jenabil 75 Kabatghai 05
Kabatghai 75
ISPRS Archives XXXVIII- 8/W20; Workshop Proceedings: Earth Observation for Terrestrial Ecosystems Villages maximum
NDVI
minimum NDVI
mean NDVI
range sd CV
Bakua 1975 0.733 0.106 0.58 0.627 0.061 10.52
Bakua 1990 0.709 -0.161 0.551 0.87 0.072 13.07
Bakua 2005 0.667 0.107 0.551 0.56 0.046 8.35
Jamunagarh 1975 0.724 0.059 0.589 0.665 0.055 9.34
Jamunagarh 1990 0.714 -0.043 0.568 0.758 0.063 11.09
Jamunagarh 2005 0.702 0.187 0.567 0.516 0.043 7.58
Jenabil 1975 0.724 0.059 0.593 0.665 0.054 9.11
Jenabil 1990 0.714 -0.043 0.574 0.758 0.062 10.80
Jenabil 2005 0.702 0.187 0.573 0.516 0.042 7.33
Kabatghai 1975 0.729 0.024 0.562 0.704 0.096 17.08
Kabatghai 1990 0.708 -0.357 0.545 1.065 0.104 19.08
Kabatghai 2005 0.67 -0.04 0.543 0.71 0.071 13.08
Table.3 NDVI characteristics over the year
Zonal statistics were extracted for all the buffer zones surrounding the core villages and The NDVI characteristics were presented in the table 3 along with the change in mean NDVI over the years in Fig.2.The mean NDVI was invariably higher in 1975 for all the villages though the decrease is very insignificant over the years. It can be inferred from these statistics that the vegetation surrounding these villages are mostly unaffected over the years which is again validated by RGB-NDVI results.
3.2 RGB-NDVI method
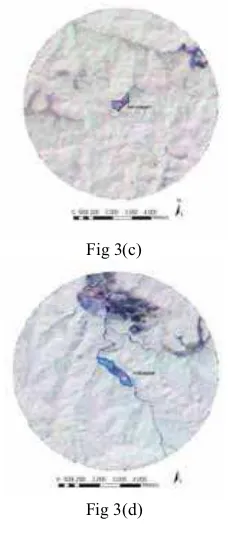
The visual RGB-NDVI method (Sader & Winne, 1992) involves creation of color composites and utilization of additive color theory where three time period NDVI are each combined with either the red, green, or blue color write functions of the computer monitor. Any combination of primary colors of similar brightness produces a complementary color (Lillesand & Kiefer, 1994; Sader & Winne, 1992). This is similar to the multidimensional temporal feature space analysis method (Coppin & Bauer, 1996), except RGBNDVI uses three NDVI as opposed to three TM bands. Forest change dynamics from 1975 to 2005 can be quantified as depicted in Fig 3(a) to (d) using RGB-NDVI method. In this study, NDVI 1975,1990 and 2005 were assigned Red ,green and blue respectively. It is clearly seen that the 5 km buffer area around each village, which is supposed to be most affected by
anthropogenic pressure has not under gone major change with respect to the vegetation density as quantified by NDVI. The areas which are unchanged for all the three years is shown as white/light grey and dark gray. These areas are very highly dense forest area with NDVI is more than 0.5 for all the study years. Some magenta patches are seen for the village Bakua in Fig. 3(a) which depicts a change vector particularly a decrease in NDVI from 1990 to 2005.Few pixels are displayed as cyan colours which represents a decrease in NDVI from 1975 to 1990 and increase from 1990 to 2005.
4. CONCLUSIONS
ISPRS Archives XXXVIII- 8/W20; Workshop Proceedings: Earth Observation for Terrestrial Ecosystems
Fig. 1 LISS IV image showing the location of the villages in the core zone of SBR
Fig.2 Change in mean NDVI over the years
Fig 3(a)
Fig 3(c)
Fig 3(d)
REFERENCES
Campbell, J. B. (1997). Introduction to remote sensing. New York: Guilford Press.
Cohen, W. B. (1994). GIS applications perspective: current research on remote sensing of forest structure. In: V. A. Sample (Ed.), Remote sensing and GIS in ecosystem management ( pp. 91–107). Washington, DC: Island Press.
De Moraes, J. F. L., Seyler, F., Cerri, C. C. and Volkoff, B., 1998. Land cover mapping and carbon pools estimstes in Rondonia, Brazil.int.j.remote sensing, 1998, Vol.19, no. 5, 921-934
Fung T. and Siu, W., 2000. Environmental quality and its changes, an analysis using NDVI. International Journal of Remote Sensing, 21(5), 1011–1024.
Gao, B. C. (1996). NDWI—a normalized difference water index for remote sensing of vegetation liquid water from space. Remote Sensing of Environment, 58, 257–266.
ISPRS Archives XXXVIII- 8/W20; Workshop Proceedings: Earth Observation for Terrestrial Ecosystems New West: A case study from Greater Yellowstone. Bioscience,
52, 151−162.
Hayes, D., & Sader, S. A. (2001).Change detection techniques for monitoring forest clearing and regrowth in a tropical moist forest. Photogrammetric Engineering and Remote Sensing, 67 (9) Janetos, A. C. and Justice, C. O., 2000. Land cover global productivity: a measurement strategy for the NASA programme.int.j.remote sensing, 2000, Vol.21, no.6&7, 1491-1512
Jantz, C. A., Goetz, S. J., & Shelley,M. A. (2003). Using the SLEUTH urban growth model to simulate the land use impacts of policy scenarios in the Baltimore–Washington metropolitan region. Environment and Planning (B), 31(2), 251−271.
Jensen, J. R. (1996). Introductory digital image processing: A remote sensing perspective.Upper Saddle River, New Jersey: Prentice-Hall.
Jiang, X.; Wan, L.; Du, Q., and Hu, B.X., 2008. Estimation of NDVI images using geostatistical methods. Earth Science Frontiers, 15(4), 71–80.
Margules CR, Pressey RL (2000) Systematic conservation planning. Nature 405(6783):243–253
Myneni, R. B., & Asrar, G. (1994). Atmospheric effects and spectral vegetation indices. Remote Sensing of Environment, 47, 390– 402.
Parmenter, A. P., Hansen, A., Kennedy, R., Cohen, W., Langner, U., Lawrence, R., et al.(2003). Land use and land cover change in the Greater Yellowstone Ecosystem:1975–95. Ecological Applications, 13, 687−703
Paruelo JM, Pin˜eiro G, Oyonarte C, Alcaraz-Segura D, Cabello J,Escribano P (2005) Temporal and spatial patterns of ecosystem functioning in protected arid areas of Southeastern Spain.Applied Vegetation Science 8(1):93–102
Sader, S. A., & Winne, J. C. (1992). RGB-NDVI colour composites for visualizing forest change dynamics. International Journal of Remote Sensing, 13, 3055– 3067.
Walters C (1986) Adaptive management of renewable resources. Macmillan, New York
Wang, J.; Price, K.P., and Rich, P.M., 2001. Spatial patterns of NDVI in response to recipitation and temperature in the central Great Plains. International Journal of Remote Sensing, 22(18), 3827–3844.
Wang, Y., & Moskovits, D. K. (2001). Tracking fragmentation of natural communities andchanges in land cover: Applications of Landsat data for conservation in an urban landscape (Chicago Wilderness). Conservation Biology, 15(4), 835−843.
Welch, R., Madden, M., & Jordan, T. (2002). Photogrammetric and GIS techniques for thedevelopment of vegetation database of mountainous areas: Great Smoky Mountains National Park. ISPRS Journal of Photogrammetry and Remote Sensing, 55, 53−68.
Weng, Q.; Lu, D., and Schubring, J., 2004. Estimation of land surface temperature–vegetation abundance relationship for urban heat island studies. Remote Sensing of Environment, 89, 467– 483.