T
H E
G
O V E R N A N C E
O F
L
A R G E
E
C O S Y S T E M S
A T
T H E
R
E G I O N A L
S
C A L E
A n A n a l y s i s o f t h e S t r a t e g i e s a n d O u t c o m e s o f L o n g - Te r m P r o g r a m s
STEMS • ECOSY
STEMS • ECOSY
STEMS • ECOSY
STEMS • ECOSY
STEMS • ECOSY
STEMS • ECOSY
STEMS • ECOSY
T
HE
G
OVERNANCE
OF
C
OASTAL
E
COSYSTEMS
AT
THE
R
EGIONAL
S
CALE
An Analysis of the Strategies and Outcomes of Long-Term Programs
By
Stephen Bloye Olsen and Donna Nickerson
December 2003
Coastal Management Report #2243
ISBN #1-885454-51-1
Citation: Olsen, S.B. and D. Nickerson. 2003. The Governance of Coastal Ecosystems at the Regional Scale: An Analysis of the Strategies and Outcomes of Long-Term Programs. Coastal Management Report #2243. ISBN #1-885454-51-1. University of Rhode Island Coastal Resources Center. Narragansett, RI.
This publication was made possible through support provided by the U.S. Agency for International Development’s Office of Environment and Natural Resources Bureau for Economic Growth, Agriculture and
T
he Governance of Coastal Ecosystems at the Regional Scale:
An Analysis of the Strategies and Outcomes of Long-Term Programs
Stephen Bloye Olsen
and
Donna J. Nickerson
1. Introduction
As human activities change the features and the functioning of ecosystems at scales that range from the neighborhood wetland to the planet, the purposes, governing principles, rules and values that determine how natural resources and environments are used, conserved and restored become increasingly important. These are the functions of governance. Nowhere are the issues and conflicts more intense than along coastlines that contain today nearly half of the world’s people on 15 percent of the inhabited landspace.
During the 1960s, when concerns over the losses in environmental quality were dominant in many nations and within the international community, coastal regions emerged as a focal point. In the U.S., the Stratton Commission (1969) argued for a “new approach” to planning and decisionmaking in the “coastal zone.” This gave rise, three years later, to the federal Coastal Zone Management Act, legislation that at the time was seen as one element of a much more ambitious effort in land use reform
(Bosselman and Callies, 1972). In the U.S., the formulation of coastal zone management programs at the state level was accompa-nied by other pioneering attempts to address the over-development and misuse of such important aquatic systems as the Chesapeake Bay and the Great Lakes. In other parts of the world, similar ecosystem management efforts at the regional scale were also
underway in Australia and Europe. Two decades later, these pioneering programs provide rich experience in approaches to coastal management that integrate across sectors (agriculture, fisheries, tourism) and across administrative (municipal, state, national) boundaries.
The 1992 United Nations (U.N.) Conference on the Environment and Development in Rio de Janeiro, Brazil endorsed integrated coastal management (ICM) as the recommended approach to planning and decisionmaking for marine and coastal areas. By 2000, more than 345 ICM projects and programs were underway in 95 nations and semi-sovereign states (Sorensen, 2000). A decade later, at the U.N. World Summit on Sustainable Development in Johannesburg, South Africa, the importance of linking management actions in watersheds to the management of estuaries and nearshore waters again were re-emphasized. The
Johannesburg Conference also reaffirmed that the solutions to the complex problems of coastal regions lie in adaptive and ecosys-tem-based management.
The large investments in coastal management, the continuing rapid degradation of coastal qualities in many regions, and the difficulties in sustaining promising initiatives have prompted the authors to examine the evolution of successful initiatives at regional scales that have operated continuously for at least two decades. Three initiatives were selected that share the following characteristics:
• They have adopted an approach to planning and decisionmaking that is rooted in discovering how the region functions and responds to human actions as an ecosystem
• They have evolved as formally-established programs with the authorities and resources required to implement a plan of action designed to maintain or restore ecosystem qualities
• They are mature programs that have proceeded beyond issue analysis and planning and through at least two phases of program implementation
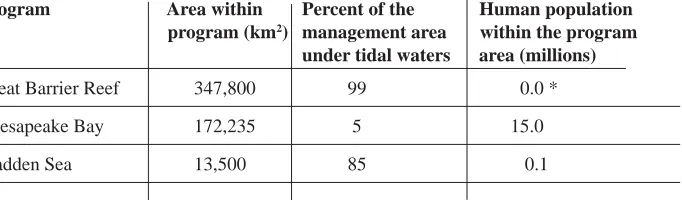
• They encompass areas of coastal waters and adjoining lands in the range of 10,000 to 500,000 square kilometers (See Table 1.)
• They contain a diversity of human activities requiring policies and actions that address needs for both conservation and development
4 Table 1: Basic Characteristics of the Three Program Areas
*The islands within the Great Barrier Reef Marine Park are uninhabited. The terrestrial “impact zone” of the Great Barrier Reef extends over 370,000 km2 and contains a population of approximately 0.7 million people (Lawrence et al., 2002). These inhabited land areas are not under the jurisdiction of the Marine Park.
In reviewing these program areas, we sought answers to the following questions: • What expressions of coastal ecosystem change have been addressed?
• Is a learning-based, adaptive approach to management being applied? How have the program’s agendas evolved over time?
• What institutional arrangements and governance processes are proving effective? • What factors appear most critical to sustaining such programs over the decades?
• What environmental and societal outcomes can be attributed to the efforts of each program?
Our enquiry has been inspired by our own experiences in the design and implementation of coastal management efforts in the U.S. and several low-income nations, and by the large marine ecosystem (LME) management efforts underway in several regions. (See Sherman and Duda, 1999.) The management of large coastal ecosystems—comprised of estuaries, inshore shallow waters and their associated watersheds—and the management of LMEs are both expressions of a movement that substituted managing indi-vidual sectors with an integrating approach directed at sustaining of the productive potential for ecosystem goods and services. (See Table 2.) In ecosystem-based management, the associated human population and economic/social systems are seen as integral parts of the ecosystem. Most importantly, ecosystem-based management is concerned with the processes of change within living systems. Ecosystem management is therefore designed and executed as an adaptive, learning-based process that applies the principles of the scientific method to the processes of management.
Table 2: Ecosystem Management as a Paradigm Shift
From To
Individual species Ecosystems
Small spatial scale Multiple scales
Short-term perspective Long-term perspective
Humans independent of ecosystems Humans as integral parts of ecosystems
Management divorced from research Adaptive management
Managing commodities Sustained production potential for ecosystem goods and services
From: Lubchenco (1994) in Sherman and Duda (1999)
There are, however, important differences in the defining characteristics of coastal ecosystems and the challenges of their management that distinguish these efforts from similarly motivated efforts in LMEs. In LMEs, the primary focus is upon one issue—the management of fisheries. The management of large coastal ecosystems, in contrast, addresses the multiple expressions of human activity as they affect watersheds, estuaries and inshore marine waters. In coastal regions, threats to populations of fish and shellfish are only one of several overlapping challenges. Furthermore, in coastal ecosystems the existing governance fabric is more complex and entrenched, and the number of competing user groups is typically larger. The applications of adaptive,
large-Program Area within Percent of the Human population program (km2) management area within the program
under tidal waters area (millions)
Great Barrier Reef 347,800 99 0.0 *
Chesapeake Bay 172,235 5 15.0
scale ecosystem management in marine and coastal systems, nonetheless, have much in common and much to learn from each other. LMEs, and the coastal ecosystems that are the focus of this analysis, are elements of the same closely interconnected living systems. Ultimately, the management of both must be fused into mutually supporting nested systems of governance.
In this paper we use the terms “governance” and “management.” The differences between the two are significant. Manage-ment is the process by which human and material resources are harnessed to achieve a known goal within a known institutional structure. We therefore speak of business management, or town management, or even conflict management. Governance, on the other hand, sets the stage in which management occurs by defining—or redefining—the fundamental objectives, policies, laws and institutions by which societal issues are addressed. Governance is by no means only the purview of governments. In many settings, the role of government in the governance of a coastal ecosystem is small
2. Evaluative Methods
The adaptive management of human-dominated ecosystems is a complex business that must be sustained over many decades to achieve outcomes that are typically expressed as (1) healthy, productive ecosystems and (2) an acceptable quality of life for their associated human population. Simple analytical frameworks have been developed (Olsen et al., 1998 and Olsen, 2003) that elucidate how the many actions of a sustained governance process can be grouped in a manner than clarifies the sequences and the interdependencies among actions and thresholds of achievement.
Time Scal
e
National
Regional
Source: Adapted from Olsen et al., 1998
Intermediate
The Four Orders of coastal governance outcomes
6
The first framework sorts the outcomes of governance into a sequence of orders that trace the evolution of a coastal gover-nance initiative from initiation to demonstrable change in the condition of that ecosystem. The second framework maps distinct generations of governance. When adaptive management is being practiced, programs evolve through linked cycles of learning with discernible phases of issue analysis, adoption of a course of action, implementation and evaluation of that course of action.
Our framework for grouping the outcomes of a coastal governance initiative is given in Figure 1. It highlights the importance of changes in state (such as the abundance of fish or quality of human life), but recognizes that for each change in state, there are correlated changes in the behavior of key human actors.
First Order outcomes are the societal conditions that must be present when a program embarks upon a plan of action designed to modify the course of events in a coastal ecosystem. Together, they form the “enabling conditions” that are required if coastal management policies, plans and actions are to be successfully implemented. First Order outcomes require building the constituen-cies and the institutional capacity to undertake integrated coastal planning and decisionmaking. First Order outcomes also require securing the authority, funding and other resources that make it feasible to implement policies and actions at the scale of large ecosystems. The setting of unambiguous goals is the final ingredient of the enabling conditions that together set the stage for the successful implementation of an ecosystem management policy and plan of action.
Second Order outcomes are evidence of the successful implementation of a coastal management program. This includes evidence of new forms of collaborative action among institutions, the actions of state-civil society partnerships, and the behavioral changes of resource users. Second Order changes in the behavior of organizations and user groups are the precursors to Third Order socioeconomic and environmental outcomes. These Third Order outcomes mark physical evidence of progress towards sustainable forms of coastal development. The ultimate goal of sustainable forms of coastal development (Fourth Order outcomes) is today an undefined ideal.
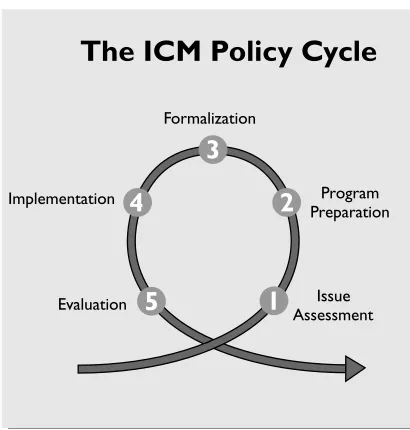
While the Orders of Outcomes framework sorts the results of governance into groupings that acknowledge the sequential linkages between different expressions of societal and environmental change, it does not help trace the process by which a program negotiates and implements the cycles of planning and decisionmaking that can produce such results. The second framework addresses these questions by probing the actions that are associated with the steps of the policy cycle. As described by Torell (2000), the policy cycle framework has its roots in Lasswell’s (1956) approach to making good governance operational by grouping the process by which public policy evolves into a sequence of functional steps. This approach was further developed by others including Brewer (1974) and deLeon (1999). The Joint Group of Experts on the Scientific Aspects of Marine Environmental Protection (GESAMP) (1996) offered a version of the policy cycle as a framework for grouping the activities associated with five steps within a “generation” of coastal management. There are many variations to how the policy cycle model can be adapted to coastal ecosystem management, but the central idea of a multiple-step cycle that progresses from planning, to commitment, to a course of action, to implementation and evaluation remains constant. The policy cycle developed by GESAMP (1996) is shown in Figure 2. Successive generations of a program address an expanding agenda of issues and/or a larger geographic area. As with the Orders of Outcomes framework, the emphasis on the sequencing of groups of actions in the policy cycle does not imply a blueprint that can be imposed on any situation but rather a codification of good practice that builds on the central reality that governance capacity is the primary factor limiting forward progress.
Figure 2. The Coastal Management Policy Cycle
(Adapted from GESAMP, 1996)
The initial completion of the policy cycle at the program scale is termed an initial generation of a coastal management program. Once established, programs that have embraced an adaptive learning-based approach to management periodically re-evaluate their priorities and adjust their institutional structures. Cycles of analysis, planning, implementation and evaluation occur simultaneously at several spatial scales and at times that range from less than a year to a decade. We have, therefore, chosen to consider subsequent “generations” in the evolution of a program as a whole to instances in which:
1. There is a significant change in the issues addressed and/or the spatial scale in which the program operates. 2. There is also a significant restructuring of the institutional design of the program.
Taken together, the two frameworks allow us to analyze the evolution of a program in a manner that can set the stage for comparisons across initiatives undertaken in different locales.
3. Three Case Studies
The Great Barrier Reef Marine Park
Geography of The Great Barrier Reef
The Great Barrier Reef (GBR) is the largest and the most well known coral reef system in the world. The approximately 2,900 individual reefs that comprise this system form a 2,100 kilometers-long barrier off the state of Queensland in northeastern Australia. The individual reefs range in size from less than a hectare to massive structures, the largest of which covers over 300 square kilometers. The Great Barrier Reef contains a variety of habitats and a great number and diversity of species including some 360 species of hard coral, 1,500 species of fish, 22 species of seabirds, 30 species of whales and dolphins, and more than 4,000 species of mollusks. This rich abundance of species, in turn, depends upon a diversity of habitats including meadows of seagrasses, algal beds, mangroves, expanses of sandy bottom, and sponge gardens. The reefs lie between 10 to 150 nautical miles from the mainland. The Marine Park boundary extends from Cape York to Fraser Island, and from the low water mark on the Queensland coast to beyond the edge of the continental shelf, an area of 347,800 square kilometers. The map at right shows the boundaries of the GBR Marine Park as these were defined through its designation as a U.N. World Heritage Area in 1981.
Until the 1960s, the Great Barrier Reef was protected from human impacts because it was well offshore and the human population living on the adjoining coastline was relatively small. The adjoining coast is divided into 26 local government regions that in 2001 contained a population of 0.7 million living in small cities/towns. The population density is lowest in the northern region of the coast where there is no coastal road and access is very limited. The Great Barrier Reef “impact zone” extends over 370,000 square kilometers and contains 22 percent of the land area of Queensland. Sugar cane
8
The Issues that Catalyzed the Creation of the Park
In the early 1960s, Australia’s demands for limestone increased—for agriculture, for the production of cement, and to support greater steel production. The Great Barrier Reef was a potentially massive source of this commodity. In 1967, the government of Queensland received an application for a lease to mine coral limestone from the Ellison Reef. The Wildlife Preservation Society learned about the application and brought it to the public’s attention. Reactions to the proposal from a number of conservation groups and scientists were strong and, after a widely publicized hearing, the application was refused.
In the same period, the growing concern over potential human impacts upon the reef ecosystem were intensified by an outbreak of large populations of crown-of-thorns starfish, Acanthaster planci. During this outbreak, severely affected reefs saw as much as 95 percent of their living corals destroyed. Public debate on the causes of the outbreak and what measures—if any—should be taken to reduce the damage underscored the scale and difficulty of management, the need for research to better understand how the reef functions, and the need for a coordinating body with the mandate to manage the Great Barrier Reef as a whole.
Petroleum companies also had a strong interest in the Great Barrier Reef. The federal government passed legislation in 1969 that authorized states to grant offshore oil exploration permits. The government of Queensland quickly granted rights to prospect for oil fields in the Great Barrier Reef to a consortium of Australian and Japanese oil companies. This too prompted heated arguments that were fueled by the drama of the IXTOC I oil spill catastrophe in the Gulf of Mexico. In 1970, the state of
Queensland and the federal (commonwealth) governments took the unusual step of each appointing a Royal Commission to review the potential impacts of oil drilling on the Great Barrier Reef. The strategy of creating parallel commissions was a response to the uncertainty over whether the state or the federal government had authority over the reef. The two commissions had identical terms of reference and four years later opted to release a single two-volume report. While the commissions concluded that stringently regulated oil drilling could safely proceed in a few areas, a minority report argued that the risks posed by any drilling were unac-ceptable. While the commissions were debating, a moratorium was declared in 1971 and the oil companies that had been granted exploration permits agreed voluntarily to suspend their operations.
The events in the 1960s and early ‘70s convinced a majority of the public—both in Queensland and in Australia as a whole— that the Queensland government would not protect the Great Barrier Reef in any decisions that involved foregoing or significantly restricting economic development. It had become apparent that new national legislation would be needed to resolve the issue of the state’s rights and jurisdiction if the natural qualities of the Great Barrier Reef were to be conserved.
The 1972 federal election brought the Labor Party to power. This was a liberal government with a policy agenda quite different from the one of the previous Conservative government. In the election, the Labor Party had argued that the entire Great Barrier Reef should be designated as a marine park. In response to the conclusions being reached by the international Law of the Sea Conferences, the new federal administration enacted the Seas and Submerged Lands Act in 1973. This Act declared that the states’ jurisdiction extended no further than the low water mark. The Act was immediately challenged by the states and the argu-ments dragged on for several years. In the third year of the Labor Party administration, the Great Barrier Reef Marine Park Act was approved. The challenge for those drafting the legislation was to accommodate the conflicting jurisdictional claims of the federal government and Queensland. The drafters worked to provide for the management of the Great Barrier Reef region as a whole— assigning to the central government, jurisdiction over both subtidal areas and the marine waters, and assigning to the state, jurisdic-tion over the intertidal areas along the mainland and the islands offshore. The Marine Park Act created the GBR Marine Park Authority as a federal-state partnership. The Authority, not the legislation, would define what areas would be included within the Marine Park. The legislation defined the Authority’s goal as:
“(T)o provide for the protection, wise use, understanding and enjoyment of the Great Barrier Reef in perpetuity through the care and development of the Great Barrier Reef Marine Park. “
The GBR Marine Park Act was unusual for its time in that it placed a strong emphasis on the involvement of the public. The Act called specifically:
• To involve the community meaningfully in the care and development of the Marine Park
• To achieve the management of the Marine Park primarily through the community’s commitment to the protection of the Great Barrier Reef and its understanding and acceptance of the provisions of zoning, regulations and management practices
The Act also instructed the Authority “to adapt its operations to changing circumstances.”
The Act gave no indication of the proportion of the Great Barrier Reef region that might eventually become incorporated within the Marine Park. It merely required that portions of the park be zoned and that such zoning plans be guided by the following objectives:
“(a) the conservation of the Great Barrier Reef;
(b) the regulation of the use of the Great Barrier Reef Region so as to protect the Great Barrier Reef while allowing reasonable use of the Great Barrier Reef;
(c) the regulation of activities that exploit the resources of the Great Barrier Reef Region so as to minimize the effect of those activities on the Great Barrier Reef;
(d) the reservation of some areas of the Great Barrier Reef for its appreciation and enjoyment by the public; and
The 1975 Act was one of the first pieces of legislation to embrace the concept of sustainable development—defined as “conservation while allowing reasonable use.” This became a major source of conflict and argument in the first generation of the program. The Act obliges all interest groups to justify proposed activities as consistent with the objective of environmental sustainability. The eventual translation of this concept into operational procedures and zoning schemes is a hallmark of the program’s success.
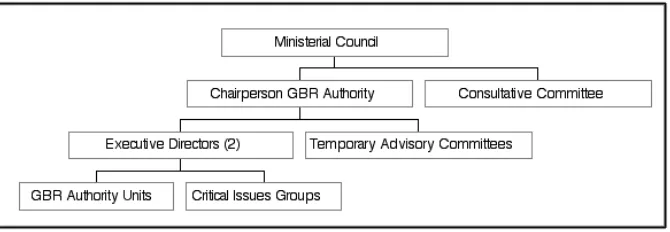
In addition to the three-person Marine Park Authority, the Act created a Consultative Committee comprising a diverse range of stakeholders. Both the Authority and the Committee report directly to the federal Minister of the Environment. The Act is designed to engender a collaborative partnership that draws together authorities at both the federal and the state level. While the chairman of the Authority is selected by the federal government, one member is nominated by the state of Queensland. A third of the members of the Consultative Committee are nominated by the state. The chairperson has a five-year term, while the part-time members serve for three. A staff of approximately 170 supports the Authority. The Authority makes recommendations to the federal Minister of the Environment on the care and development of the Marine Park, on the areas to be declared as within the park, and on the regulations necessary to achieve the Act’s objectives. The Authority is also charged with preparing zoning plans, undertaking and supporting research, providing educational, advisory and information services, and developing a system for managing an ecosystem that extends across federal and state jurisdictional boundaries.
Figure 3: The Great Barrier Reef Marine Park Administrative Structure
The First Generation of Governance
The first generation of the GBR Marine Park extends from the 1960s debates, through to the enactment of the Great Barrier Reef Marine Park Act and to the preparation and initial implementation of a zoning plan for the Capricornia Section, a 12,000 square kilometer area in the Great Barrier Reef’s southern region. The first generation was concerned primarily with consolidating the enabling conditions that comprise First Order outcomes. During this period, the Authority focused upon three interrelated activities:
• Assembling information on the Great Barrier Reef ecosystem, its resources, and the activities it supports • Developing approaches to planning and to management
• Determining the number, extent, and sequence of the sections of the reef that should be recommended as lying within the park
Overshadowing these activities were the tensions between strongly opposing views on the balance of power between the federal government and the state of Queensland. Both the GBR Marine Park Act and the National Parks and Wildlife Conservation Act, adopted by the Labor government in1975, were viewed by many as an assault on the powers and prerogatives of the states. Furthermore, although the Act specifically prohibited mining, it had left open the possibility of oil exploration in areas that were not declared part of the Marine Park. The consolidation of the management arrangements required substantial behind-the-scenes work by the three members of the Authority with the twelve Cabinet ministers at the federal level and those leading comparable agencies in the State of Queensland.
During this initial period, the Authority developed the criteria that would guide decisions on areas that should be included and excluded within the Marine Park. The guiding criteria were defined as 1) the interdependence of the ecosystems and 2) the
vulnerability of these ecosystems to impacts from human use of adjacent areas. A careful review of existing information on the Great Barrier Reef showed that the transport of nutrients, food, and larval recruits occurred over long distances through the move-ment of water currents. This reinforced the conclusion that the entire region functions as an interconnected ecosystem. The Authority also concluded that Marine Park sections should be defined such that they protected areas of high biological value and provided buffer zones in which the impacts of external human activities could be regulated and absorbed. These findings reinforced the conclusion that the park boundaries should be very large.
10
Since it lies 25 kilometers from the coast, it was outside the contentious areas of overlapping state and federal jurisdictions. The Authority designed the planning process as a model for collaborative planning and decisionmaking. It appointed a Zoning Strategy Working Group that included officers from the several interested Queensland agencies and several members of the Consultative Committee. The Working Group was instructed to develop three distinct zoning plans, each of which would meet the requirements of the GBR Marine Park Act but would maximize the objectives of one of the three major user groups—fishing, tourism and conservation. At the time, these groups saw themselves in competition—if not in conflict—over the same resources. Each plan identified the constraints and opportunities facing each group based on a solid understanding of the resources and processes in the area. This approach eventually produced a single map that identified the major areas of conflict. This, in turn, became the basis for negotiating a final integrated plan. The result was uncontroversial and was formally adopted in 1979.
The successful negotiation of a zoning plan for an initial segment of the Marine Park was only one important development in 1979. That same year, the federal government—after considering the recommendations of the two Royal Commissions—decided that it would not permit any oil exploration in the Great Barrier Reef region. This ended years of acrimonious debate. The continu-ing arguments between the federal and state government over control of development in the three-mile territorial sea and along the shoreline led to establishment of a Ministerial Council. This council is composed of two ministers from each government who jointly consider the proposals developed by the Authority. This provides a means for coordinating federal and state decisions affecting the Great Barrier Reef. It is the cornerstone of what became known as the Emerald Agreement, named after the hotel in which the Australian prime minister and the governor of Queensland made a non-binding “gentleman’s agreement” to collaborate on the implementation of the GBR Marine Park Act. The agreement assigned the day-to-day management of the Marine Park to the Queensland National Parks and Wildlife Service and not to a federal agency. The operating costs of the Marine Park would be shared equally by the state and federal governments. The Ministerial Council became the vehicle for resolving disputes. While the agreement has no legal status, it remains intact today as the basis for collaboration between the two levels of government. The Queensland legislature subsequently developed its own complementary Marine Park legislation.
The chairman of the Authority from 1976 through 1994 was Graeme Kelleher. In a paper published in 1996 (Kelleher, 1996), Kelleher reflected on the challenges of managing the Great Barrier Reef during its first generation. In his view, the major conclu-sion within the Authority was the recognition that the Great Barrier Reef functions as an interconnected ecosystem. Its manage-ment, they concluded, could not be based on zoning plans for selected sections of the region. During the first generation, various agencies with responsibilities for the Great Barrier Reef had pursued sectoral agendas, and this not infrequently brought conflict. There was an urgent need for a common set of specific targets against which all management actions could be assessed.
By the early 1980s, the success of the Capricornia Section Plan and the Emerald Agreement had generated within the state and federal government agencies involved a willingness to work together. Agencies and the stakeholder groups had come to recognize that the setting of common targets was desirable. The First Order enabling conditions for sustained ecosystem manage-ment had been assembled.
The Second Generation of Governance
The foundation of the second generation of Great Barrier Reef governance lies in its designation as a U.N. World Heritage Area in 1981. This designation was initiated by the federal government and was seen as a way to obtain international recognition and support for the Great Barrier Reef and its management. The designation commits the federal and Queensland governments to financial obligations, to strict management guidelines and to external evaluations. The World Heritage designation extends from the low water mark of the Queensland mainland to the seaward boundaries of the Great Barrier Reef region as defined in the 1975 Marine Park Act. Included are all the islands and internal waters under the jurisdiction of Queensland. While the designation of the Great Barrier Reef as a World Heritage Area set the stage for more comprehensive ecosystem management, it took more than a decade for the second generation of the program to get underway. In that period, the Authority continued to develop and refine zoning plans for the four sections into which the Great Barrier Reef region had been divided. These plans consolidated the partici-patory and adaptive form of management that had been modeled in the Capricornia Section.
After several internal and external reviews, the Authority decided in 1987 to adopt a new management structure that was put in place in 1989. It re-organized all activities within four Critical Issues Groups. The Authority expended much effort in designing a matrix-based organizational structure and a senior management team with a director and advisory groups composed of representa-tives of the stakeholders with interests in each issue. The Critical Issues Groups were:
• Tourism and Recreation
• Conservation, Biodiversity and World Heritage • Fisheries
• Water Quality and Coastal Development
The Strategic Plan has adopted a “representative areas” approach that shifts the focus of the program from individual species and specific habitats to the identification and protection of representative examples of the diversity of habitats and processes. Each representative area includes “no-take” zones that serve as ecological benchmarks where evolutionary processes proceed undisturbed and natural disturbances are permitted to play out without interference. The “no-take” zones are sanctuaries for marine populations and help maintain genetic, habitat and ecological diversity, and they provide for undisturbed species and population interactions. The size and level of protection afforded by the representative areas create a network designed to allow sufficient levels of connec-tivity between populations, species and habitats. The Authority is currently rezoning the park to identify and delineate the represen-tative examples of habitat.
The Authority has recently concluded that the long-term health of the nearshore region is under threat. An interagency group has completed a Water Quality Action Plan that sets quantitative targets for the year 2011 and identifies specific actions to be taken to achieve those goals. The Authority has also retooled its structures for public consultation. It has established a series of Local Marine Advisory Committees from within regional coastal communities. These committees (previously called Regional Marine Advisory Committees) provide the Authority with a local perspective on problems and opportunities. Each year, the committee chairs meet together with Authority staff to discuss issues and achievements.
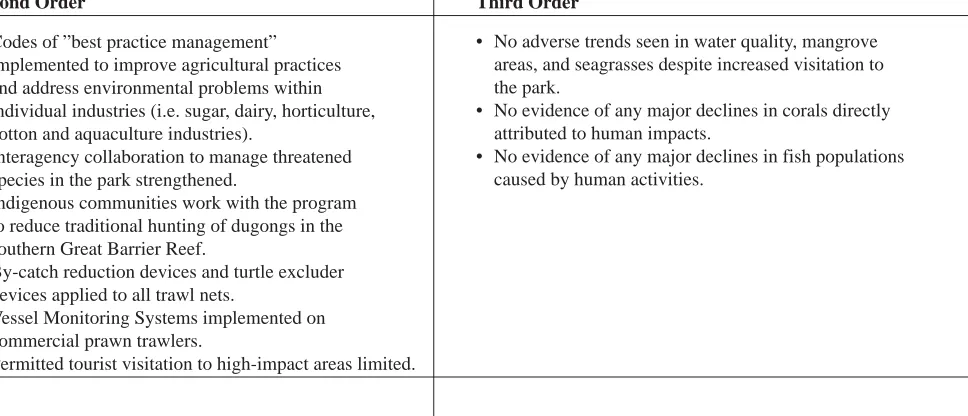
Table 3 shows some of the more notable examples of Second and Third Order outcomes. The Third Order accomplishments have been to halt the decline of important habitats and species. This signals that the impacts from a continued increase in park visitation are being successfully controlled.
Table 3: Second Order Behavioral Change and Third Order Ecosystem Quality Outcomes Associated with the Second Generation of the GBR Marine Park
Second Order Third Order
The Chesapeake Bay Program
Geography of the Chesapeake Bay
The Chesapeake Bay is the United State’s largest and most biologically productive estuary. The Chesapeake lies along the nation’s eastern seaboard and its watershed includes all or portions of six states (Delaware, Maryland, New York, Pennsylvania, Virginia, and West Virginia) and the District of Columbia, the administrative unit that contains the nation’s capitol—Washington, D.C. The Chesapeake Bay is the drowned river valley of the Susquehanna River that today enters the bay some 300 kilometers north of its present outlet into the Atlantic Ocean. The two salient characteristics of the Chesapeake are its shallowness—the average depth is seven meters—and its very large watershed. This shallowness creates conditions where sunlight can penetrate to the bottom, allowing for the growth of seagrasses and abundant bottom-dwelling communities. Historically, these have included extensive oyster reefs that supported a large and lucrative fishery until the combined effects of over-harvesting and habitat degrada-tion set in modegrada-tion a rapid decline in the first half of the twentieth century. The Chesapeake is also renowned for its blue crabs and contains more than 90 percent of the spawning habitat of the striped bass (also known as rockfish) that migrates along the Atlantic coast where it supports important sport and commercial fisheries. The value of the fisheries that are dependent on the bay are exceeded by the values of bay-front property and the immense recreational investments that serve the local population and are the basis of a major tourism industry.
• Codes of ”best practice management” implemented to improve agricultural practices and address environmental problems within individual industries (i.e. sugar, dairy, horticulture, cotton and aquaculture industries).
• Interagency collaboration to manage threatened species in the park strengthened.
• Indigenous communities work with the program to reduce traditional hunting of dugongs in the southern Great Barrier Reef.
• By-catch reduction devices and turtle excluder devices applied to all trawl nets.
• Vessel Monitoring Systems implemented on commercial prawn trawlers.
• Permitted tourist visitation to high-impact areas limited.
• No adverse trends seen in water quality, mangrove areas, and seagrasses despite increased visitation to the park.
• No evidence of any major declines in corals directly attributed to human impacts.
12 The Chesapeake Bay’s watershed
extends over some 172,000 square kilometers. Since the area of the bay is 6,475 square kilometers, this creates a watershed-to-estuary ratio of 2700:1. This is 10 times more than the next largest watershed-to-estuary ratio, which is held by the Bay of Bothnia in the Baltic Sea at 327:1. Most of the Chesapeake’s water-shed is forest and agricultural land and contains some of the highest concentrations of livestock and intensive cropping in the U.S. It supports a population of about 15 million people—most living in the two major metropolitan centers (Baltimore, MD and Washington, D.C.) along the bay’s shoreline and its tidal rivers. Management of the bay requires addressing the many sources of nutrients and pollutants that flow from this intensively used and densely inhabited region.
The Governance Initiative
By the 1950s, this heavily used bay began to show signs of severe ecosystem stress. By 1970, significant losses in
fishery resources, the disappearance of seagrasses, and the decline in oyster harvests all appeared to be linked to the very visible impacts of water pollution. It had been assumed that the construction of sewage treatment plants would solve these problems. Instead, the classic evidence of euthrophic conditions was becoming more prevalent each summer. In 1972, Hurricane Agnes brought record amounts of nutrients and sediments into the Chesapeake and demonstrated how weakened the bay systems had become.
Senator Charles Mathias, an influential and respected senator from Maryland, led a group of legislators from the bay region in bringing the sad condition of the nation’s largest estuary to the attention of Congress. In 1974, Congress responded by providing $27 million to the U.S. Environmental Protection Agency (EPA) to undertake a five-year study of the Chesapeake. There was strong disagreement within the scientific community over the causes of the bay’s problems. Thermal pollution, toxics, oil spills, dredging and nutrients all had their advocates. The nutrients issue was complicated by the recognition that while phosphorus is the limiting nutrient in freshwater ecosystems, nitrogen plays this role in marine ecosystems. In estuaries, both can play an important role.
The First Generation of Governance: Defining the Issues and Setting Initial Goals
The initial findings of the expensive and lengthy scientific studies were sometimes controversial and were seen, within the scientific community, as inconclusive. The scientists who had been funded to undertake a great variety of studies on the Chesapeake could not agree on what practical steps should be taken to address the problems. In response to palpable frustration among the public, the EPA decided in 1981 to create a task force, the Resource Users Management Team (RUMT), to review the research findings and develop management recommendations. The RUMT’s 28 members represented the major bay user groups: seven from agriculture, six from industry, seven from commercial fishing, seven from environmental advocacy and one representing recreational interests. The committee was given a limited time frame to develop its recommendations. It succeeded in crystallizing the issues and recommended that the program focus its efforts upon nutrient over-enrichment, pollution by toxics and the dwindling abundance of seagrasses. It concluded that these issues were the root causes behind the declines in water quality and the bay’s populations of fish, shellfish and other wildlife. The program’s early decision to bring in the public, through the RUMT, to interpret the scientific results and make policy choices was essential in turning around the image of the project from that of a well-funded research effort to a practical restoration effort that recognized that the future was in the hands of the bay’s stakeholders.
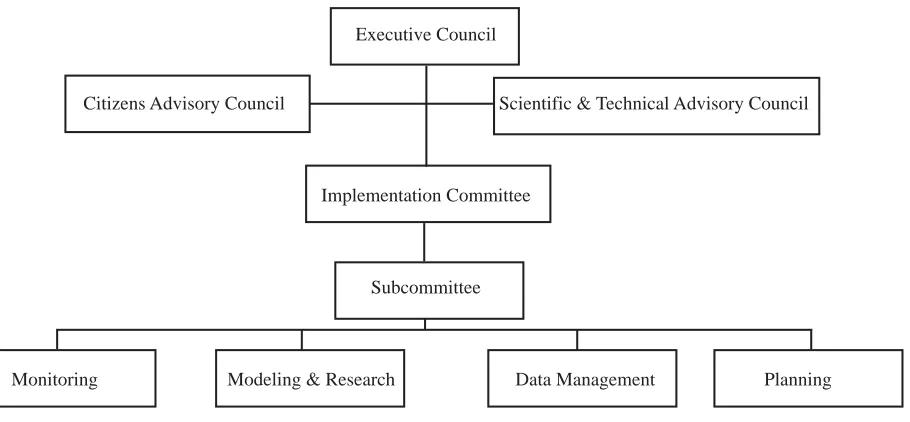
Spurred on by the intensity of public concern, the governors of the states bordering the bay and the administrator of the EPA came together in 1983 to sign the first Chesapeake Bay Agreement. This committed the parties to collaborative action, to coordinate their efforts to reduce pollution and to participate in a joint monitoring program. The 1983 agreement marked the transition from a temporary project to a formalized and more permanent structure with an Executive Council, Implementation Committee, Scientific Advisory Committee and Citizens Advisory Committee. (See Figure 4.) Through this management structure, the program devel-oped the first management plan in 1985. That plan addressed the three priority issues identified by the RUMT two years before.
The Chesapeake Bay Program’s accomplishments during its first generation included (1) identifying the priority issues; (2) bringing stakeholders into the planning and decisionmaking process; (3) establishing a program management structure; and (4) negotiating specific commitments from the program’s principal partners on how they would contribute to the program’s goals. These accomplishments were interlinked and attributable largely to the bay program’s success in bringing a responsible interpreta-tion of the available science to the public and winning the public’s support for its goals.
Figure 4. Management Structure Established in the 1983 Chesapeake Agreement
In 1987, the governors of the three states that border on the bay joined the administrators of the EPA to sign a much more specific plan of action referred to as the second Chesapeake Bay Agreement. This set forth a comprehensive set of 29 commitments organized under six issues:
• Living resources • Water quality
• Population growth and development • Public education
• Public access to the bay • Governance
By 1987 the program had come to recognize that the best ultimate measures for the recovery of the Chesapeake are the productivity, diversity and abundance of its living resources. These are the outcomes that the public cares about and they became the focal point for the increasingly comprehensive goals that the program has set for itself. There also was agreement that the key to achieving the bay’s recovery was to reduce the nitrogen loadings in the more saline reaches of the estuary. The scientific commu-nity, however, could not agree on a target for nitrogen removal. This made it difficult to negotiate agreements on the levels of funding that would be needed to bring about the desired recovery. In the end, the Executive Council itself, after considering the evidence, set a goal. The three governors committed the program to achieving a 40 percent reduction in nitrogen loadings by the year 2000, using 1985 as the base year. The second Chesapeake Bay Agreement led to the adoption of more specific goals. For example, seagrass beds would be increased from 140 square kilometers in 1984 to 460 square kilometers by 2004. More than 2,100 kilometers of streams would be opened up to anadramous fish by 2005, and toxic releases from federal facilities would be reduced by 75 percent by 2000. These quantitative and time-limited goals proved essential in negotiating the funds and other commitments from the many agencies and user groups. The 1987 agreement became the model for the unambiguous goals that have been the keystone of the program’s approach to ecosystem governance ever since.
Executive Council
Citizens Advisory Council Scientific & Technical Advisory Council
Implementation Committee
Subcommittee
14
The Second Generation of Governance
The expansion of the identified issues and the establishment of the 1987 agreement marked the beginning of the second generation of the Chesapeake Bay Program. The management structure under this new pact was substantially changed. A Local Governments Advisory Committee was added in 1988 to bring technical support to local governments, and to bring local govern-ment perspectives on policy developgovern-ment to the program.
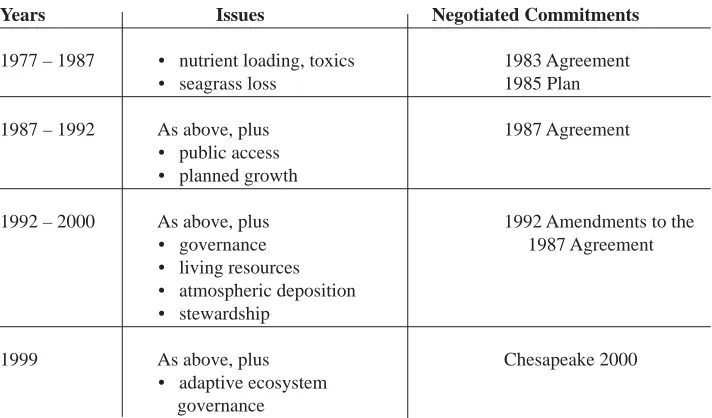
The second generation of the Chesapeake Bay Program is marked by a sequence of adaptations to an increasingly sophisti-cated understanding of how the bay functions and responds to human pressures. (See Table 4.) This learning has crystallized around a sequence of agreements, negotiated among the members of the Executive Council, that draw from the work and recommendations of an increasingly complex supporting structure of committees to set new goals and to expand the reach of the program’s actions. For example, by 1992 it had become evident that not less than one-third of the nitrogen loadings was coming from non-point sources—not from the more tractable point sources, as had been previously assumed. This required a major initiative to work with the region’s farmers to reduce their application of fertilizers and to re-establish vegetated buffers along the many tributaries that flow into the Chesapeake. In the 1992 amendments to the 1987 Chesapeake Bay Agreement, the Executive Council called for the allocation of specific loads to each of the 10 major tributary systems, and for the development—with wide public participation—of the strategies that would demonstrate how each tributary would achieve a 40 percent reduction by 2000 and sustain those nitrogen levels thereafter. The program worked to draw in the participation of other states within the watershed that do not front on the bay itself. These are West Virginia, Pennsylvania and New York. New research has further demonstrated that the atmosphere was also a major source of nutrients and this required consideration of an even larger “airshed” that extends into the nation’s industrial midwest.
Chesapeake 2000, signed in 1999, is the most recent statement of the program’s goals. It is the result of the program setting increasingly more ambitious targets as it has learned more about the issues. While the 1987 Bay Agreement set the first quantitative target for nitrogen only, Chesapeake 2000 sets a more stringent target for nitrogen while also setting targets with timeframes for achievements on all the issues. As with previous Chesapeake Bay Agreements and Plans, the scientists, government officials and conservation leaders all played a role in the development of Chesapeake 2000. The process also included considerable public input and review.
The Executive Council’s 1987 goal of reducing nitrogen loadings to the bay by 2000 was not met—even though major reductions were achieved. In an average year, nitrogen loadings were reduced from about 310 million pounds to 270 million pounds. However, the discovery that a major portion of the bay’s nitrogen loading comes from the atmosphere, in addition to a continued increase in loadings generated from non-point sources by a growing population, prevented the program from reaching its goal. Those involved in the program point out that the existence of the goal nonetheless served the program well and succeeded in focusing efforts on the most critical problem during an important time in the program’s evolution. Other program goals were met, and in some cases exceeded. (See Table 5.) Goals provide a yardstick to measure progress and provide a degree of accountability and transparency that is seldom present in similar governmental programs. The program has found that the public is willing to accept a shortfall when it can see that major efforts have been made by all concerned. In such situations, the public understands that the best response is to make even greater efforts. The setting and periodic adjustments of quantitative, time-limited goals for the qualities of the bay that the people understand and care about has become the heart of the Chesapeake Bay Program. This feature distinguishes it from the other cases reviewed in this document.
Table 4: The Chesapeake Bay Program’s Incremental Approach to Ecosystem Management. Each Agreement Added New Issues to the Program’s Agenda
Years Issues Negotiated Commitments
1977 – 1987 • nutrient loading, toxics 1983 Agreement
• seagrass loss 1985 Plan
1987 – 1992 As above, plus 1987 Agreement
• public access • planned growth
1992 – 2000 As above, plus 1992 Amendments to the
• governance 1987 Agreement
• living resources • atmospheric deposition • stewardship
1999 As above, plus Chesapeake 2000
• adaptive ecosystem
Table 5: Third Order Ecosystem Outcomes Associated with the Second Generation of the Chesapeake Bay Program
Third Order
Increases in:
Miles of bay tributaries for fish spawning habitat
In 2002, 65 miles of historic spawning habitat were reopened to migratory fish. Total miles made available to migratory fish since 1988 is 914 with an additional 138 miles made available to resident fish.
Restored streamside forests
By 1999, 476 miles of streamside forests were restored.
Aquatic reef habitat
By 1998, 11,000 acres of bay bottom were designated as aquatic reef habitat.
Density of seagrass beds
Very dense beds account for 52 percent of bay grasses in 2001, compared to 36 percent in 1984.
Significant declines in :
• Phosphorous loads delivered to the bay were reduced by six million pounds/year between 1985 and 1998.
• Nitrogen loads have been reduced by 42 million pounds/year on average. • Turbidity had declined by 1998.
• Toxic pollutant loadings have been significantly reduced or eliminated.
The Structure of the Program
Well before the 1974 study, a number of institutions were actively involved in evaluating the condition of the bay and advocating for more effective management. The most important of these was the Chesapeake Bay Foundation, a nonprofit environ-mental group founded in 1966 to protect the bay. By the time the Chesapeake Bay Program was underway in 1978, the Foundation had a membership of some 10,000 and had played an important role in lobbying for the study’s funding. Today, the Foundation has more than 90,000 members. It plays an important role on the Citizens Advisory Committee and has fostered the active involvement of the public in implementation of all Program Agreements.
The Chesapeake Bay Program’s management structure has evolved significantly. The initial management structure during the research and issue identification stage provided for a Policy Advisory Committee that oversaw the program and the activities of committees. Its members included the program director, the chairs of a Technical Advisory Committee and Citizens Advisory Committee, and the EPA regional administrator. The Technical Advisory Committee oversaw the research program.
Following the 1983 agreement, the Policy Advisory Committee was replaced by a higher level Executive Council composed of representatives of the state cabinets of Maryland, Pennsylvania, and Virginia, the administrator of the EPA, and the mayor of the District of Columbia. The 1987 Agreement further elevated the Executive Council so that these states are represented by their governors—the highest elected state official. The highest-level official of the EPA, the administrator, and the chair of the Chesa-peake Bay Commission—a legislative body serving Maryland, Pennsylvania, and Virginia—also became members. The Council has met annually since 1987 and operates through directives, agreements and amendments signed by the Executive Council. It defines the goals and the program’s key management procedures.
16
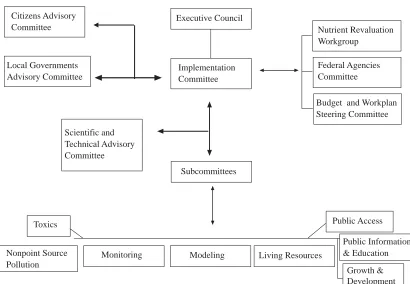
Figure 5. Chesapeake Bay Program Management Structure under the 1987 Agreement.
The Citizens Advisory Committee has 23 members, with representatives from agriculture, business, conservation, industry, and civic groups. Since 1984, this group has provided a non-governmental perspective on the bay cleanup effort and on how bay program policies affect citizens who live and work in the Chesapeake Bay watershed.
The Roles of the Scientific Community and Stakeholder Groups
There have been significant tensions within the scientific community and the program since the research study got underway in 1974. Scientists have been uncomfortable with setting specific goals and have pressed for investments in more research. Yet, scientists are excellent integrators and can provide a level of comfort to the politicians who recognize that setting unambiguous targets is critical to successful governance of a complex system. The scientific community has played an essential role in identify-ing the issues that are most critical to the functionidentify-ing of a healthy estuary and to bridentify-ingidentify-ing new insights into the processes of debate, evaluation and adaptation (Matuszeski, 1996).
The STAC is made up of top scientists drawn from throughout the region and appointed by a variety of means including nominations by the governors and the EPA. The STAC has the authority to augment its membership by selecting as members individuals who can cover otherwise unrepresented disciplines. The STAC establishes peer review systems for all bay program-funded competitive research, reviews and comments on all proposed budget items, holds symposia and carries out technical reviews of key scientific issues. The STAC recently released a report entitled Chesapeake Futures: Choices for the 21st Century
(www.Chesapeake.org/stac). This report sets forth what is achievable and what needs to be done to achieve different scenarios for the bay’s condition and use.
Growth & Development Nutrient Revaluation Workgroup
Federal Agencies Committee
Budget and Workplan Steering Committee
Public Access
Public Information & Education Executive Council
Citizens Advisory Committee
Local Governments Advisory Committee
Implementation Committee
Scientific and Technical Advisory Committee
Subcommittees
Toxics
Modeling Monitoring
Nonpoint Source Pollution
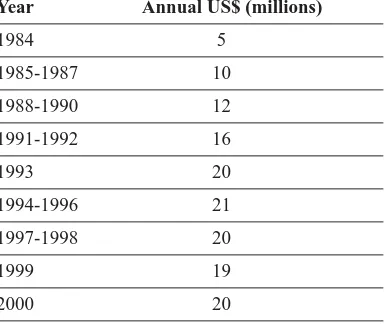
For three decades, the Chesapeake Bay Program has been remarkably successful in generating and sustaining a high level of support for its efforts within the federal government, the leadership and line agencies of the participating states, and at the commu-nity level. The program office operates with an annual budget of $6 million in core funding that covers the costs of maintaining the program’s offices, the salaries of the staff, the production and publication of reports and elements of the public education programs. The EPA has provided the program with the budgets shown in Table 6.
Table 6: EPA Budgets for the Chesapeake Bay Program
Sources:
1) EPA Publications: EPA 903-R-99-014 and CBP/TRS 223/99. July 1999. 2) Slide sheet from “The Chesapeake Bay Program: A Watershed Partnership” dated July 12, 2000.
The program has built on a tradition that requires states that benefit from federal program investments in a given partnership to match those federal dollars with state funds according to a set formula. Other federal agencies currently contribute about $20 million each year to the activities called for by the program. These federal funds are supplemented by approximately $30 million per year in contributions from the states, some of which is match for federal funds (Matuszeski, W., personal communication). This produces a total of approximately $70 million per year in funds that are linked directly to progress towards the program goals.
Much of the program’s popularity can be attributed to its strong public involvement and public education programs. Many of the latter are designed and implemented by the Chesapeake Bay Alliance, a non-governmental organization (NGO). The program has invested heavily in producing attractive and readable reports that feature excellent graphics portraying trends in the condition of the bay and progress towards the program’s goals. The program’s strategy of focusing its efforts on unambiguous agreements signed by top-level elected state representatives and federal government officials has avoided the difficulties that come with negotiating the more usual and all-encompassing and detailed plans. The strategy has been to leave each state the freedom to decide how it will make its commitment to achieving each goal. This, in turn, encourages an atmosphere of competition and empowers local communities, NGOs and a wide diversity of groups and organizations to come forward with their own ideas and commitments.
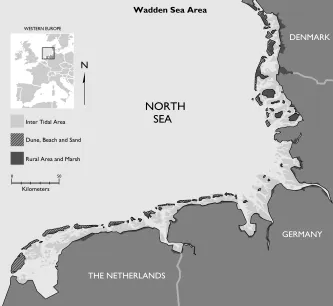
The Wadden Sea Cooperation
Geography of the Wadden Sea
The Wadden Sea is a shallow estuarine ecosystem in the southern reaches of the North Sea, bordering the English Channel to the south. Its coastline extends along the northern coast of the Netherlands, includes all of Germany’s Atlantic coast and a portion of the southern coast of Denmark. Some 50 barrier islands protect this estuarine ecosystem from the harsh North Sea. The Wadden Sea contains the largest expanse of wetlands in northern Europe. Its many riverine estuaries and salt marshes are the basis of its high biological productivity. The Wadden Sea is an important destination for migratory waterfowl and other bird species, a nursery for fish and shellfish, and an important fishing ground. It is also heavily used by commercial shipping and is popular among recreational boaters.
Man has been altering the shoreline and wetlands of the Wadden Sea since the 7th century B.C., when the earliest settlers
erected small mounds to extend and protect small agricultural holdings. By 1000 A.D., the bulk of the original marshlands were surrounded by a comprehensive system of dikes and sluices. Reclamation has continued into the 20th century. Between 1950 and
1990, 160 square kilometers of salt marsh were diked and drained, of which 43 square kilometers were impounded between 1963 and 1990. Today, only 350 square kilometers of salt marsh remain. The only estuary in the Wadden Sea that has not been
Year Annual US$ (millions)
1984 5
1985-1987 10
1988-1990 12
1991-1992 16
1993 20
1994-1996 21
1997-1998 20
1999 19
18 significantly altered is the Varde A in the
northern Danish Sea. Dikes and dams have eliminated brackish water transition zones along much of the coast.
Soon after the Convention on the Conservation of Wetlands was ratified in Ramsar, Iran in 1971, the importance of the Wadden Sea’s marshes led the three nations to independently negotiate “Ramsar” designa-tions for the wetlands under their control. These designations came into force in Germany in 1976, in Denmark in 1978 and in the Netherlands in 1980.
The Governance Initiative
The Trilateral Wadden Sea Cooperation is an international program managed by the three countries bordering the Wadden Sea. Its purpose is to conserve the six habitats that are considered essential to sustaining and restoring the natural qualities of the Wadden Sea. These habitats are: salt marshes, marine tidal areas, beaches and dunes, estuaries, offshore areas and rural areas. The effort extends over some 13,500 square kilometers of coastlands and open water. (See Table 7.)
Table 7: The Wadden Sea Habitats
Offshore zone or “transition zone” 4,000 km2
Beaches and dunes 1,140 km2
Just as with the Great Barrier Reef and the Chesapeake Bay, in the Wadden Sea it was local expressions of growing concern for the deteriorating environmental conditions that catalyzed the creation of a new approach to planning and decisionmaking. Beginning in the 1960s, prominent scientists and NGOs in the region pressed for an international commitment to protect the Wadden Sea. In the 1970s, the process of signing on to the Ramsar Convention required each country to address the issue of embankments and continuing losses of wetlands habitat. Individual national efforts to preserve wetlands, particularly in re-engineering existing dikes, proved to be expensive. Governmental agencies saw that public resources could be saved by coordinat-ing their efforts to fulfill the mandates of the Ramsar Convention (Enemark, 2001). Tycoordinat-ing these factors together was a growcoordinat-ing recognition, first within the scientific community, and then more widely, that the Wadden Sea should be viewed as a single ecosys-tem. As this idea took root, political leaders in the three countries came to recognize that that they could only conserve this large ecosystem if they acted together.
The continuing embankment of wetlands has been the central ‘lynch-pin’ issue for the Wadden Sea Cooperation, since such diking and draining of wetlands most directly affects the productivity of the ecosystem and its value as a habitat. The losses in wetlands were linked in the 1960s to documented declines in populations of breeding birds, fish and shellfish, and deteriorating water quality. It was also noted that the difference between high and low water was increasing and that this greater tidal range was also attributable to the loss of marshlands which formally absorbed large volumes of water at high tide. This effect is exacerbated by sea level rise and the severe storms believed to be caused by the greenhouse effect. The result was that the Wadden Sea coastline was seeing increased erosion and the gradual submersion of the remaining salt marshes and tidal flats.
The First Generation of Governance
In 1978, at the first trilateral Danish-German-Dutch Conference on the Protection of the Wadden Sea, the Wadden Sea Cooperation was established through a non-binding agreement that expressed an initial commitment to “guarantee the natural functioning of the ecosystem through the proper regulation of human activities.” The first generation of the Wadden Sea Coopera-tion extends from the early 1970s through the negotiaCoopera-tion of a non-binding agreement in 1978, and the binding Joint DeclaraCoopera-tion in 1982 and into its initial implementation.
During the first generation, the non-binding agreement provided modest core funding to support periodic meetings of tri-national working groups. Progress was assessed and collaborative actions negotiated at conferences scheduled at three-year intervals at which each country was represented by the minister responsible for environmental affairs. During this initial period, each nation continued to act independently but the trend was toward greater collaboration and consensus-building among the specialists from each country assigned to various working groups. These working groups were organized around the six habitat types. Working groups defined the extent and distribution of each habitat type that they believed was necessary to sustain the functioning of the Wadden Sea and then developed the action plans that would both conserve what remained and restore some of what had been lost. A Trilateral Monitoring and Assessment Program was developed to standardize protocols and assessments of the actions called for by the habitat action plans.
Four years after the signing of the non-binding agreement, at the 1982 Conference, the three nations adopted a binding Joint Declaration on the Protection of the Wadden Sea. This committed the three nations to expand the contacts between responsible administrations to consult with each other and to coordinate implementing actions on the protection of seals, waterfowl, and their habitats. This parallels the pattern in the Chesapeake where an initial agreement was signed in 1978 and a more specific and binding commitment was negotiated and signed in 1983.
Three years after signing the binding agreement on the protection of the Wadden Sea, those attending the 1985 Conference examined the content of the habitat protection schemes, and identified issues that could be addressed through common management objectives and workplans. This marked the transition from a program comprised of three distinct national plans that varied in their degrees of protection, to the beginning of a unified and comprehensive ecosystem-based approach to management. To better support this move towards closer collaboration between the three nations, a permanent common secretariat based in Wilhelmshaven, Germany was established in 1987. The full-time secretariat brought stability and a single focal point for all program activities. The secretariat laid the groundwork for negotiating a common agenda of actions at the 1988 Conference. This endorsed a common plan of action for the conservation of seals, measures to integrate management policies and regulations governing nature reserves, the coordination of research activities, and for establishing a joint monitoring program. Together, these plans became the basis for a common single strategy for the conservation and the wise use of the Wadden Sea as a wetland of international importance.
At the 1991 Conference, the program adopted a set of guiding principles and refined the goal of the program as follows: “(T)o achieve, as far as possible, a natural and sustainable ecosystem in which natural processes proceed in an undisturbed
manner.”
Those involved in the program at that time stressed that the necessary trust between the three countries had to be built gradually and that this required postponing decisions on some important issues even when this brought criticism that the program was “weak” and “too compromising.” One highly sensitive issue was the definition of the boundaries of the areas subject to management actions. During this first generation, each nation defined its boundaries independently and the inconsistencies that this produced were simply accepted. A second source of tension was the growing opposition among traditional users who grew increasingly resentful of the program’s attempts to conserve and restore the Wadden’s natural resources.
The major accomplishment of this first generation of Wadden Sea governance was the consolidation of the enabling condi-tions associated with First Order outcomes. Second Order outcomes were limited to various forms of collaborative analysis and planning among participants in the program representing the three countries.
At the 1991 Conference, the program decided to phase out waterfowl hunting. This decision was made without consulting either the public or the groups most directly affected and for whom hunting was an important traditional activity and a significant source of income. This brought strong protests. The strength of the public’s response led the program to make substantial changes in how it operates. The ministers became reluctant to make any further decisions without the benefit of a public review.
The Second Generation of Governance
20
The inclusion of NGOs in the deliberations of the 1994 Conference, and the subsequent commitment to consult with the public on all management decisions that may affect the activities of local people, marks the transition from an environmental management plan directed at habitat conservation and shaped by technical specialists to an adaptive ecosystem governance program in which the needs and views of the affected human communities are recognized as important and play an active role in shaping the program. Once this transition had been made, the program’s influence and effectiveness grew rapidly. (See Table 8.)
Three years later, in 1997, the Trilateral Wadden Sea Plan was adopted. The plan sets targets for each of the habitat types and for the first time sets forth a single agenda that applies to areas under the jurisdiction of the three nations. In 1998, the program launched a Landscape and Cultural Heritage project which for the first time addressed the many issues raised by the conservation and restoration goals of the program. The project was designed around extensive public consultation.
Table 8: Third Order Ecosystem Outcomes Associated with the Second Generation of the Wadden Sea Cooperation
• Increased area of salt marsh
• Increased area of seagrasses
• Improvements in maintaining the sediment balance of the tidal area
• Improvements in water quality
• Increased food and habitat for migrating birds
• Increased return from the fishery based on individual quota system in mussel-seed fishing
• Time for fishers to stock culture plots in an optimal manner
A Decentralized Governance System
As the program has evolved, it has taken on the characteristics of a nested governance system that links among policies and actions at both higher and lower levels in the governance hierarchy. The next higher level above the Trilateral Wadden Sea Coop-eration is the European Union. In 1992, the Common Principles adopted at the 1991 conference were endorsed by the European Habitat Directive of 1992, which also designated major parts of the Wadden Sea as Special Areas of Conservation. The directive assigns management authority for these areas to the Cooperation and makes the Common Principles legally binding.
Decentralized planning and decisionmaking at lower levels in the governance hierarchy began with a co-management program undertaken by the Dutch Shellfish Fisheries Association in 1993. This was a new approach that provided for shared responsibilities between the government and the fishers. A Steering Group composed of both government representatives and fishers drafted a management plan that applies the principle of best environmental practice to the harvesting of cockles and mussels. The hope was that the fishers’ support for regulations over their activities would improve compliance. After three years of imple-mentation, several evaluations have concluded that the co-management approach has indeed been a success. Most important, the fishers have conformed to the rules in the plan. For mussel fishers, the individual quota system in mussel-seed fishing resulted in more return from the available seed, and more time for fishers to stock their culture lots in an optimal manner. This was an unexpected and significant benefit. The cockle fishers have been less enthusiastic since they have had to restrict their activities during years when wild cockle stocks are low. Although the cockle fishers were somewhat dissatisfied, and have not benefited economically from the plan, they too have respected the regulations and applied strong sanctions to those that do not follow the rules. Monitoring of the plan suggests that it has produced environmental benefits, including a recovery of seagrass beds and larger populations of desired species in closed areas. However, the three-year period was not long enough for a full recovery of the mussel beds. Co-management is continuing in the Netherlands and lessons from the evaluation have been incorporated in the 1999-2003 workplan.