Indo. J. Chem., 2012, 12 (2), 201 - 205
201
DETERMINATION OF INULIN FROM MULTIVITAMIN SYRUP PRODUCT
BY HIGH PERFORMANCE LIQUID CHROMATOGRAPHY WITH RI DETECTOR
Yuni Retnaningtyas
Department of Chemical Pharmacy, Faculty of Pharmacy, Jember University, Jl. Kalimantan I/2, Jember, 68121, Indonesia
Received December 19, 2011; Accepted February 22, 2012
ABSTRACT
At present, inulin is often added to multivitamin syrup product. The determination of the component of preparation both qualitatively and quantitatively is important to ensure quality of the product. This research is aimed to develop a high performance liquid chromatography method to analyze inulin in multivitamin syrup preparation. Separation of inulin from the sample, was performed using Aminex column HPX-87H (300 x 7.8 mm) Ion Exclusion at a temperature of 80 °C with isocratic elution system using deionized water as mobile phase at a flow rate of 0.5 mL/min, and detected by using refractive index detector. This method validation showed a good linearity with correlation coefficient (r) of 0.999 while the coefficient of variation of the regression function (Vx0) was 2.00%. The
limit of detection (LOD) and the limit of quantification (LOQ) of the method were respectively 0.12 mg/mL and 0.37 mg/mL. The mean absolute recovery of inulin from the simulation sample was 99.42% and the method precision was less than 2%. The proposed method has been applied to the determination of inulin in commercial multivitamin syrup and the recovery of label claim was 99.9 mg/100 mL. The proposed HPLC method is rapid, simple, and selective for routine analysis.
Keywords:inulin; high performance liquid chromatography; multivitamin syrup
ABSTRAK
Saat ini inulin banyak ditambahkan dalam sediaan sirup multivitamin. Penetapan senyawa ini baik secara kualitatif maupun kuantitatif penting untuk menjamin bahwa tiap obat mengandung bahan yang benar dengan mutu dan jumlah yang tepat. Penelitian ini bertujuan untuk mengembangkan suatu metode kromatografi cair kinerja tinggi yang dapat digunakan untuk menganalisis inulin dalam sediaan sirup multivitamin. Sebagai fase diam digunakan kolom Aminex Ion Exclusion HPX-87H (300 x 7,8 mm) pada suhu 80 °C dengan sistem elusi isokratik menggunakan aquabidest sebagai fase gerak dengan laju alir 0,5 mL/menit. Sebagai pelarut digunakan aqubidest (60-70 °C). Deteksi dilakukan dengan detektor indeks refraksi. Hasil validasi metode menunjukkan linieritas yang baik dengan koefisisen korelasi (r) 0,999, sementara koefisien variasi fungsi regresi (Vx0) adalah 2,00%. Batas deteksinya adalah
0,12 mg/mL sedangkan batas kuantitasinya adalah 0,37 mg/mL. Perolehan kembali 99,42%. Uji keseksamaan memberikan nilai koefisien variasi lebih kecil dari 2%. Metode KCKT ini dapat diterapkan untuk menetapkan kadar inulin secara rutin dalam sediaan sirup multivitamin dengan cepat, sederhana dan selektif.
Kata Kunci:Inulin; Kromatografi Cair Kinerja Tinggi; sirup multivitamin
INTRODUCTION
Inulin is a polymer of several units of fructose that generally have a terminal glucose. Fructose units are connected by glycosidic bonds (2-1). In general, inulin found in plants contains 2 to 150 fructose units. The simplest Inulin is 1-ketosa which only has two fructose units and one unit of glucose [1]
Utilization of inulin for children is more directed toward increasing the body's immune and growth. Meanwhile, for the menopause-aged women, the
producers of dairy products focus more on its ability in preventing osteoporosis among them. As a whole, Inulin has single function as a prebiotic supplement. In addition, inulin also can collaborate together with other probiotics found in products such as yogurt, buttermilk, and others. Collaboration between prebiotics and probiotics is known as sinbiotic. Apart from what has been mentioned before, Inulin is also able to increase bifidobacter population growth in the colon. This bifidobacter is to inhibit the growth of pathogenic bacteria such as Clostridium perfringens, and
Indo. J. Chem., 2012, 12 (2), 201 - 205
202
Escherichia coli strains diarrheagenic. Some research had done in mice indicated that inulin is found potential to reduce serum triglycerides. Experts suspect that the ability in humans showed the same potential. [2] Inulin is often added in multivitamin syrup product. It is intended to boost immunity and increase growth. The use of inulin in multivitamin syrup product has developed very rapidly. The Analytical methods for determination of inulin include HPLC method has been published inActa Chim. Slovaca by Simonova, I. [3]. Capillary Gas Chromatography (GC) method that has been reported by Low, H.N. [4]. The TLC method has been carried out by Simonowska, B., who three years later carried out another study using HPTLC method [5-6], anion-exchange high-performance liquid chromatography (HPLC) method has been carried out by Zuleta [7] and Enzymatic method has been reported by Korakli, M. [8].
The aim of this work was to develop a simple, rapid, and validated HPLC method using refractive index detector for routine analysis of inulin compound in the multivitamin syrup product.
EXPERIMENTAL SECTION
Materials
Inulin 98% (Fluka) was analytical grade as standard, Reagent used were deionized water, multivitamin syrup (Merck) and purchased from pharmacy in Jember. Acetonitrile (Merck) was LC grade. Glucose (Fluka) Thiamine (Fluka), Ribovlavin (Fluka), Niacin (Fluka), Pyridoxine (Fluka), Cobalamin (Fluka), L. Ascorbic acid (Fluka) were analytical grade reagents.
Instrumentation
HPLC analyses were carried out with Hitachi Model D2000 liquid chromatograph with refractive index detector. The column used was Aminex Ion Exclusion HPX-87H (300 x 7.8 mm). The mobile phase was deionized water, vacuum-filtered through 0.2 μm membranes (Germany) before use. The following instruments were also used: analytical scales, Hitter, column heater, vortex, vacuum pump, glass tools commonly used in laboratories.
Procedure
Sample Preparation (multivitamin syrup product) One mL samples was accurately measured and transferred into 10 mL volumetric flasks and dissolved in deionized water by heating it at 60-70 °C. The solution was sonicated vigorously for 5 min and filtered on a
millipore membrane (0.45 μm) to obtain a transparent solution. Then 1.0 mL of filtrate was transferred into 50.0 mL volumetric flask and diluted with mobile phase.
Preparation of standard solution
A 10 mg/mL stock solution of inulin standard was prepared in hot water. A series of each standard solution containing 0.5; 1.0; 1.5; 2.0; 2.5; 3.0 mg/mL was prepared from the stock standard solution.
Optimization of experimental for HPLC
HPLC was performed under isocratic conditions. All experimental conditions were optimized by means of a univariate method as follows:
Solvent. Various solvent were tested as a solvent for inulin, e.g., deionized water; hot deionized water (60-70 °C), deionized water : acetonitrile (9:1), deionized water : Acetonitrile (8:2). Solubility observations were conducted visually.
Mobile Phase.Various solvent systems were tested as the mobile phase for separation of inulin in the sample, e.g., deionized water (100 v/v), deionized water : acetonitrile (90:10 v/v), deionized water : acetonitrile (80:20 v/v).
Mobile phase flow rate.The optimum flow rate of the mobile phase should provide good separation, high sensitivity, and short analysis time. In this work, optimization of the flow rate was carried out by injecting the same concentration of mixed standard solution at various flow rates from 0.2 to 1 mL/min.
Column Temperature. The optimum column temperature should provide good analysis result. In this way, optimization of the column temperature was carried out by injecting the same concentration of mixed standard solutions at various column temperatures from 50 to 80 °C.
Recommended HPLC. A sample and or standard solution containing inulin was separated on Aminex Ion Exclusion HPX-87H (300 x 7.8 mm) and detected by refractive index. An aliquot of 20 µL of a series of inulin standard solutions and 20 µL of sample extract was injected into LC system and eluted with the mobile phase, water 100% (flow rate 0.5 mL/min), temperature column 80 °C. The area of the inulin peak was measured. Inulin concentration on the multivitamin syrup product was determined using to the calibration curve method prepared under identical experimental conditions.
Indo. J. Chem., 2012, 12 (2), 201 - 205
203
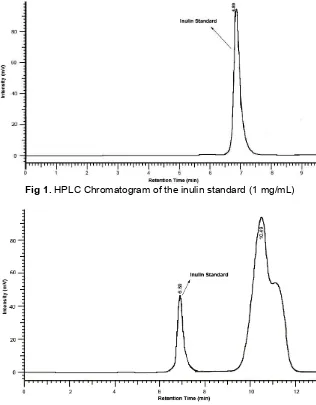
Fig 1.HPLC Chromatogram of the inulin standard (1 mg/mL)
Fig 2.HPLC Chromatogram of the inulin standard (1mg/mL) in matrix
RESULT AND DISCUSSION
A high-performance liquid chromatographic method for the determination of inulin in multivitamin syrup was developed. The experimental conditions were investigated and the proposed method was also validated.
Optimization of HPLC Condition
The optimal conditions of HPLC using Aminex Ion Exclusion HPX-87H (300 x 7.8 mm) column for determining inulin were carried out under isocratic conditions. Various mobile phase systems with different compositions were investigated. First, a mixture consisting of deionized water (100 v/v) was used as the mobile phase, and it was found that this mobile phase was the most suitable one because it resulted in good
retention times, resolution, and satisfactory peak profiles (Fig. 1-3). Finally the optimum flow rate and temperature column were set at 0.5 mL/min and 80 °C respectively, as they gave a good resolution, high sensitivity, a short analysis time.
METHOD VALIDATION
204
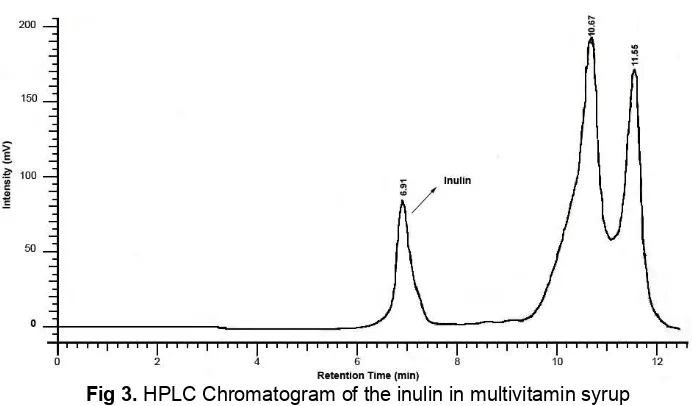
Fig 3.HPLC Chromatogram of the inulin in multivitamin syrup
Table 1.Linear Regression Analysis (n = 3) and Limits of Detection (S/N = 3) and Quantitation (S/N = 10)
Standard Linearity range (mg/mL)
Equation Y=SX +C
R2 (Mean ±S.D.)
LOD (mg/mL)
LOQ (mg/mL)
Inulin 0.5 - 3.5 Y= 695360.5x – 8865.7 0.999 0.12 0.37
Table 2.Within-day and Between-day Precision Analysis of Inulin Standard Solutions
Within-day variability (n=3) (concentration found)
Between-day variability (n=3) (concentration found) Concentration
added (mg/mL)
Mean ± S.D. % R.S.D. Mean ± S.D. % R.S.D.
0.50 2.00 3.00
0.49 ± 2.00 2.03 ± 4.44 3.00 ± 1.39
2.04 1.42 1.39
0.49 ± 1.15 2.00 ± 1.26 2.99 ± 1.20
1.17 1.26 1.21
shown in Table 1, which indicated the good sensitivity of the proposed LC method.
Linearity
The basic calibration plot of peak area against amount of analyte was constructed within the range of 20-200% of the expected values in the pharmaceutical preparations. Linearity of inulin was achieved from 0.5 to 3.5 mg/mL with line equation Y = 695360.5x – 8865.7. The relative process standard deviation (Vxo) and Xp values of inulin were 2% and 0.12 mg/mL [9-10], (n = 6; r = 0.999), respectively. ANOVA regression-test for testing linearity of the regression line showed a significant calculated F-value (11317.96 for p < 0.0001). The residuals were distributed at random around the regression line; neither trend nor uni-directional tendency was found.
Precision and Accuracy
Precision is the compatibility degree of the repeated measurement result of the same analyte solution at a relatively similar measurement condition. The % variation coefficient value that was obtained has
already fulfilled the precision criteria for the medicine standard determination with particular concentration between 0.5 mg/mL up to 3.0 mg/mL. The intraday reproducibility study was performed during a period of three days. The results obtained showed that the inulin peak area variabilities for standard solution were within 1.39-2.04% R.S.D. For interday reproducibility, three replicate injections of various concentrations of inulin were made within a day. The results obtained showed that the inulin area variabilities for standard solutions were within 1.17-1.26% R.S.D. The results are shown in Table 2. Values demonstrated good precision. These values were also less than the required values as described by Huber [11].
205
Table 3.Accuracy of the Proposed LC Method (n=3)
Standard Concentration added
resulted retrieval showed a good precision level, that is 99.42%. Therefore, it has fulfilled the requirement of the precision limit for the determination of the finished availability standard (98-100%). Accordingly, this method has met the accuracy standard.
The Contents of Inulin in Commercial Product
Contents of inulin in sample were analyzed by HPLC after filtration. The methodology was applied to analyze target compound in one commercial product. The recovery of the proposed method based on label claim was 99.9%. The study established a feasible HPLC analysis method of inulin. As a whole, this analysis contributes a good, simple, precise and fast way to identify and quantify for inulin ingredients in multivitamin syrup product.
CONCLUSION
The High-Performance Liquid Chromatographic procedure has been developed for determining inulin in multivitamin syrup product. The method was also validated for limit of detection, limit of quantitation, linearity, repeatability, producibility, and accuracy. The optimum conditions and analytical characteristics for HPLC determination of inulin exhibited good resolution, short analysis time, and adequate sensitivity. In the proposed method, determination of inulin in multivitamin syrup preparation was done by using the working calibration curves over the ranges of 0.5-3.5 mg/mL. The method was successfully applied to determination of inulin in one commercial multivitamin syrup. The recovery of label claim was 99.9 g/100 mL. The benefits of the proposed method are simplicity, convenience, rapidity, sensitivity, good precision, and accuracy. The method is suitable for routine analysis of inulin in commercial multivitamin syrup product. In addition, the
proposed method is suitable for the routine analysis of products of similar composition in pharmaceutical industry quality control laboratories.
REFERENCES
1. Meyer, D., and Tungland, B., 2001, Inulin A Pure Soluble Dietary Fibre, Serial Online, http:// http://www.nutraceuticalsnow.com/issues/back/200 1winter/inulin.php, accessed on 17 March 2007. 2. Widowati, S., 2005, Ekstraksi, Karakterisasi, dan
Kajian Potensi Prebiotik Inulin Umbi Dahlia (Dahlia pinnata L.), Serial Online, Seminar Rutin Puslitbang Tanaman Pangan, Bogor, 16 June 2005.
3. Simonova, I., Karovicova, J., Mastihuba, V., and Kohajdova, Z., 2010, Acta Chim. Slovaca, 3, 2, 122–129.
4. Low, H.N., McLaughlin, A.M., Page, W.S., Canas, J.B., Brause, R.A., and Low H.N., 2001, J. Assoc. Off. Agric. Chem. Int.,84, 2, 486–492.
5. Prosek, M., Simonovska, B., Golc-wondra, T., Vovk, I., Andrensek, S., Micovic, E., and Golob, T., 2007, J. Planar. Chromatogr. - Mod. TLC, 16, 1, 58–62.
6. Simonovska, B., 2000, J. Assoc. Off. Agric. Chem. Int., 83, 3, 675–678.
7. Zuleta, A., and Simbucetti, M.E., 2001,Agric. Food Chem., 49, 10, 4570–4572
8. Korakli, M., Hinrichs, C., Ehrmann, M.A., and Vogel, R.F., 2003,Eur. Food Res. Technol., 217, 6, 530–534.
9. Ibrahim, S., 2005,Acta Pharm. Ind., 30, 1, 30–34. 10. Wulandari, L.; and Indrayanto, G., 2003, J. Liq.
Chromatogr. Related Technol., 26, 16, 2709–2717 11. Huber, L., 2007, Validation and Qualification