Arcs of integration: an international study of
supply chain strategies
Markham T. Frohlich
a,∗, Roy Westbrook
baLondon Business School, Regent’s Park, London NW1 4SA, UK
bSa¨ıd Business School, University of Oxford, Oxford OX2 6LE, UK
Abstract
Though there is a wide acceptance of the strategic importance of integrating operations with suppliers and customers in supply chains, many questions remain unanswered about how best to characterize supply chain strategies. Is it more important to link with suppliers, customers, or both? Similarly, we know little about the connections between supplier and customer integration and improved operations performance. This paper investigated supplier and customer integration strategies in a global sample of 322 manufacturers. Scales were developed for measuring supply chain integration and five different strategies were identified in the sample. Each of these strategies is characterized by a different “arc of integration”, representing the direction (towards suppliers and/or customers) and degree of integration activity. There was consistent evidence that the widest degree of arc of integration with both suppliers and customers had the strongest association with performance improvement. The implications for our findings on future research and practice in the new millennium are considered. © 2001 Elsevier Science B.V. All rights reserved.
Keywords: Supply chain management; Operations strategy; Empirical research
1. Introduction
Over the past two decades, there has been a marked shift in the focus of operations strategy. If the 1980s were about vertically aligning operations with busi-ness strategy (Hayes and Wheelwright, 1984), the 1990s have been about horizontally aligning opera-tions across processes (Ghoshal and Bartlett, 1995). In most industries today it is not enough simply to optimize internal structures and infrastructures based upon business strategy. The most successful manufac-turers seem to be those that have carefully linked their internal processes to external suppliers and customers in unique supply chains. In short, for the new mil-lennium upstream and downstream integration with
∗Corresponding author.
suppliers and customers has emerged as an important element of manufacturing strategy.
Though the fundamental importance of supply chains is widely accepted (Saunders, 1997; Gattorna, 1998), important questions remain open about how to characterize them (New, 1996). Our knowledge is relatively weak concerning which forms of integra-tion manufacturers use to link up with suppliers and customers. Moreover, we know little about the con-nections between upstream and downstream supply chain integration and resulting performance. Which types of integration lead to the greatest overall per-formance improvements?
This paper empirically analyzed manufacturers’ supply chain integration strategies. The paper used ev-idence from an international study of manufacturing strategy and tested the relationship between supply
chain integration and performance. As Eloranta and Hameri (1991) noted, inbound and outbound logistics tend to be separated in research with an unbalanced emphasis on the supply or purchasing side. Therefore, an important goal of this paper was simultaneously considering upstream supplier and downstream cus-tomer integration during the analysis. In so doing, the paper develops a new way of characterizing the direc-tion and degree of supply chain integradirec-tion, and thus of defining different supply chain strategies. Finally, some implications of these findings for operations management strategy research and practice in the new millennium are suggested.
2. The strategic importance of supply chain integration
Over the past decade there has been a growing consensus concerning the strategic importance of integrating suppliers, manufacturers, and customers (Reck and Long, 1988; Leender and Blenkhorn, 1988; Bowersox et al., 1989; Freeman and Cavinato, 1990; Syson, 1989; McGinnis and Kohn, 1990, 1993; Morris and Calantone, 1991; Cammish and Keough, 1991; Eloranta and Hameri, 1991; Burt and Doyle, 1992; Clinton and Closs, 1997). As Carothers and Adams (1991), Langley and Holcomb (1992), and Shapiro et al. (1993) convincingly argued, the once narrow subject of logistics has become a comprehen-sive topic that now spans the entire value system from suppliers to customers. Reinforcing this point, Ragatz et al. (1997) noted that the “effective integration of suppliers into product value/supply chains will be a key factor for some manufacturers in achieving the improvements necessary to remain competitive”. For practitioners, the strategic importance of integration is similarly reflected in the Supply Chain Council’s popular Supply Chain Operations Reference (SCOR) model that assumes all businesses include sourcing, making, and delivering processes strategically link-ing suppliers and customers to manufacturers (see www.supply-chain.org.).
Many of the theoretical arguments for closely integrating operations between manufacturers and suppliers and customers come from the process reengineering literature (Hammer and Champy, 1993; Hammer, 1996; Fliedner and Vokurka, 1997; Burgess,
1998). Typically the goal is to create and coordinate manufacturing processes seamlessly across the sup-ply chain in a manner that most competitors cannot very easily match (Anderson and Katz, 1998; Lum-mus et al., 1998). As Birou et al. (1998) pointed out “the opportunity to use process integration across functional boundaries is now considered a key to competitive success”. Davis (1993), Dyer and Ouchi (1993), Eisenhardt and Tabrizi (1994), and Littler et al. (1995) similarly echoed the importance of in-tegrating suppliers and customers into supply chains for developing new products and processes.
2.1. Supply chain integration tactics
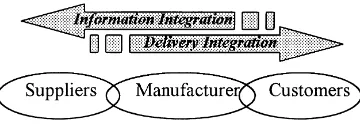
At the tactical level, the literature suggests that there are two interrelated forms of integration that manufacturers regularly employ (Fig. 1). The first type of integration involves coordinating and integrat-ing the forward physical flow of deliveries between suppliers, manufacturers, and customers (Saunders, 1997; Trent and Monczka, 1998). Many of these proponents of supply chain integration fall under the banner of just-in-time (Chapman and Carter, 1990; Chen and Chen, 1997; Landry et al., 1997; Grout, 1998; Narasimhan and Carter, 1998; Tan et al., 1998; Sakakibara et al., 1997; White et al., 1999). Others have pointed out the importance of delivery integra-tion in terms of implementing product postponement and mass customization in the supply chain (Lee, 1998; Lee and Tang, 1998; Van Hoek et al., 1998; Pagh and Cooper, 1998) or for exploiting third-party logistics (Saunders, 1997; Gattorna, 1998; Marvick and White, 1998).
The other prevalent type of integration involves the backward coordination of information technolo-gies and the flow of data from customers to suppliers (Martin, 1992; Trent and Monczka, 1998). Informa-tion technologies allow “multiple organizaInforma-tions to
coordinate their activities in an effort to truly man-age a supply chain” (Handfield and Nichols, 1999). Integration using information technologies includes electronic data interchange (EDI) (Sheombar, 1992; Walton and Marucheck, 1998; Jayaram and Vick-ery, 1998; Narasimhan and Carter, 1998) as well as sharing data from traditional planning and control systems (Bowersox and Daugherty, 1995; Lewis and Talalayevsky, 1997; Van Hoek et al., 1998).
2.2. The arc of integration
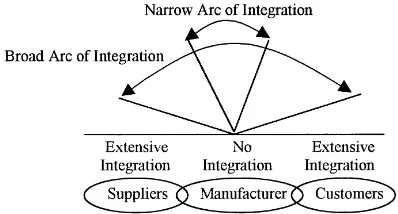
If this need to develop shared operational activities is accepted, then the strategic issue becomes one of direction and degree — in which direction (towards customers and/or towards suppliers) and to what ex-tent (degree of integration) should such shared activ-ity be developed? Taking this pair of decisions as the key dimensions for representing a strategic position we can illustrate them graphically as an arc, with the direction of the segment showing whether the firm is supplier or customer leaning, and the degree of arc in-dicating the extent of the integration. This has more visual immediacy than a plot on a line graph for this type of investigation. Hence, in this paper we charac-terize the strategic position of each respondent with respect to supply chain development as that firm’s “arc of integration”.
As suggested by Fig. 2, all manufacturers implic-itly make strategic decisions concerning the extent of upstream and downstream integration that they want to undertake. Some manufacturers decide to engage in relatively little integration with suppliers or customers and thus have a relatively narrow arc of integration. Other manufacturers extensively integrate their
organi-Fig. 2. Arcs of integration.
zations with upstream suppliers and downstream cus-tomers by pursuing a strategy with a broad arc of integration.
Growing evidence suggests that the higher the level of integration with suppliers and customers in the sup-ply chain the greater the potential benefits (Stevens, 1989; Lee et al., 1997; Metters, 1997; Narasimhan and Jayaram, 1998; Lummus et al., 1998; Ander-son and Katz, 1998; Hines et al., 1998; JohnAnder-son, 1999). Tan et al., (1998) noted that when companies “integrate and act as a single entity, performance is enhanced throughout the chain”. Others have pointed out the inherent hazards of not fully integrating with upstream suppliers and downstream customers (Lee and Billington, 1992; Hammel and Kopczak, 1993; Armistead and Mapes, 1993). Fisher et al. (1994) highlighted the critical role of balancing supply and demand across the supply chain. Handfield and Nichols (1999) argued that now manufacturers must not only manage their own organizations but also be involved in the management of the network of up-stream and downup-stream firms. Hale (1999) similarly pointed out that those firms “who have traditionally been structured as independent businesses will in-creasingly have to configure operations on a shared basis”. By extension, manufacturers with the broad-est arcs of supply chain integration should have the highest levels of performance improvements. This leads to the hypothesis that we wish to examine in this paper:
Hypothesis 1. Companies with the greatest arcs of
supplier and customer integration will have the largest rates of performance improvement.
3. Research methods
3.1. Sample
manu-facture of fabricated metal products, machinery and equipment. Pending future research, the results of this study should, therefore, be carefully generalized to other sectors such as consumer goods manufacturers. It may be more difficult for consumer goods man-ufacturers to integrate with customers — especially ones that sell directly to end-users. In addition, such manufacturers tend to have broader customer bases that complicate integration.
For 1998, research coordinators in 23 countries administered the survey on a country by country basis. In nations where English was not a prevalent language the surveys were translated by full-time OM professors familiar with manufacturing strategy. Dillman’s (1978) total design method for mail sur-vey research was followed and data were collected from 703 companies in the 23 countries. The re-sponse rate for the total sample was approximately 20%.
It is important to note that for this paper only 322 of the 703 total responses were included in the anal-ysis. The excluded cases had relatively incomplete reported performance data. The subset included in this paper and the total sample are summarized by region in Table 1, and the deleted responses were proportional around the world. As an additional test, ANOVA and the Scheffé method were used to check for significant demographic differences between the subset used in this study and the total sample. There were no significant differences (p < 0.05) between the total sample and sub-sample for country (p = 0.7041), size (p=0.6065), or SIC code (p=0.6469) which suggested that examining only those cases with complete performance data did not bias the analysis.
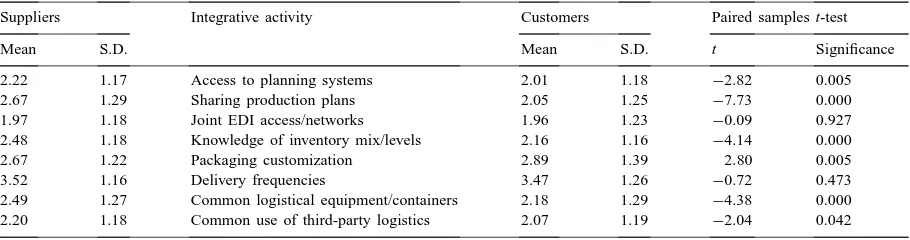
Table 2
Summary statistics for integrative activities
Suppliers Integrative activity Customers Paired samples t-test
Mean S.D. Mean S.D. t Significance
2.22 1.17 Access to planning systems 2.01 1.18 −2.82 0.005
2.67 1.29 Sharing production plans 2.05 1.25 −7.73 0.000
1.97 1.18 Joint EDI access/networks 1.96 1.23 −0.09 0.927
2.48 1.18 Knowledge of inventory mix/levels 2.16 1.16 −4.14 0.000
2.67 1.22 Packaging customization 2.89 1.39 2.80 0.005
3.52 1.16 Delivery frequencies 3.47 1.26 −0.72 0.473
2.49 1.27 Common logistical equipment/containers 2.18 1.29 −4.38 0.000
2.20 1.18 Common use of third-party logistics 2.07 1.19 −2.04 0.042
Table 1 Sample by region
Region Subset used in this paper Total sample
Count % Count %
Asia/Pacific 85 26.4 210 29.9
Europe 157 48.8 306 43.5
North America 46 14.3 111 15.8
South America 34 10.6 76 10.8
Total 322a 100.0 703 100.0
a381 case deleted from the 703 total sample due to incomplete
performance data.
3.2. Independent construct measurement
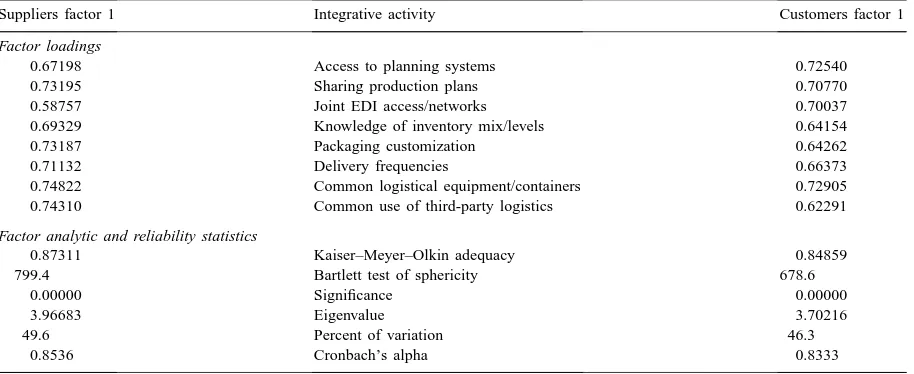
Table 3
Factor analysis of integrative activities and reliabilities
Suppliers factor 1 Integrative activity Customers factor 1
Factor loadings
0.67198 Access to planning systems 0.72540
0.73195 Sharing production plans 0.70770
0.58757 Joint EDI access/networks 0.70037
0.69329 Knowledge of inventory mix/levels 0.64154
0.73187 Packaging customization 0.64262
0.71132 Delivery frequencies 0.66373
0.74822 Common logistical equipment/containers 0.72905
0.74310 Common use of third-party logistics 0.62291
Factor analytic and reliability statistics
0.87311 Kaiser–Meyer–Olkin adequacy 0.84859
799.4 Bartlett test of sphericity 678.6
0.00000 Significance 0.00000
3.96683 Eigenvalue 3.70216
49.6 Percent of variation 46.3
0.8536 Cronbach’s alpha 0.8333
Multi-item scales were developed for each con-struct in this study. Before creating the final scales, the data were checked for normality and out-liers. As shown in the bottom half of Table 3, the Kaiser–Meyer–Olkin measures of sampling adequacy were 0.87311 (suppliers) and 0.84859 (customers). A minimum Kaiser–Meyer–Olkin score of 0.50 is con-sidered necessary to reliably use factor analysis for data analysis. Scores over 0.80 are considered very good. Similarly, the Bartlett test of sphericity (the higher the better) was 799.4 (suppliers) and 678.6 (customers) with significance levels ofp <0.00000.
Confirmatory factor analysis (Kim and Mueller, 1978) was employed to help ensure reliable scales (Flynn et al., 1990; O’Leary-Kelly and Vokurka, 1998). SPSS’s principal components procedure was used to check that the eight integration measurements were uni-dimensional (see the top half of Table 3). A single factor loaded for the eight integration mea-surements based on the manufacturer’s answer for integrating with suppliers. Similarly, the eight mea-sures loaded on a single factor for the customers. Fac-tor scores were saved from the principal component analysis for supplier and customer integration using the regression method. Factor scores are the weighted averages of values on all the original variables using factor loadings as weightings. Using factor scores in this manner creates a more accurate measure than
sim-ply computing a mean, which assigns equal weights to items (Lastovicka and Thamodaram, 1991).
An internal consistency analysis was done for each factor using the SPSS reliability procedure (Saraph et al., 1989; Flynn et al., 1995). As seen at the bot-tom of Table 3, the reliability of each scale was sat-isfactory according to accepted guidelines for newly developed scales with Cronbach’s alphas of at least 70% (Nunnally, 1978; Flynn et al., 1995).
Table 4 shows the zero-order Pearson correlation coefficients for the supplier and customer integration scales. As might be expected, because many forms of upstream and downstream integration are often un-dertaken at the same time, the scales were positively correlated with each other.
Table 4
Correlations among integration scales and demographic variables
1 2 Correlations between scale and other demographic variables
Country Sizea SIC code Market focusb Product focusc Geographical focusd
Supplier integration (1) 1.00 −0.06 −0.01 −0.03 0.04 −0.01 0.03 Customer integration (2) 0.54e 1.00 0.11 −0.01 −0.09 −0.04 −0.01 −0.02
aSize
=number of employees.
bMarket focus
=1–5 Likert, 1=few markets, 5=manymarkets.
cProduct focus
=1–5 Likert, 1=physical attributes, 5=service emphasis.
dGeographical focus
=1–5 Likert, 1=national attributes, 5=international.
eSignificant atp <0.01.
(right side of Table 4). There were no significant cor-relations (p <0.05) between the two scales and other demographic variables, and thus the scales were not measuring other unintended constructs.
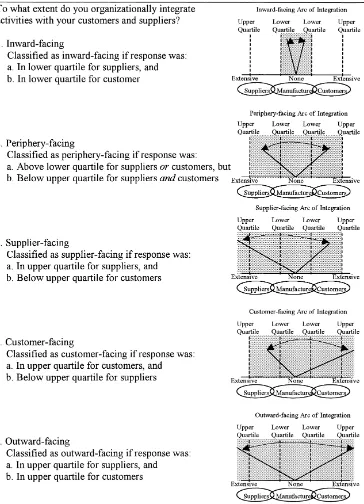
3.3. Operationalizing arcs of integration
Arcs of integration were operationalized as shown in Fig. 3. Five mutually exclusive groups were defined that conceptually represented the major different inte-gration strategies that manufacturers could undertake in relation to suppliers and customers (see Fig. 3). The factor score for supplier integration was used to classify each manufacturer into either the upper, mid-dle, or lower quartiles. Similarly, each manufacturer’s customer integration score was used to classify the case into the correct quartile. Although the selec-tion of cut-off points in any statistical analysis is somewhat arbitrary, dividing samples into quartiles is commonly done in applications ranging from student graduation rankings to benchmarking studies for iden-tifying best-in-class (75th percentile), median (50th percentile), and worst-in-class (25th percentile) group membership (McClave and Benson, 1985). Relying on quartiles for data grouping, instead of other data classification method such as cluster analysis, also means that future researchers using identical cut-off points can readily replicate this study.
Quartiles were then used to sort the 322 cases into the five different integration strategies. For example, respondents that were in the bottom quartiles of inte-gration with both suppliers and customers were classi-fied as “inward-facing”. Manufacturers who reported integration levels above the lower quartiles in at least one direction (upstream with suppliers or downstream
with customers) but that fell below the upper quar-tiles for suppliers and customers were categorized as “periphery-facing”. Respondents that reported exten-sive integration with suppliers (in the upper quartile), but that had customer integration below the upper quartile were categorized as “supplier-facing”. In a similar manner, manufacturers that reported extensive integration with customers (in the upper quartile) but remained below the upper quartile for suppliers were categorized as “customer-facing”. Finally, companies that reported high levels of integration in the upper quartiles for both customers and suppliers were la-beled “outward-facing”.
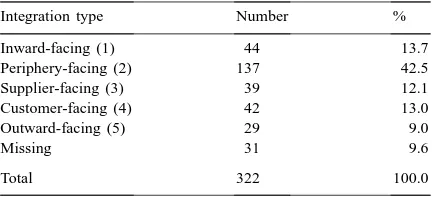
We analyzed supply chain integration based upon the above operationalization for arcs of integration. As shown in Table 5, the sample of 322 manufacturers was sorted into the five different integration groups outlined above and in Fig. 3. For example, 44 of the 322 respondents were in the bottom quartiles for in-tegrating with suppliers and customers. We therefore classified them as “inward-facing”. Conversely, 29 of the 322 respondents indicated extensive (upper quar-tile) upstream and downstream integration with
sup-Table 5
Arc of integration group membership
Integration type Number %
Inward-facing (1) 44 13.7
Periphery-facing (2) 137 42.5
Supplier-facing (3) 39 12.1
Customer-facing (4) 42 13.0
Outward-facing (5) 29 9.0
Missing 31 9.6
pliers and customers. These 29 manufacturers were grouped as “outward-facing”. Similar procedures were followed for classifying the remaining compa-nies in the sample into the 137 “periphery-facing”, 39 “supplier-facing”, and 42 “customer-facing” groups. Thirty-one cases had missing data for supply chain integration and were omitted.
Two checks were done to help ensure that the five groups were correctly classified for supply chain inte-gration in Table 5. First, SPSS’s K-means cluster anal-ysis was used to group the 322 cases into five groups based upon the scales for supplier and customer in-tegration. The K-means procedure identifies relatively homogeneous groups of cases for selected variables. Cluster memberships for each of the five groups was saved and then compared using SPSS’s Crosstabs pro-cedure to the five groups in Table 5. Crosstabs was used to count the number of cases that were in common (and different) between the two classifications and to calculate bivariate statistics. The Pearson’s correlation between group membership for the two classification procedures was 0.2919 (p < 0.00000). This strong correlation between the data-driven cluster analysis and our quartile procedure supported the way we op-erationalized arcs of integration.
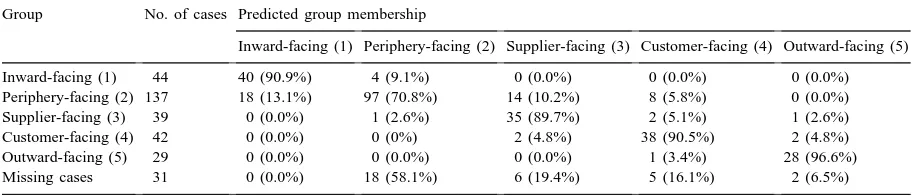
Second, discriminant analysis was run to ensure that the five groups were correctly classified for sup-ply chain integration. The 16 integrative activities (eight for suppliers and eight for customers) listed in the Appendix A and Table 2 were entered as inde-pendent variables along with group membership from Table 5 (inward-, periphery-, supplier-, customer-, and outward-facing) as the dependent variable. As seen in Table 6, the discriminant analysis confirmed that 81.8% of the respondents were classified correctly,
Table 6
Classification results for discriminant analysis test for arcs of integrationa
Group No. of cases Predicted group membership
Inward-facing (1) Periphery-facing (2) Supplier-facing (3) Customer-facing (4) Outward-facing (5) Inward-facing (1) 44 40 (90.9%) 4 (9.1%) 0 (0.0%) 0 (0.0%) 0 (0.0%) Periphery-facing (2) 137 18 (13.1%) 97 (70.8%) 14 (10.2%) 8 (5.8%) 0 (0.0%) Supplier-facing (3) 39 0 (0.0%) 1 (2.6%) 35 (89.7%) 2 (5.1%) 1 (2.6%) Customer-facing (4) 42 0 (0.0%) 0 (0%) 2 (4.8%) 38 (90.5%) 2 (4.8%) Outward-facing (5) 29 0 (0.0%) 0 (0.0%) 0 (0.0%) 1 (3.4%) 28 (96.6%) Missing cases 31 0 (0.0%) 18 (58.1%) 6 (19.4%) 5 (16.1%) 2 (6.5%)
aOverall percent of grouped cases correctly classified: 81.8%.
indicating extremely good differentiation among the five groups and substantially above the 20% correct classification that would be expected by chance. This relatively high percentage of correctly classified cases likewise supported the validity of the groups into which usable respondents were placed.
The operationalization of arcs of integration in Fig. 3 was least exact at classifying the periphery-facing group (70.8%) as shown in Table 6. This was to be expected since the more inclusive, less discriminating definition (integration levels above the lower quartiles in at least one direction for suppliers or customers, but below the upper quartile for both) classified the periphery-facing group. A manufacturer just above the lower quartiles for suppliers or customers was clas-sified as periphery-facing whereas a respondent just below the lower quartiles for suppliers and customers was grouped as inward-facing. The supplier-facing (89.7%) and customer-facing (90.5%) groups were very accurately classified. The polar extremes of inward-facing (90.9%) versus outward-facing (96.6%) were the two most accurate classifications.
3.4. Dependent construct measurement
from decreased labor costs and increased throughput. Non-productivity benefits included quality improve-ments and lead-time reductions. In order to capture the multi-dimensional nature of supply chain perfor-mance this study included 19 diverse measures of marketplace, productivity, and non-productivity suc-cess. All metrics were based on reported changes in business unit performance on a percentage improve-ment basis per year.
4. Results and discussion
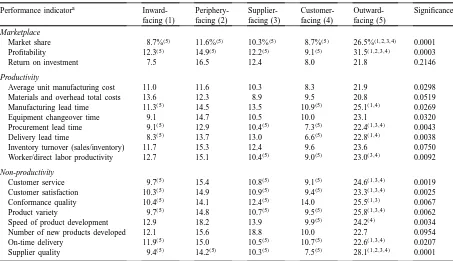
The five arcs of integration representing inward-, periphery-, supplier-, customer-, and outward-facing groups were evaluated using ANOVA and the Scheffé method to test for significant differences between their mean levels of improvements for the 19 performance measures. Table 7 shows that there were numerous significant (p < 0.05) differences between the five different arcs of supply chain integration.
Table 7
ANOVA results for performance measures by arc of integration Performance indicatora
Inward-facing (1)
Periphery-facing (2)
Supplier-facing (3)
Customer-facing (4)
Outward-facing (5)
Significance
Marketplace
Market share 8.7%(5) 11.6%(5) 10.3%(5) 8.7%(5) 26.5%(1,2,3,4) 0.0001
Profitability 12.3(5) 14.9(5) 12.2(5) 9.1(5) 31.5(1,2,3,4) 0.0003
Return on investment 7.5 16.5 12.4 8.0 21.8 0.2146
Productivity
Average unit manufacturing cost 11.0 11.6 10.3 8.3 21.9 0.0298
Materials and overhead total costs 13.6 12.3 8.9 9.5 20.8 0.0519
Manufacturing lead time 11.3(5) 14.5 13.5 10.9(5) 25.1(1,4) 0.0269
Equipment changeover time 9.1 14.7 10.5 10.0 23.1 0.0320
Procurement lead time 9.1(5) 12.9 10.4(5) 7.3(5) 22.4(1,3,4) 0.0043
Delivery lead time 8.3(5) 13.7 13.0 6.6(5) 22.8(1,4) 0.0038
Inventory turnover (sales/inventory) 11.7 15.3 12.4 9.6 23.6 0.0750 Worker/direct labor productivity 12.7 15.1 10.4(5) 9.0(5) 23.0(3,4) 0.0092 Non-productivity
Customer service 9.7(5) 15.4 10.8(5) 9.1(5) 24.6(1,3,4) 0.0019 Customer satisfaction 10.3(5) 14.9 10.9(5) 9.4(5) 23.3(1,3,4) 0.0025
Conformance quality 10.4(5) 14.1 12.4(5) 14.0 25.5(1,3) 0.0067
Product variety 9.7(5) 14.8 10.7(5) 9.5(5) 25.8(1,3,4) 0.0062
Speed of product development 12.9 18.2 13.9 9.9(5) 24.2(4) 0.0034
Number of new products developed 12.1 15.6 18.8 10.0 22.7 0.0954
On-time delivery 11.9(5) 15.0 10.5(5) 10.7(5) 22.6(1,3,4) 0.0207
Supplier quality 9.4(5) 14.2(5) 10.3(5) 7.5(5) 28.1(1,2,3,4) 0.0001 aPercentages shown are percentage improvement in each measure reported per year. Numbers in parentheses indicate group number
from which the group is different (Scheff´e pairwise test with significance level 0.05).
Table 7 leads to four tentative conclusions. First, the outward-facing supply chain strategy is associated with the largest rates of significant performance im-provements. Why was this so? The answer possibly lies in the fact that better coordination in the sup-ply chain reduces uncertainty throughout manufactur-ing networks (Davis, 1993; Lee et al., 1997). Tighter coordination helps eliminate many non-value-adding activities from internal and external production pro-cesses including the seven classic wastes of Shigeo Shingo: overproduction, waiting, transportation, un-necessary processing steps, stocks, motion, and de-fects (Hall, 1987). In terms of supply chains, better coordination directly translates into reduced variabil-ity (Metters, 1997; Lee and Tang, 1998; Grout, 1998) which in turn leads to greater efficiency along with faster delivery of finished goods.
Second, manufacturers may be seriously jeop-ardizing performance by continuing to follow the inward-facing strategy. Schmenner and Swink’s (1998) theory of swift, even flows postulated that the most successful operations smoothly move raw materials and subassemblies through processes and into finished goods. Raw materials, work-in-process, and finished goods only move swiftly if there are no flow impediments in the way, and productivity rises proportionally to the speed that materials move through processes (Schmenner and Swink, 1998). By extension, manufacturers failing to integrate upstream and downstream in their supply chain have little hope of ever completely achieving swift, even flows. Theory thus predicts that performance for relatively isolated operations will suffer, as was the case for the inward-facing manufacturers in this study.
Third, results for the supplier- and customer-facing strategies suggested that focusing on only the inbound or the outbound sides of the supply chain gained little more for manufacturers than adopting the periphery-or inward-facing strategies. Inbound and outbound logistics is often separated in practice with a dispro-portional emphasis on the supply side (Eloranta and Hameri, 1991). Lee and Billington (1992) and Ham-mel and Kopczak (1993) reached similar conclusions concerning the dangers of fragmented supply chains. Lee and Billington (1992) in particular argued that common pitfalls of supply chain management in-cluded incomplete supply chains, poor coordination, inaccurate delivery status data, inefficient information
systems, and ignoring the impact of uncertainties. Conversely, “going beyond the internal supply chain by including external suppliers and customers often exposes new opportunities for improving internal operations” (Lee and Billington, 1992).
Once again, Schmenner and Swink’s (1998) work on operational theory gives us insight into why the supplier- and customer-facing supply chain strategies had lower performance improvement rates than the outward-facing group. Their theory of “Performance Frontiers” holds that every manufacturer has an oper-ating frontier based on a unit’s current performance and an asset frontier defined as the maximum per-formance that can be achieved. The more completely a manufacturer aligns their operating policies with the theoretical capabilities of its assets the greater the eventual performance (Schmenner and Swink, 1998). Findings in this study suggest that supplier and customer-facing manufacturers were not mak-ing full use of their potential by focusmak-ing on only one side of their supply chains. If theory is correct, and performance improvements come from alter-ing manufacturalter-ing policies in ways that move or change the shape of operating frontiers, then broad upstream and downstream supply chain integration appears to be the optimal strategy to follow. Sim-ilarly, supplier- and customer-facing manufacturers are unlikely to achieve their theoretical levels of performance improvement until they take the final step and evolve into the outward-facing supply chain strategy.
Finally, over 40% of the sample was in the facing group. This suggests that periphery-facing may be the supply chain’s natural “equilibrium point” in terms of integration. Many manufacturers have no doubt recognized the dangers of adopting an inward-facing strategy and have evolved into the broader periphery-facing perspective. From there, manufacturers may or may not continue evolv-ing into the supplier, customer, or outward-facevolv-ing strategies.
5. Theoretical conclusions and managerial implications
chain integration strategies that manufacturers fol-lowed. Around the world these different supply chain strategies can be empirically classified into at least five valid types, defined by the direction (towards suppliers and/or customers) and degree of integration. These five groups — inward-, periphery-, supplier-, customer-, and outward-facing — have both intuitive appeal and statistical validity in a reasonably large international database. They can be defined, in terms of the direction and degree of their similar supply chain activities, by their quite different arcs of in-tegration. This classification could be of potential value to future researchers and is capable of fur-ther refinement (e.g. the periphery-facing group — the largest in our study — might yield further sub-classifications).
Second, the greatest degree (or broadest arc) of supply chain integration was strongly associated with higher levels of performance. Although this has been an assumption behind much of the supply chain literature, this is the first time (to the best of our knowledge) that it has been demonstrated empiri-cally with a large international group of companies. The outward-facing group had the highest level of performance improvements while the inward-facing manufacturers recorded some of the lowest. Only the outward-facing manufacturers chose to act upon the powerful benefits of supply chain integration. Perhaps surprisingly, adopting either a supplier- or a customer-facing supply chain strategy had few apparent advantages over the inward-facing strat-egy. This finding helps to validate the metaphor of a supply “chain”, since weak links between suppliers and customers actually appeared to hurt performance.
These findings have some important implications for theory and managerial practice. In terms of theory, it may no longer be enough to consider only the verti-cal alignment of a manufacturing function with busi-ness strategy. Future research should also consider the horizontal degree of upstream and downstream inte-gration as part of operations strategy. This study raises the interesting prospect that manufacturing strategy needs to be aligned across the supply chain not just inside organizations. What happens in a supply chain if one or more manufacturers adopt the inward-facing strategy? Without an over-arching operations strategy, just one isolated manufacturer will likely keep other
firms in the supply chain from achieving their utmost performance.
Similarly, why did the five groups end up with very different supply chain integration strategies? It is too simplistic to say that some groups like the supplier-and customer-facing groups unluckily crafted rela-tively poor manufacturing strategies, but somehow the outward-facing group seemed to have wisely grasped the importance of supply chain integration and incor-porated it into their operations. This raises the impor-tance of the process of formulating and implementing manufacturing strategy. Not only is the content of manufacturing strategy critical, but evidently so is the process through which manufacturers develop a greater appreciation for supply chain integration, synthesize their plans and strategies, and ultimately implement upstream and downstream changes.
The study also has several important implications for managers. First, the outward-facing supply chain strategy appeared to be the best overall approach to follow. The relatively few manufacturers that are already following this approach should therefore con-tinue holding the course and even perhaps increase integration with suppliers and customers wherever possible. Second, manufacturers in the other four groups should begin moving towards more exten-sive supply chain integration. It is not too difficult to imagine what will happen in many industries if and when a series of suppliers, manufacturers, and cus-tomers link together into seamlessly integrated supply chains. Their greater rates of cumulative performance improvements will let them steadily pull away from their more isolated competitors.
6. Supply chain integration and the new millennium
The history of operations management in the 20th century can in some ways be seen as leading to the current emphasis on supply chain integration as the way to compete, since that history has been largely been concerned with ever-increasing spans of control. From Taylor’s pioneering work of 1911 to the IMVP’s lean production study in the 1980’s — the era of “Taylor to Toyota” (Voss, 1995) — has seen the unit of investigation expand from the task of an individ-ual to the activities of a network of firms. Scientific management was concerned primarily with direct la-bor productivity and thus the study of work methods. Lean production was similarly concerned with pro-ductivity, but now involved all the resources of a firm including time itself. It also looked beyond the firm to its suppliers and customers. But in all this long history of development, there is a perennial concern for con-trol, which has required the firm increasingly to look beyond its own boundaries. For example, controlling product quality requires manufacturers to work with suppliers, just as controlling demand patterns requires them to work with their customers. In this millen-nium, enhanced competitiveness not only in control but also in issues such as product design will require that manufacturers increasingly open out their arcs of integration and collaborate within a network of organizations.
New technology is already facilitating such devel-opments. The Internet allows any member of a sup-ply chain to connect to any other organization. In other words, the widest possible arc of integration has rapidly changed from a theoretical concept into an operational reality. Manufacturers can now link to customers using e-commerce on the sell-side of the Internet in what is popularly termed the “Dell direct” model. The more information that manufactur-ers have concerning end consumer’s requirements the simpler supply and demand decisions become (Poirier, 1999) and the lower the risks of stockouts or ob-solete inventory (Fisher and Raman, 1996; Metters, 1997).
Conversely, on the buy-side of the Internet exten-sive electronic supply base management is increas-ingly feasible. For many years now cost and delivery information has been shared between manufacturers
and a few major suppliers using electronic data in-terchange (EDI). But these EDI systems, unlike the Internet, are generally incompatible with each other and expensive to develop and install. Internet technol-ogy, with its world-wide interconnectivity and ease of access, is far less costly and permits many more suppliers, even quite small ones, to be integrated elec-tronically into a supply chain (Evans and Wurster, 1999).
One consequence for supply chain integration of this cheaper, easier Internet communication may be to extend the types of information exchanged. Not only the delivery schedules and billing data of an EDI sys-tem, but also new product ideas, on-line product sup-port material, training aids, and technical knowledge can be transferred. Thus, the nature of collaboration may increase in range and intensity, and a broad arc of integration will be defined in terms of more or dif-ferent variables.
A second consequence of Internet use for supply chain integration, related to the closeness of the re-lationship between firms, is harder to predict. By making collaboration easier and cheaper, the new technology means companies can integrate aspects of their operations more swiftly and collaborate more closely than before. But the open architecture of the Internet means that many more potential suppliers can bid for business, and new collaborations, beyond the circle of favored “partners”, are easily formed. EDI ties companies together with a proprietary link repre-senting substantial investment, but the Internet makes such communications available to everyone. Supply requirements can even be posted on an electronic bul-letin board or supplier network and rival bids easily compared, permitting new rivals to compete in the electronic marketplace. Thus, vendor switching may be as likely as partnership, for the Internet enables both approaches.
planning systems can greatly simplify implementa-tion, so that manufacturers with traditionally narrow arcs of integration now have an opportunity to quickly catch up.
7. Further research
This section makes six suggestions for further re-search, and concludes with a general observation on the significance of the increasing importance of sup-ply chain research for the field of operations manage-ment. Our findings suggests that the following top-ics may be fruitful ones for investigation in further studies.
1. This study draws on data from fabricated metal products, machinery, and equipment manufac-turers. There may be particular characteristics to these supply chains that do not apply to other sectors. Sector specific studies of arcs of integration and their relation to performance improvement will potentially yield different insights.
2. Since this study primarily focused on manufac-turing, future research might also include data from purchasing and marketing representatives to better gauge the degree of supplier and customer integration.
3. Our study takes a snapshot in time of the arc of in-tegration of each firm in the sample, but says noth-ing about the route taken. What are the necessary steps towards a broad arc of integration?
4. Over 40% of the sample was in the periphery-facing group. Is this the natural point of equilibrium in terms of supply chain development? If so what are the forces of inertia that inhibit onward develop-ment into an outward-facing arc of integration, and how can they be overcome?
5. Similarly, it appears that a balanced up- and down-stream approach, like that taken by the pe-riphery and outward facing groups, is associated with higher performance than strategies biased towards customers and suppliers. Should sup-ply chain integration follow specific evolutionary patterns?
6. As discussed above in Section 6, the role of the Internet and supply chain integration seems
potentially profound. How can the new me-dia best be deployed to broaden arcs of in-tegration more swiftly and at less cost than hitherto?
It is to be hoped that other researchers will be at-tracted to such issues. Supply chain management has only relatively recently been recognized as a core topic in OM. Indeed, Pannirselvam et al. (1999) compared OM journal topics in the 1980s and 1990s, but had no category for supply chain management in a list of 17 topics. Nevertheless we believe that the growing evidence linking supply chain integration to perfor-mance improvement, such as we have presented here, will encourage more OM academics to investigate an area which now so much concerns practitioners them-selves.
Finally, what might increased research activity into supply chain management mean for the field of operations management in the new millennium? Such a development could have at least two poten-tial consequences. First, the unit of investigation will increasingly not be the firm but the network of col-laborating companies (Fisher, 1997). This will surely present an extra layer of difficulty to whichever re-search method is employed. In the case of empirical studies, it means that the next generation of re-search will likely involve data collection from more than one unit along the supply chain to provide the multiple perspectives that bring us closer to scien-tific validity. Second, if supply chain management continues to be, as this and other studies suggest, a key source of competitive excellence, then the prospect is for operations management practice (and study) to be seen as an even more crucial and de-cisive business discipline than perhaps was the case in the past. Many of us in the field would happily accept the first of these suggested consequences in return for the second. That is, we will take on the burden of an increasingly complex research task, encouraged by the prospect of our subject playing an even more central role in business during the 21st century.
Appendix A. Integration measures
With suppliers With customers
None Extensive None Extensive
Access to planning systems 1 2 3 4 5 1 2 3 4 5
Common use of logistical equipment/containers 1 2 3 4 5 1 2 3 4 5
Common use of third-party logistical services 1 2 3 4 5 1 2 3 4 5
References
Anderson, M.G., Katz, P.B., 1998. Strategic sourcing. International Journal of Logistics Management 9 (1), 1–13.
Armistead, C.G., Mapes, J., 1993. The impact of supply chain integration on operating performance. Logistics Information Management 6 (4), 9–14.
Birou, L.M., Fawcett, S.E., Magnan, G.M., 1998. The product life cycle: a tool for functional strategic alignment. International Journal of Purchasing and Materials Management 34 (2), 37– 51.
Bowersox, D.J., Daugherty, P.J., 1995. Logistics paradigms: the impact of information technology. Journal of Business Logistics 16 (1), 65–80.
Bowersox, D.J., Daugherty, P.J., Droge, C.L., Rogers, D.S., Wardlow, D.L., 1989. Leading edge logistics: competitive positioning for the 1990s. Council of Logistics Management, Oak Brook, IL.
Burgess, R., 1998. Avoiding supply chain management failure: lessons from business process reengineering. International Journal of Logistics Management 9 (1), 15–23.
Burt, D.N., Doyle, M.F., 1992. The American keiretsu, Business One: Irwin, Homewood, IL.
Cammish, R., Keough, M., 1991. A strategic role for purchasing. The McKinsey Quarterly 3, 22–39.
Carothers, G., Adams, M., 1991. Competitive advantage through customer value: the role of value-based strategies. In: Stahl, M.J., Bounds, G.M. (Eds.), Competing Globally through Customer Value, Quorum Books, New York, pp. 32–66. Chapman, S., Carter, P., 1990. Supplier/customer inventory
relationships under just-in-time. Decision Sciences 21 (1), 35– 51.
Chen, S., Chen, R., 1997. Manufacturer–supplier relationship in a JIT environment. Production and Inventory Management Journal First Quarter, 58–64.
Clinton, S.R., Closs, D.J., 1997. Logistics strategy: does it exist? Journal of Business Logistics 18 (1), 19–44.
Davis, T., 1993. Effective supply chain management. Sloan Management Review Summer, 35–46.
Dillman, D.A., 1978. Mail and Telephone Surveys: The Total Design Method. Wiley, New York, NY.
Dyer, J.H., Ouchi, W.G., 1993. Japanese-style partnerships: giving companies a competitive edge. Sloan Management Review 35 (1), 51–63.
Eisenhardt, K.M., Tabrizi, B.N., 1994. Accelerating adaptive processes: product innovation in the global computer industry. Administrative Science Quarterly 40 (1), 84–110.
Eloranta, E., Hameri, A-P., 1991. Experiences of different approaches to logistics. Engineering Cost and Production Economics 21, 155–169.
Ettlie, J.E., 1998. R&D and global manufacturing performance. Management Science 44 (1), 1–11.
Evans, P., Wurster, T.S., 1999. Blown to Bits: How the New Economics of Information Transforms Strategy. Harvard Business School Press, Boston, MA, pp. 174–175.
Fisher, M.L., 1997. What is the Right Supply Chain for your Product? Harvard Business Review, March–April, pp. 105–116. Fisher, M.L., Raman, A., 1996. Reducing the cost of demand uncertainty through accurate response to early sales. Operations Research 44 (1), 87–99.
Fisher, M.L., Hammond, J.H., Obermeyer, W.R., Raman, A., 1994. Making Supply Meet Demand in an Uncertain World. Harvard Business Review, May–June, pp. 83–93.
Fliedner, G., Vokurka, R.J., 1997. Agility: competitive weapon of the 1990s and beyond? Production and Inventory Management Journal Third Quarter, 19–24.
Flynn, B.B., Sakakibara, S., Schroeder, R.G., Bates, K.A., Flynn, E.J., 1990. Empirical research methods in operations management. Journal of Operations Management 9 (2), 250– 284.
Flynn, B., Sakakibara, S., Schroeder, R.G., 1995. Relationship between JIT and TQM: practices and performance. Academy of Management Journal 38 (5), 1325–1360.
Freeman, V.T., Cavinato, J.L., 1990. Fitting purchasing to the strategic firm: framework, processes, and values. Journal of Purchasing and Materials Management Winter, 6–10. Gattorna, J., 1998. Fourth-part logistics: en route to breakthrough
performance in the supply chain. In: Gattorna, J. (Ed.), Strategic Supply Chain Alignment, Gower, Aldershot, pp. 425–445. Ghoshal, S., Bartlett, C., 1995. Changing the Role of Top
Grout, J.R., 1998. Influencing a supplier using delivery windows: its effect on the variance of flow time and on-time delivery. Decision Sciences 29 (3), 747–764.
Hale, B.J., 1999. Logistics perspectives for the new millenium. Journal of Business Logistics 20 (2), 5–7.
Hall, R.W., 1987. Attaining Manufacturing Excellence. Dow Jones-Irwin, Homewood, IL.
Hammer, M., 1996. Beyond Reengineering. Harper Business, New York, NY.
Hammer, M., Champy, J., 1993. Reengineering the Corporation. Harper Business, New York, NY.
Hammel, T.R., Kopczak, L.R., 1993. Tightening the supply chain. Production and Inventory Management Second Quarter, 63–70. Handfield, R.B., Nichols, E.L., 1999. Introduction to Supply Chain
Management. Prentice-Hall, Upper Saddle River, NJ. Hayes, R.H., Wheelwright, S.C., 1984. Restoring our Competitive
Edge Competing through Manufacturing. Wiley, New York, NY. Hines, P., Rich, N., Bicheno, J., Brunt, D., 1998. Value stream management. International Journal of Logistics Management 9 (1), 25–42.
Jayaram, J., Vickery, S.K., 1998. Supply-based strategies, human resource initiatives, procurement lead-time, and firm performance. International Journal of Purchasing and Materials Management Winter, 12–23.
Johnson, J.L., 1999. Strategic integration in distribution channels: managing the interfirm relationship as a strategic asset. Academy of Marketing Science Journal 27 (1), 4–18. Kim, J., Mueller, C.W., 1978. Factor analysis: Statistical Methods
and Practical Issues. Sage Publications, Newbury Park. Landry, S., Duguay, C.R., Chausse, S., Themens, J., 1997.
Integrating MRP, kanban, and bar-coding systems to achieve JIT procurement. Production and Inventory Management Journal First Quarter, 8–13.
Langley, C.J., Holcomb, M.C., 1992. Creating logistics customer value. Journal of Business Logistics 13 (2), 1–27.
Lastovicka, J.L., Thamodaram, K., 1991. Common factor score estimates in multiple regression problems. Journal of Marketing Research 28, 105–112.
Lee, H.L., 1998, Postponement for mass customization. In: Gattorna, J. (Ed.), Strategic Supply Chain Alignment. Gower, Aldershot, pp. 77–91.
Lee, H.L., Billington, C., 1992. Managing supply chain inventory: pitfalls and opportunities. Sloan Management Review Spring, 65–73.
Lee, H.L., Tang, C.S., 1998. Variability reduction through operations reversal. Management Science 44 (2), 162–172. Lee, H.L., Padmanabhan, V., Whang, S., 1997. Information
distortion in a supply chain: the bullwhip effect. Management Science 43 (4), 546–558.
Leender, M.R., Blenkhorn, D.L., 1988. Reverse Marketing. The Free Press, New York.
Lewis, I., Talalayevsky, A., 1997. Logistics and information technology: a coordination perspective. Journal of Business Logistics 18 (1), 141–157.
Littler, D., Leverick, F., Bruce, M., 1995. Factors affecting the process of collaborative product development: a study of UK manufacturers of information and communications technology products. Journal of Product Innovation Management 12 (1), 16–23.
Lummus, R.R., Vokurka, R.J., Alber, K.L., 1998. Strategic supply chain planning. Production and Inventory Management Journal 39 (3), 49–58.
Martin, C., 1992. Logistics and Supply Chain Management. Financial Times, London.
Marvick, D., White, J., 1998. Distribution operations: managing distribution facilities for strategic advantage. In: Gattorna, J. (Ed.), Strategic Supply Chain Alignment. Gower, Aldershot, pp. 355–368.
McClave, J.T., Benson, P.G., 1985. Statistics for Business and Economics. Collier Macmillan, London, pp. 93–94.
McGinnis, M.A., Kohn, J.W., 1990. A factor analytic study of logistics strategy. Journal of Business Logistics 11 (1), 41–63. McGinnis, M.A., Kohn, J.W., 1993. Logistics strategy, organizational environment, and time competitiveness. Journal of Business Logistics 14 (1), 1–23.
Metters, R., 1997. Quantifying the bullwhip effect in supply chains. Journal of Operations Management 15, 89–100.
Morris, M.H., Calantone, R.J., 1991. Redefining the purchasing function: an entrepreneurial perspective. International Journal of Purchasing and Materials Management Fall, 2–9.
Narasimhan, R., Carter, J.R., 1998. Linking business unit and material sourcing strategies. Journal of Business Logistics 19 (2), 155–171.
Narasimhan, R., Jayaram, J., 1998. Causal linkages in supply chain management: an exploratory study of North American manufacturing firms. Decision Sciences 29 (3), 579–605. New, S.J., 1996. A framework for analysing supply chain
improvement. International Journal of Operations and Production management 16 (4), 19–36.
Nunnally, J.C., 1978. Psychometric Theory, 2nd Edition. McGraw-Hill, New York, NY.
O’Leary-Kelly, S.W., Vokurka, R.J., 1998. The empirical assessment of construct validity. Journal of Operations Management 16, 387–405.
Pagh, J.D., Cooper, M.C., 1998. Supply chain postponement and speculation strategies: how to choose the right strategy. Journal of Business Logistics 19 (2), 13–33.
Pannirselvam, G.P., Ferguson, L.A., Ash, R.C., Siferd, S.P., 1999. Operations management research: an update for the 1990s. Journal of Operations Management 18 (1), 95–112.
Poirier, C.C., 1999. Advanced Supply Chain Management. Berret-Koehler Publishers, San Francisco, CA, pp. 113–132. Ragatz, G.L., Handfield, R.B., Scannell, T.V., 1997. Success factors
for integrating suppliers into new product development. Journal of Product Innovation Management 14, 190–202.
Reck, R.F., Long, B.G., 1988. Purchasing: a competitive weapon. Journal of Purchasing and Materials Management Fall, 2–8. Sakakibara, S., Flynn, B., Schroeder, R.G., 1997. The impact
of just-in-time manufacturing and its infrastructure on manufacturing performance. Management Science 43 (9), 246– 1257.
Saraph, J.V., Benson, P.G., Schroeder, R.G., 1989. An instrument for measuring the critical factors of quality management. Decision Sciences 20 (4), 810–829.
Schmenner, R.W., Swink, M.L., 1998. On theory in operations management. Journal of Operations Management 17, 97–113. Shapiro, J.F., Singhal, V.M., Wagner, S.N., 1993. Optimizing the
value chain. Interfaces 23 (2), 102–117.
Sheombar, H.S., 1992. EDI-induced redesign of coordination in logistics. International Journal of Physical Distribution and Materials Management 22 (8), 4–14.
Stevens, J., 1989. Integrating the supply chain. International Journal of Physical Distribution and Materials Management 19 (8), 3–8. Syson, R., 1989. Improving Purchasing Performance. Pitman
Publishing, London.
Tan, K.C., Kannan, V.R., Handfield, R.B., 1998. Supply chain management: supplier performance and firm performance. International Journal of Purchasing and Materials Management Summer, 2–9.
Trent, R.J., Monczka, R.M., 1998. Purchasing and supply management: trends and changes throughout the 1990s. International Journal of Purchasing and Materials Management Fall, 2–11.
Van Hoek, R.I., Commandeur, H.R., Voss, B., 1998. Reconfiguring logistics systems through postponement strategies. Journal of Business Logistics 19 (1), 33–54.
Voss, C.A., 1988. Success and failure in advanced manufacturing technology. International Journal of Technology Management 3 (3), 285–296.
Voss, C.A., 1995. Operations management — from Taylor to Toyota — and beyond? British Journal of Management 6, 17– 30.
Voss, C.A., Blackmon, K., 1998. Differences in manufacturing strategy decisions between Japanese and Western Manufacturing Plants: the role of strategic time orientation. Journal of Operations Management 16 (2/3), 147–158.
Walton, S.V., Marucheck, A.S., 1998. The relationship between EDI and supplier reliability. International Journal of Purchasing and Materials Management Summer, 30–35.