STOCK AND FISHERY ASSESSMENT REPORT OF BLUE SWIMMING
CRAB
PORTUNUS PELAGICUS
(LINNAEUS, 1758)
IN KIEN GIANG WATERS, VIET NAM
Vu Viet Ha, Tu Hoang Nhan, Tran Van Cuong and Nguyen Sy Doan
Department of Marine Fisheries Resources Research
Research Institute for Marine Fisheries
2
This Report was reviewed by
1. Richard Bank
Moody Marine Limited
13 Ribbon Avenue, Port Douglas, QLD 4877, Australia
2. Cameron Dixon
WWF Australia
Level 1, 1 Smail Street
Ultimo NSW 2007 PO Box 528
3
TABLE OF CONTENTS
LIST OF TABLES, FIGURES AND APPENDICES ... 4
ACKNOWLEDGMENTS ... 7
1. INTRODUCTION ... 8
Overview ... 8
Discription of Blue Swimming Crab ... 8
Biology ... 9
2.2.1. Biological data analysis ... 18
+ Size distribution ... 18
+ Growth ... 18
+ Size – weight relationship ... 18
+ Size at first maturity ... 18
+ Sex ratio and Spawning season ... 19
2.2.2. Catch – Fishing Effort ... 19
2.2.3. Biomass estimation ... 19
3. RESULTS AND DISCUSSION ... 20
3.1. Stock assessment ... 20
4
3.1.2. Length – weight relationship ... 26
3.1.3. Biomass estimation ... 28
3.2. Reproductive biology ... 31
3.2.1. Sex ratio ... 31
3.2.2. Size – maturity stage distribution ... 31
3.3. Fisheries ... 34
3.3.1. Catches and Fishing Effort... 34
3.3.2. Fishing Ground ... 39
3.3.3. Bycatch ... 41
CONCLUSION ... 44
REFERENCES ... 45
APPENDICES ... 48
LIST OF TABLES, FIGURES AND APPENDICES
Table 1. Numbers of BSC individuals were analyzed in 2013 ... 17Table 2. Average size (CW, mm) of BSC sampled from catch of crab fishing boats in landing sites along the coast of Kien Giang Province ... 23
Table 3. Growth parameters of BSC in some regions ... 26
Table 4. Stock biomass of BSC in Kiên Giang waters in 2013 ... 30
Table 5. Size at first maturity (CW50, mm) of BSC in some regions ... 34
Table 6. Number of crab fishing boats in Kien Giang water in 2013 (Source: DARD Kien Giang, 2013) ... 34
Table 7. Catch proportion of BSC (%) and average standard catch rate (kg/net panel) of gillnet in Kien Giang in 2013 ... 37
Table 8. Catch proportion of BSC (%) and average standard catch rate (kg/100traps) of the trap fishing fleets in Kien Giang in 2013 ... 38
5 Table 10. List of species caught in the catch of gillnet and traps based on the observer trips (+: rare seen; ++: not frequently seen; +++: frequently seen) ... 41
Figure 1. Photos of Blue Swimming Crab: upper: male and lower: female. Taken by Vu Viet Ha in Ham Ninh landing site, Phu Quoc District, Kien Giang Province during the survey on March 2013 ... 9
Figure 2. Lifecycle of blue swimming crab (Portunus pelagicus) ... 10
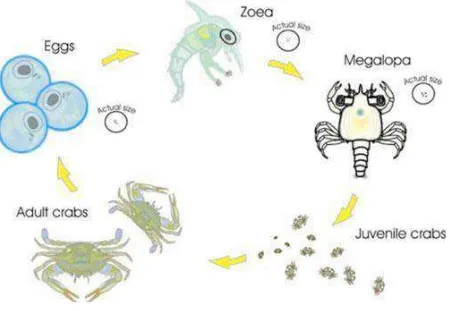
Figure 3. Kien Giang waters and locations of the sampling sites for BSC ... 15
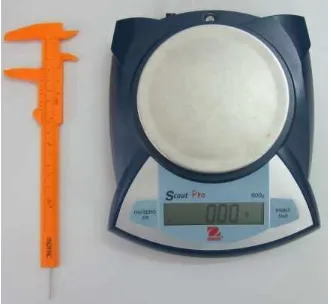
Figure 4. Panme ruler on the left and electric weight scale on the right used in biological samplings ... 16
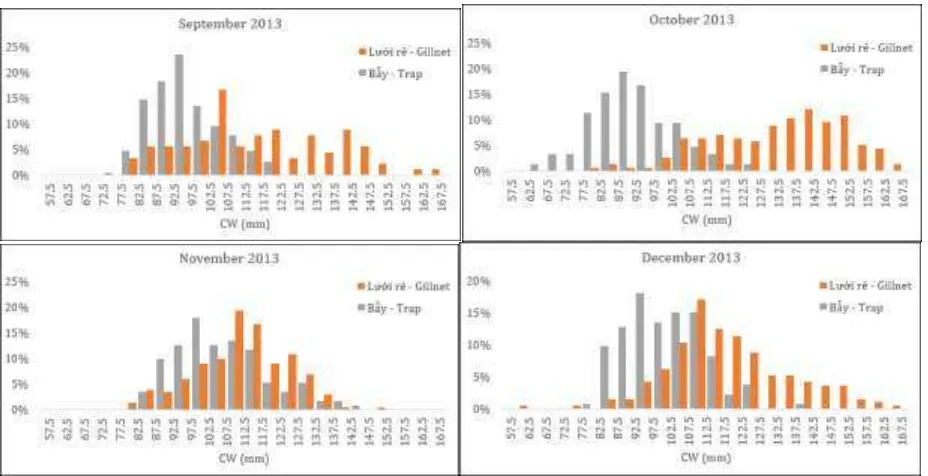
Figure 5. Monthly length (CW) frequency distribution of BSC caught by gillnet and trap in Kiên Giang in 2013 ... 22
Figure 6. Monthly variation in the mean size of the BSC in Kiên Giang water in 2013 ... 23
Figure 7. Length (CW) frequency and von Bertalaffy growth curve of BSC in Kien Giang water. ... 24
Figure 8. Length (CW) frequency and von Bertalaffy growth curve of female BSC in Kien Giang water. ... 25
Figure 9. Length (CW) frequency and von Bertalaffy growth curve of male BSC in Kien Giang water. ... 25
Figure 10. Carapace width and weight relationships of BSC in Kien Giang waters based on the data collected in 2013. Data was logarithsm ... 27
Figure 11. Carapace length and weight relationships of BSC in Kien Giang water sbased on data collected in 2013. Data was logarithsm ... 28
Figure 12. Carapace length and carapace width relationships of BSC in Kien Giang water sbased on data collected in 2013. Data was logarithsm ... 28
Figure 13. Length converted Catch curve of BSC in Kien Giang waters in 2013 (Left: Both sexes; middle: female; right: male) ... 29
6 Figure 15. Berverton & Holt Yield per Recruiment model of BSC in Kien Giang waters in 2013 ... 30
Figure 16. Fluctuation of male/female ratio of the BSC in Kien Giang waters ... 31
Figure 17. Proportion of gonad maturity stages by length groups of BSC in Kien Giang waters in 2013 ... 32
Figure 18. Monthly variation of gonad maturity ratio and gonado somatic index (GSI) of BSC in Kien Giang water s in 2013 ... 33
Figure 19. Relationship between percentage of maturity stage and size of BSC in Kien Giang waters in 2013 ... 33
Figure 20. Boat Activity Coefficient (BAC) in BSC fisheries in Kien Giang in 2013 ... 36
Figure 21. Fluctuation of fishing day/month and monthly catch rate (kg/day) of gillnet and trap fishing fleets in Kien Giang. ... 36
Figure 22. Plots of catch rates of the gillnet fishing fleets <20HP, >20HP and trap <20HP, >20HP in Kien Giang in 2013 ... 38
Figure 23. Fishing grounds of crab gillnet fishing fleets in Kien Giang in 2013 (fleet <20CV: left; fleet >20CV: right) ... 40
Figure 24. Fishing grounds of trap fishing fleets in Kien Giang in 2013 (trap fleet <20CV: left; Chinese trap fleet <20CV: middle; Chinese trap fleet >20CV: right) ... 40
Appendix 1. Discriptive statistics of BSC samples collected from catches of gillnets and traps fisheries in Kien Giang Province ... 48
7
ACKNOWLEDGMENTS
8
1. INTRODUCTION
Overview
The report on stock assessment of Blue Swimming Crab (BSC) Portunus pelagicus, Linnaeus 1758, was prepared based on the MOU between WWF Vietnam, VASEP Crab Council, Department of Agricultural and Rural Development of Kien Giang and Research Institute for Marine Fisheries dated 01/10/2012 about the implementation of the activities “Stock assessment of blue swimming crab in Kien Giang waters” within the project “Fisheries Improvement Project for the Blue Swimming Crab in Kien Giang, Vietnam”.
BSC fisheries is important to the coastal fishing communities in Southwest waters of Vietnam, especially in Kien Giang Province with more than 3.800 crab fishing boats targeted on BSC and dozen thousand of labors working directly in this fisheries (Sở NN&PTNT Kiên Giang, 2010). Total catch of BSC was estimated about 11.3 thousand tons in 2008 (Thúy, 2010) and showed the signals of the decreasing trend due to the high fishing effort in recent years.
Up to date, there was no study on the biology, fisheries and stock assessment of BSC not only Kien Giang waters but also in the Sea of Vietnam. This activities is considered as the first study on the stock assessment and biological information collection of BSC in Vietnam.
Discription of Blue Swimming Crab
The BSC Portunus pelagicus, Linnaeus 1758 belongs to the Phylum
Arthropoda, Class Malacostraca, Order Decapoda and Family Portunidae and the local name is “Ghẹ xanh”.
Portunus pelagicus has 5 pairs of legs, the body is flat. The first pair of legs
was modified to be claws, which are biggest legs, which perform the protection, attach and predation functions. There are spines on the upper part of the 2 claws.
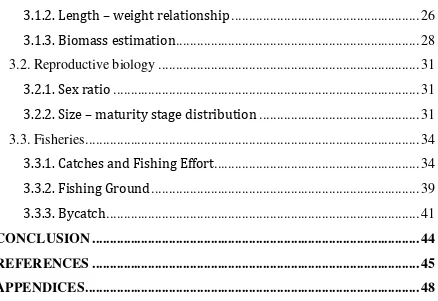
9 sharp, and hard. Male crab are bright blue with white spots and featured longe claws. Female crab are brown, green staining and more rounded carapace (Figure 1). These characteristics are used to identify male and female crabs with the view from
carapace.
Figure 1. Photos of Blue Swimming Crab: upper: male and lower: female. Taken by Vu Viet Ha in Ham Ninh landing site, Phu Quoc District, Kien Giang Province during the survey on March 2013
BSC is widely distributed in tropical waters. They appear from intertidal zone
to the depth of 50m throughout the Indo – West Pacific. They occur in mangrove, sea grass, coral reef habitats and estuaries, on both sandy and muddy bottoms, concentration in the depth range of 5-25m (Williams, 1982, Edgar, 1990, Clarke &
Ryan, 2004). In Vietnam, BSC is distributed throughout the coastal waters from North to South and aggregated densely in Kien Giang waters.
Biology
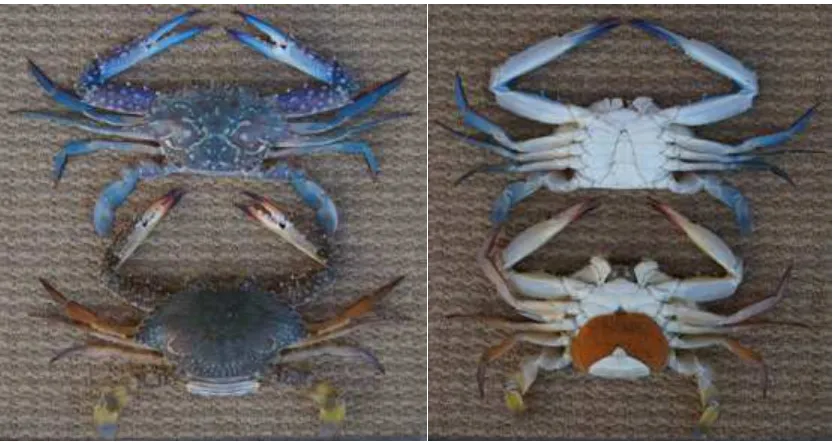
The life cycle of BSC spends five stages throughout (Figure 2), including eggs, zoea larvae, megalopa larvae, juvenile crab and adult crab. Zoea larvae,
hatching from eggs, has a length of about 0.04 mm. At this stage, zoea larvae is drifting freely in the surface water layer and can drift away 80 km from the
10 small size, live passive and drifting. Megalopa larvae will undergo 5-7 times of metamorphosis. When reaching the size of 0.4 mm, megalopa larvae begins migrating into the estuaries where there are more nutrients to grow. When megalopa
larvae turn to the young crab stage, they move to a higher salinity area. The main food at this stage zooplankton. After about 1 week, the megalopas develop to
juvenile crab. At this stage, the crabs live in the mud bottom and migration from the spawning ground in the coast to the sea, living mainly in the seagrass beds. After 12 to 18 months, phase 1 crab grow into adult, sexually mature and enter the spawning
stage to create the next generation.
Figure 2. Lifecycle of blue swimming crab (Portunus pelagicus)
11 male and female crabs in each stage of the life cycle. After the spawning season, the small crabs usually habit in the mangrove or seagrass areas. When grown up, the female crabs migrate to the estuary or coastal areas (Kamrani et al., 2010, Weng, 1992, Meagher, 1971). When matured, the BSC move to the deeper waters to release eggs (Potter et al., 1983).
BSC reached adult size in about one year old (Smith, 1982). The growth rate
of BSC differs among regions and depends on the temperature (Campbell & Fielder, 1986, Sukumaran & Neelakantan, 1996). The smallest mature size of female crab
observed at 89 mm (CW) (Potter & Lestang, 2000) while it is 94mm (CW) in Leschenault Estuary. The size at first maturity (CW50) of male and female BSC in
the Peel-Harvey is 84mm and 98 mm (CW), respectively while in the Leschenault
Estuaries it is estimated at 88mm (CW) for the male and 97 mm (CW) for the female. In India waters, the ripe size of male and female crabs is in the ranges from
85-90 mm and 80-90mm (CW), respectively (Sukumaran & Neelakantan, 1996).
BSC gets ripe and produce continuously during the year in tropical and sub-tropical waters (Campbell & Fielder, 1986, Potter et al., 1983), whereas in temperate waters, the breeding season is limited to the summer only (Potter et al., 1983, Smith,
1982, Penn, 1977).
Fisheries
The BSC fisheries in the Kien Giang waters is localised to the districts of Ha Tien, Kien Luong, Hon Dat and Phu Quoc Island. Fishers are located in a number of small village communities along the coast, living rely on this fisheries. They use small fishing boats to fish for BSC both day and night. Most of fishing boats engaged in BSC fisheries in Kien Giang are equiped small engine, 20-33HP. According to the statistic figures in 2009, a total of 3.823 fishing boats engaged crab fisheries in Kiengiang (Sở NN&PTNT Kiên Giang, 2010). Gillnet and Trap are main fishing gears targeted in BSC. Fishermen normally use the gillnet of about 10 km long for the boats with engine <20HP and up to 45 km long for the fishing boats equiped bigger engine. The stretched mesh (2a) of gillnet varies from 70-90mm.
12 Stock and fisheries assessments for BSC haven’t been conducted previously in Vietnam. The catch of BSC was occationally mentioned in technical reports of the bottom trawl surveys by the Research Institute for Marine Fisheres (RIMF) before. Results from the bottom trawl surveys showed that the BSC distributes widely in the coastal waters of Vietnam, from the Tonkin Gulf, Central waters, Southeast and Southwest waters. However the proportion of BSC in catches is relatively low or negligible since the BSC was the non-target species of this gear.
In 2013, under the financial support from WWF Vietnam, Department of Agriculture and Rural Development of Kien Giang has conducted an frame survey on BSC fisheries. Results indicated that there are 1,718 fishing units registered for BSC fisheries in the whole province with 949 fishing boats equipped with the engine ≤20HP and 769 units motorized the engine >20HP (Sở NN&PTNT Kiên Giang, 2013). There are 1,337 fishing boats engaged with gillnet fisheries and 381 units using the trap fisheries.
Management
Management measures based on stock assessment and referent points have not been applied in any fisheries in Vietnam yet. Currently, fisheries management in Vietnam was made based on the clossing season and size limitations of target species or nets. Circular 02/2006/TT-BTS dated March 20th, 2006 issued by the Ministry of Fisheries, guiding on the implementation of Decree No. 59/2005/ND-CP May 4th, 2005 of the Government on the Production, Trading conditions on some
fisheries are one of first writing document in fisheries management in Vietnam. It is mentioned that every year, the fishing activities are banned in the period of 1st April to 30th June on the coastal areas and the minimum size for harvesting of BSC is 100 mm carapace width. The stretched mesh (2a) of the gillnet is not less than 90mm.
Currently, the BSC fishery is heavily exploited (per.com.). An MSC pre-assessment of the BSC fishery identifies its status as medium risk citing the principle issues as:
• Limited knowledge on stock status; • No harvest strategy
• Limited application of harvest control tools; • Inadequacy in information systems;
13 • Weaknesses in decision making and consultation processes; and
• Limited enforcement.
To protect the BSC resource in Kien Giang waters in the direction of
maintaining ecologically sustainable production, WWF Vietnam, VASEP Crab Council, Department of Agriculture and Rural Development of Kien Giang and the
Research Institute of Marine Fisheries are cooperating to conduct the project "Assessment of the blue swimming crab resources in Kien Giang, Vietnam" aiming to achieve scientific basis for management, contributing to sustainable development
of the blue swimming crab fishery in Kien Giang.
2. MATERIALS AND METHODS
2.1. Data sampling
2.1.1. Landing survey
Information on catch and effort of BSC fisheries is collected monthly by local collaborators in fisheries communities of Ha Tien, Kien Luong, Phu Quoc and Kien
Hai districts using sampling in time and space approach (Constantine, 2002). During month, local collaborators go to fisheries communities to interview fishermens about fishing activities as fishing ground, catch of BSC and non-target
species, trip duration, number of trip per month, active day per month and information on net/trap used for the fishing trips. Each month, 32 forms will be
collected from each fishing fleet. Total number of forms collected monthly will be 128 (2 gears x 2 fleets/gear x 32 forms/fleet = 128 forms). By end of the month, all forms will be sent to RIMF for encoding into the BSC database.
2.1.2. Logbook
14 Thus, the total number of logbook distributed and collected back are 64 (2 fishing gears x 32 logbooks/gear = 64 logbooks).
2.1.3. Observer
On board observation of BSC fisheries has been done by RIMF scientists. Observers record all information related to fishing hauls, including fishing location, fishing time, species composition, species catches and sizes. In 2013, 4 observer trips with 10-15 days/trip were conducted in January, April, August and October on the gillnet and trap fishing boats.
2.1.4. Biological sampling
15
Figure 3. Kien Giang waters and locations of the sampling sites for BSC
BSC samples was analyzed individually for sex, carapace length (CL, mm), carapace width (CW, mm), body weight (W) and gonad weight (Wg). CL and CW
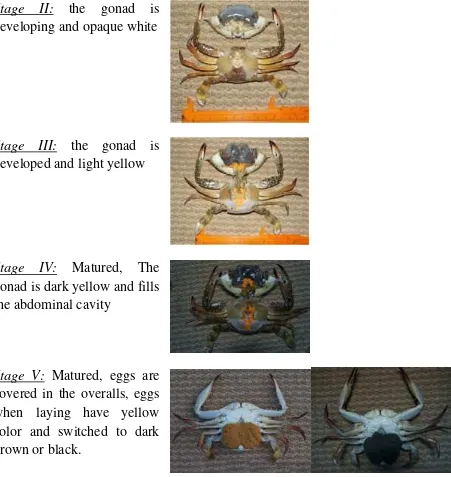
16 weighted to 0,01 gram using electric weight scale. Gonad maturity stage was determined using the scale of 5 level as discribed by Sumpton et al (1994).
Figure 4. Panme ruler on the left and electric weight scale on the right used in biological samplings
17 Stage II: the gonad is
developing and opaque white
Stage III: the gonad is developed and light yellow
Stage IV: Matured, The gonad is dark yellow and fills the abdominal cavity
Stage V: Matured, eggs are covered in the overalls, eggs when laying have yellow color and switched to dark brown or black.
In 2013, total 3.800 BSC individuals were collected and analyzed (Table 1).
Table 1. Numbers of BSC individuals were analyzed in 2013
Month Gillnet Trap Total
January 128 153 281
February 129 169 298
March 143 129 272
April 146 129 275
May 155 178 333
18
Size distribution of BSC were analyzed by the descriptive statistics method.
+ Growth
coefficient; to is the theory assumed carapace width at age 0.
+ Size – weight relationship
Length – weight relationship of BSC is fitted using power regression for male and female BSC separately: W = a.CLb and W = a.CWbfor for the carapace
length and carapace width with weight. Where CL is carapace length, CW is
carapace width, a is anabonism and b is catabonism. The size – weight relationship
of male and felmale is tested using MANCOVA.
19 + Sex ratio and Spawning season
The ratio of male/female and the percentage of gonad maturity stages of BSC population was analyzed monthly by descriptive statistics method. Spawning season of BSC is inferred based on the fluctuations of Gonado Somatic Index (GSI) and the proportion of the gonad maturity stages. GSI of BSC is identified as
Status of BSC exploitation in Kien Giang waters is analyzed, evaluated using the fisheries indicators (Constantine, 2002), including: fishing effort (average number of fishing days per month, the number of fishing vessels, Boat Activity Coeffiecient (BAC), fishing time), catch rate, catch components, total catches and fishing grounds.
Catch per Unit Effort (CPUE, kg per day) is analyzed for each fishing fleet as
� � = �� � �̅̅̅̅̅̅̅̅̅ =� �∗ ∑��= � �, where Ci is the catch (kg) of the
fishing trip i and Di is number of fishing days in the trip i. The mean active day per
month per month is estimated as � =∑ � �
�� In which, ADi is number of fishing
days in the previous month of the fishing fleet.
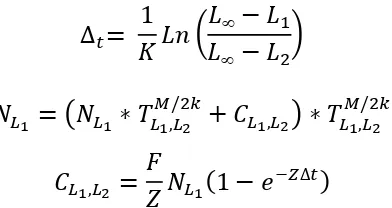
Total catch of BSC is sum of the catches of each fleet (Constantine, 2002). (LCA), based on length frequency data, growth parameters, mortality and total catch of species in a year Jones (1981). First, the length groups (carapace width) are converted to age groups based on the von Bertalanffy function:
� = � − 1 � (1 −
20
Bertalanffy growth equation; CL1,L2 is number of individuals between length L1 and
L2 that are caught; NL1, NL2 are number of individuals that survive to reach length L1
and L2, TL1,L2 is fraction representative for the time interval at length L1 and L2, Z is
total mortality estimated as fishing mortality (F) plus natural mortality (M).
Fishing mortality is calculated by = �/� temperature in Kiengiang waters is 28.7oC.
22
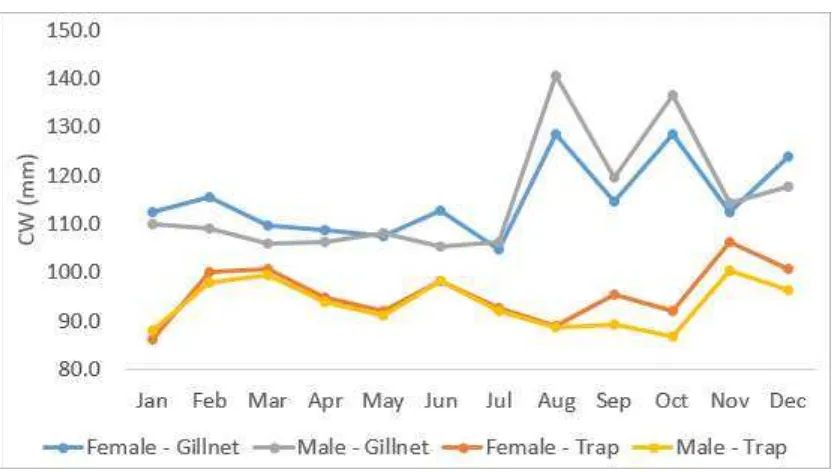
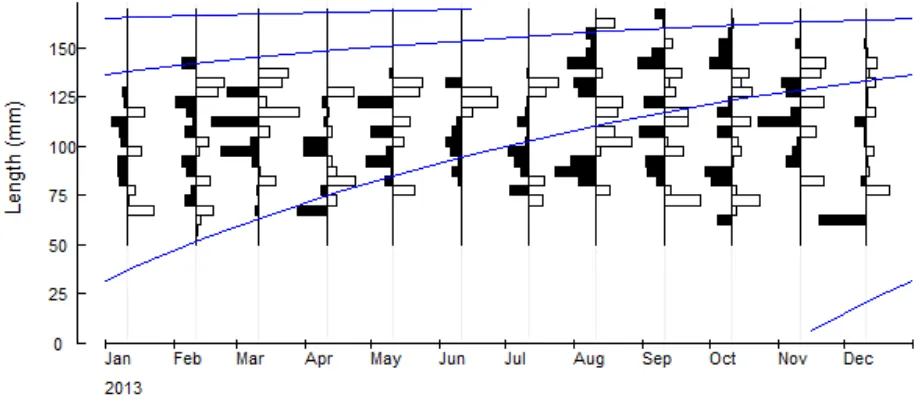
Figure 5. Monthly length (CW) frequency distribution of BSC caught by gillnet and trap in Kiên Giang in 2013
Average size of BSC exploitated by gillnets was quite stable during the period from January to July 2013, mainly in the range of 105 - 115mm. From August, the size of BSC captured was bigger and varied in a large interval. In contrast, catches from traps shows that sizes felt in a stable range without fluctuation between months. The mean size varied in the range of 85 - 100mm.
23
Figure 6. Monthly variation in the mean size of the BSC in Kiên Giang water in 2013
The sizes of BSC fished in different fishing grounds of Kien Giang waters were difference. BSC caught in Kien Luong have the smallest size. Average size of BSC exploited by gillnets was 105.7mm (CW) and by trap was 95.1mm (CW). BSC caught in Bai Bon and Ham Ninh were bigger than that in Kien Luong with average size of 96.0mm for trap and 110.3mm for gillnets (Table 2).
BSC caught around Nam Du and Hon Thom Island is bigger than that captured in other regions since the fishing grounds are more deeper. Average captured size (CW) reached 137.2mm. The biggest size was measured at 142.4mm in December and the smallest size was 134.7mm in August.
In Ha Tien area, BSC were caught mainly by traps. The average size was 95.1mm (CW). In 2013, from the beginning of southwest monsoon season, most crab fishing boats changed to fish jellyfish.
Table 2. Average size (CW, mm) of BSC sampled from catch of crab fishing boats in landing sites along the coast of Kien Giang Province
Sampling time
Nam Du & Hon Thom Bai Bon & Ham Ninh Ha Tien Kien Luong
Gillnet Gillnet Trap Trap Gillnet Trap
Jan 111.1 87.4
Feb 112.8 98.8
Mar 108.1 100.1
Apr 107.4 94.4
24
Sampling time
Nam Du & Hon Thom Bai Bon & Ham Ninh Ha Tien Kien Luong
Gillnet Gillnet Trap Trap Gillnet Trap
Jun 108.5 98.4
Jul 105.7 92.6
Aug 134.7 88.7 89.0
Sep 136.5 104.1 93.1
Oct 139.5 107.4 89.4
Nov 113.5 105.2 98.2
Dec 142.4 114.7 98.4
Average 137.2 110.3 96.0 95.1 105.7 91.1
Using the ELEFAN I method for fitting von Bertalanfy growth function to the length frequency of BSC, the von Bertalanffy growth equation for BSC has the form of 175.88 (1 0.99(t t0))
t e
CW and the growth performance index is ø’= 4,486.
For the female, CW∞ and K in the von Bertalanffy growth equation is CW∞ = 175.4; K = 0.94/year and for male CW∞ = 177.9; K = 1.2/year. The results also
showed that the growth rate in length of male higher than that of female (male: ø'= 4.570; female ø' = 4.464). Overall growth curve of blue crabs is described in Figure 7, for female in Figure 8 and for male Figure 9.
25
Figure 8. Length (CW) frequency and von Bertalaffy growth curve of female BSC in Kien Giang water.
Figure 9. Length (CW) frequency and von Bertalaffy growth curve of male BSC in Kien Giang water.
26
Table 3. Growth parameters of BSC in some regions
Area Sex CW∞ K ø’ Author
Kiên Giang waters Male 177.90 1.20 4.570 This study
Female 175.40 0.94 4.464
Overal 175.88 0.99 4.486
Bandar Abbas, Northern Persian Gulf
Coastal Area, Trang Province, Thailand
Male 179.0 1.5 4.682 (Sawusdee & Songrak,
2009)
Female 171.0 1.6 4.670
Overal 173.0 1.5 4.652
3.1.2. Size – weight relationship
The relationship between carapace length and weight, between carapace width and weight of BSC species in Kien Giang waters is presented in Figure 10 and Figure 11. The results show that both female and male crabs are allometric growth and weight growth rate is faster than length growth rate. Female weight growth rate is slower than that of male (MANCOVA, p <0.001). In the same size group, weigh of male is high than that of female. Carapace width and weight relationship equation is:
Female: Ln(W) = -10,3632+3,1633*Ln(CW)
27
Figure 10. Carapace width and weight relationships of BSC in Kien Giang waters based on the data collected in 2013. Data was logarithsm
The correlation between the carapace length and weight of BSC is presented in Error! Reference source not found.. Statistical analysis showed that, in the ame size group, the weigh of the females is heavier than males (MACOVA, p <0.001). The carapace length and weight relationship of BSC is described by the equations:
Female: Ln(W) = -7.7976 + 3.1382*Ln(CL) Male: Ln(W) = -7.6061 + 3.0838*Ln(CL)
28
Figure 11. Carapace length and weight relationships of BSC in Kien Giang water sbased on data collected in 2013. Data was logarithsm
The carapace length and carapace width relationship of BSC (Figure 12) showed that the growth rate of carapace width of male crabs was greater than that of female crab (MANCOVA, p <0.001) and expressed as:
Female: Ln(CW) = 0.9654+0.9504*Ln(CL) Male: Ln(CW) = 1.0092+0.9388*Ln(CL)
Figure 12. Carapace length and carapace width relationships of BSC in Kien Giang water sbased on data collected in 2013. Data was logarithsm
3.1.3. Biomass estimation
Length-frequencies of BSC collected monthly in 2013 are used in length converted catch curve model to determinine fishing mortality (F=1.91 for all sexes combined; F = 2.05 for female and F = 2.33 for male) and exploitation rate (E=0.64 for all sexes combined; E = 0.66 for female and E = 0.65 for male) since the natural mortality rate (M) is calculated from Pauly’s M imperical equation was 1.10 at the mean temperature of 28.7oC. It is indicated that the fishing pressure on BSC
29
Figure 13. Length converted Catch curve of BSC in Kien Giang waters in 2013 (Left: Both sexes; middle: female; right: male)
Stock biomass of BSC in Kien Giang waters estimated using the Length Base Cohort Analysis method is around 7.13 thousand tons, corresponding to 1.54 x 10⁶
individuals (Table 4).
Figure 14. Stock assessment and fishing mortality of BSC in Kien Giang waters in 2013
Prematured blue swimming crabs dominate in BSC stock biomass with 57.74% (4.13 thousand tons), matured BSC accounted for 42.26% of (3.02 thousand tonnes). In terms of stock abundance, prematured BSC accounted for 83.67% (1.29 x 10⁶ individuals) and matured BSC accounted for only 16.33% with 0.25 x 10⁶
30
Table 4. Stock biomass of BSC in Kien Giang waters in 2013
Group Biomass Abundance
(x103 tons) % (x106 indv.) %
Premature 4.13 57.74 1.29 83.67
Mature 3.02 42.26 0.25 16.33
Total 7.13 100.00 1.54 100.00
The fishing effort at maximum sustainable yeild (FMSY) for BSC populations
in waters of Kien Giang modelled by Beverton & Holt Yield per Recruiment model is 0.8 and the fishing effort at the precautionary fisheries management (F0.1) is 0.6
(Figure 15). In 2013, the Fcurrent was 1.0; which means the current fishing effort
exceeds the fishing effort at MSY 20% and exceeds the F0.1 40%.
Figure 15. Berverton & Holt Yield per Recruiment model of BSC in Kien Giang waters in 2013
31 BSC stock is overexploited with fishing effort of BSC fisheries in 2006-2007 is 40% over the fishing effort at MSY.
In case of BSC stock in Kien Giang waters, the F2013/FMSY >1, indicated that
to maintain stock equilibriumly against fishing pressure, it is a need to reduce the fishing effort.
3.2. Reproductive biology
3.2.1. Sex ratio
Variation of sex ratio male/females of BSC populations in Kien Giang waters are presented in Figure 16. Results showed that, the males are dominant in comparison to females. Results from surveys in 2013 indicated that the females only accounted for a higher percentage in May and September. The migration patterns of BSC are differences between males and females before and after the breeding season may affected to monthly fluctuation of the male/female ratio in Kien Giang waters.
Figure 16. Fluctuation of male/female ratio of the BSC in Kien Giang waters
3.2.2. Size – maturity stage distribution
32 group of 86mm. The individuals with size from 100mm but gonad development is at phase I or II are those who have been spawning and gonad regeneration begins.
Figure 17. Proportion of gonad maturity stages by length groups of BSC in Kien Giang waters in 2013
The results of analysis gonads monthly showed that blue crab spawning scattered throughout the year that main spawning season is in March and sub spawning season is in August. During the main spawning season, gonad at stage IV and V accounted for high percentages, gonado somatic index (GSI) reaches peak in March and fell sharply after the spawning season, which showed that crabs spawn once in the main spawning season.
33
Figure 18. Monthly variation of gonad maturity ratio and gonado somatic index (GSI) of BSC in Kien Giang water s in 2013
The size at first maturity (CW50) of BSC in Kien Giang waters is estimated at
99.28mm. The curve describes the rate of sexual maturity by length group are shown in Figure 19.
34 Compared with the size at first maturity of BSC in other regions, it is shown that the size at first maturity of BSC in Kien Giang waters is equivalent to that in the Peel-Harvey estuary, Leschenault estuary, Australia and larger than that in the Gulf of Koombana, the Cockburn Sound and Shark Bay, Australia (Table 5)
Table 5. Size at first maturity (CW50, mm) of BSC in some regions
Areas Size at first spawning
(CW50; mm)
Author
Cửa sôngPeel-Harvey, Australia 98.00 (Lestang et al., 2003)
Cửa sôngLeschenault, Australia 97.50 (Lestang et al., 2003)
Vịnh Koombana, Australia 86.90 (Lestang et al., 2003)
Vùng Cockburn Sound, Australia 86.40 (Lestang et al., 2003)
Vịnh Cá mập, Australia 92.00 (Lestang et al., 2003) collaboration with WWF Vietnam, has made a statistic number of 1,718 crab fishing boats (Table 6). Gillnet accounted for 77.8% and traps accounted for 22.2%. Group of small engine capacity below 20HP accounted for 54.5% and above 20HP accounting for 45.5%.
Crab traps mainly concentrated in Kien Hai, Kien Luong and Ha Tien districts. Crab gillnets mainly concentrated in Hon Dat and Phu Quoc districts.
35
In 2013, the fishing effort of the BSC fisheries have great variation between months. Analysis of the Boat Activity Coefficent (BAC) of BSC fisheries, it is found that the activity of gillnet fishing boats is stable during a year while the trap fishing boats is seasonly affected monsoon because of limitation in size of the boats.
During year, the BAC of the gillnetter almost ranges between 0.5-0.6. The peak was observed in October (0.78) and dropped to bottom in April (0.45) (Figure 20).
BAC of the trap was highest in November (0.85) and lowest in July (0.36), this is the time the boats changed to target on jellyfish. The fishing cycle of traps rotated with that of gillnet. When the BAC of the trap increases, the BAC of gillnets decreased (Figure 20).
36
Figure 20. Boat Activity Coefficient (BAC) in BSC fisheries in Kien Giang in 2013
Figure 21. Fluctuation of fishing day/month and monthly catch rate (kg/day) of gillnet and trap fishing fleets in Kien Giang.
37 For fishing fleet > 20HP, proportion of BSC in the total catches was lower in comparison to that in the catches of fishing fleet < 20HP. The ratio of blue crab catches in this fleet was highest at 89.77 % in January and lowest at 62.67 %, average rate was 74.86 %. Average standard catch rate of gillnet fleet > 20HP reaches 0.44 kg/net panel, lowest in December (0.24 kg/net panel) and highest in July (0.53 kg/net panel).
Comparison of the standard catch rates of the fleet <20HP and >20 HP shows the significant difference between catch rates of the two fleets (ANOVA , p < 0.001)
Table 7. Catch proportion of BSC (%) and average standard catch rate (kg/net panel) of gillnet in Kien Giang in 2013
Month
<20HP >20HP
BSC catch/total catch (%) kg/net panel BSC catch/total catche (%) kg/net panel
Jan 92.81 0.56 89.77 0.41
For crab traps, average standard catch rate of the fleet <20HP was 4.93 kg/100 traps. Highest catch rate was 7.13 kg/100 traps in May and lowest was 2.7 kg/100 traps in January. Catches of BSC is dominated, mainly in the range 41-48% of the total catch.
For crab Chinese traps, average standard catch rate of the fleet <20HP was lower than that of the fleet >20HP (ANOVA, p<0.001), average was 6.12 kg/100 traps for the fleet <20HP and 7.27 kg/100 traps for the fleet >20HP. (Table 8, Figure 22).
38 December, the BSC appear at lower proportion, almost below 23% of the total catches (Table 8).
Table 8. Catch proportion of BSC (%) and average standard catch rate (kg/100traps) of the trap fishing fleets in Kien Giang in 2013
Mont h
Trap <20CV Chinese trap <20HP Chinese trap >20HP
kg/100 <20HP, >20HP in Kien Giang in 2013
39 The surveys also showed the fishing coefficient increases, the average number of fishing days of the fleet also increased. In the months BAC was high, the average fishing time was also high and the average catch rates also higher.
Total catch of BSC caught in Kien Giang waters in 2013 is estimated at 7.8 thousand tons, with 53.4% exploitated by gillnet and 46.6% exploited by traps (Table 9).
In terms of the fleet, catches of the fleet > 20 HP accounted for 62.6 % of total catches, whereas catches of the fleets less than 20HP accounts for only 37.4 % .
Table 9. Total catch estimated for BSC in Kien Giang in 2013
Gear Catch <20HP >20HP Total Proportion (%) including the rectangle G3 , G4 , F4; Ham Ninh – Bai Bon area, comprising of the rectangle C2, D2 , D3 and southern region of Phu Quoc from An Thoi to the northwest of the Nam Du archipelago.
Fishing fleet >20HP has a wider fishing areas, fishing grounds cover most of the Northmost of Nam Du Island to Hai Tac archipelago, the historical waters Vietnam-Cambodia and western region of Phu Quoc Island. The high catch rates of BSC is observed in the rectangles A2, B2, A4, B4, A5, B5, B6, C2, C5, C6, B5, B6, D5, D6, G3 and J4.
The crab trap mainly operates in the Ham Ninh - Bai Bon area, Kien Luong coast and around Hon Tre island. The high catch rates fishing grounds were obseved in ractangle I3, I5 and C3.
40 waters of Rach Gia Bay (Figure 24). The high cath rates were in the rectangles C2, G6, H5, H6, H7, I3, I5, I6, I7 and F7.
Figure 23. Fishing grounds of crab gillnet fishing fleets in Kien Giang in 2013 (fleet <20CV: left; fleet >20CV: right)
41
3.3.3. Bycatch
There are 102 species/species group caught in the catches of gillnets and traps of 4 observer trips conducted in January, April, August and October in 2013 (Table 10). Among them, 87 species caught by gillnet and 23 species caught by trap.
The non-targeted species appearing regularly in catches of gillnets include : crab (Charybdis feriatus, C. voiceover), shark (Chiloscyllium punctatum ), stingray (Dasyatis zugei ), shrimp (Ibacus novemdentatus ), snail shells (Cymbiola nobilis), croaker fish (Pennahia Anea), fish (Terapon theraps) and fish (Upeneus tragula) 23 species recorded in the catches of traps include: crab (Charybdis affinis), goby (Acentrogobius caninus), crayfish (Oratosquilla oratoria) and prawn (Penaeus semisulcatus).
The remaining species is occasonally caught in BSC fisheries, even rarely seen in catches of both trap and gillnet.
Table 10. List of species caught in the catch of gillnet and traps based on the observer trips (+: rare seen; ++: not frequently seen; +++: frequently seen)
44 thousand tons with 53.4% of the gillneter and 46.6% of the trap.
The stock biomass of BSC was estimated at 7.13 thousand tons corresponding to 1.54 x 10⁶ individuals, with 3 thousand tonnes of mature crabs and 4.1 thousand
tonnes of immature crabs.
The stock assessment using the Berverton and Holt Yield per Recruiment model showed that the BSC resources is heavily exploited (Length Converted Catch Curve: E>0.6; Beverton & Holt Yield per Recruiment Model: Fcurrent>FMSY;
F0.1<Fcurrent). To manage the BSC fishery, the reduction in fishing effort is required to
maintain sustainable BSC resource again the fishing pressure.
BSC begins mature at the size 86mm (CW). Size at first maturity (CW50) is
99.28mm. Size of BSC exploited by traps currently smaller than the size at first maturity. To reduce the risk of fishing on BSC stock, the minimum mesh size corvering the trap need to be increased.
BSC bears egg during year around. The main spawning season of BSC is considered from February to April with peak in March. The sub-spawning season is in August and October-November. During the sub-spawning season, the ovary of BSC is spawning partly and the spawning season prolongs and spawning occurs scattered.
45 There were total 102 species/species groups in catches of gillnets and traps. The non-target species appearing regularly in catches of gillnets is red crab (Charybdis feriatus, C. voiceover), shark (Chiloscyllium punctatum), stingray (Dasyatis zugei ), shrimp (Ibacus novemdentatus), Snail shells (Cymbiola nobilis), occurrence of ovigerous females in three species of commercially exploited portunid crabs in S. E. Queensland. Pro. R. So. Qd,, 97: 79-87.
CLARKE, K. & RYAN, S. 2004. Ecological assessment of the Queensland bleu swimming crab pot fihsery. Department of Primary Industhi.
CONSTANTINE, S. 2002. Sample-Based Fishery Surveys - A Technical Handbook. Food and Agriculture Organization of the United Nations, Rome. ISBN 92-5-104699-9.
EDGAR, G. J. 1990. Predator-prey interactions in sea grass beds. II. Distribution and diet of the blue manna crab P. pelagicus Linnaeus at Cliff Head, Western Australia. Jounrnal of Experimental Marine Biology and Ecology, 139: 23-32.
EHSAN, K., NABI, S. & MAZIAR, Y. 2010. Stock Assessment and Reproductive Biology of Blue Swimming Crab, Portunus pelagicus in Bandar Abbas Coastal Waters, Northern Persian Gulf. Journal of Persian Gulf, 1: 11-22.
GAYANILO, F. C., SPARRE, P. & PAULY, D. 2002. FAO-ICLARM Fish Stock Assessment Tools, FAO, Rome.
GIANG, S. N. P. K. 2010. Báo cáo thống kê số lượng tàu khai thác ghẹ xanh của tỉnh năm
2009. In Hội thảo xây dựng chương trình cải thiện nghề khai thác ghẹ xanh Kiên Giang. Hà Tiên, Kiên Giang.
GIANG, S. N. P. K. 2013. Bảng tổng hợp nghề khai thác ghẹ năm 2013.
JONES, R. 1981. The use of length composition data in fish stock assessments (with notes on VPA and cohort analysis).
46 KING, M. 1995. Fisheries biology, assessment and management, Fishing New
Books.
LESTANG, S. D., HALL, N. G. & POTTER, I. C. 2003. Reproductive biology of the blue swimming crab (Portunus pelagicus, Decapoda: Portunidae) in five bodies of water on the west coast of Australia. Fish. Bull., 101: 745-757.
MEAGHER, T. D. 1971. Ecology of the crab Portunus pelagicus (Crustacea: Portunidae) in south Western Australia. Univ. Western Australia, Perth, Australia. Ph.D. diss: 227 p.
PENN, J. W. 1977. Trawl caught fish and crustaceans from Cockburn Sound. Report No 20. Department of Fisheries and Wildlife Western Australia. Western Australian Fisheries, Western Australian Fisheries and Marine Research Laboratories, 39 Northside Drive, Hillarys, Western Australian 6025.
POTTER, I. C., CHRYSTAL, P. J. & LONERAGAN, N. R. 1983. The biology of the blue manna crab Portunus pelagicus in an Australian estuary. Journal Marine Biology,, 78: 75-85.
POTTER, I. C. & LESTANG, D. S. 2000. The biology of the blue swimmer crab Portunus pelagicus in the Leschenault Estuary and Koombana Bay in south-western Australia. Journal of the Royal Society of Western Australia,, 83: 443-458.
SAWUDEE, A. & SONGRAK, A. 2009. Population Dynamics and Stock Assessment of Blue Swimming Crab (Portunus pelagicus Linnaeus, 1758) in the Coastal Area of Trang Province, Thailand. Walailak Journal Science and Technology.
SAWUSDEE, A. & SONGRAK, A. 2009. Population Dynamics and Stock Assessment of Blue Swimming Crab (Portunus pelagicus Linnaeus, 1758) in the Coastal Area of Trang Province, Thailand. Walailak J Sci & Tech, 6: 189-202.
SMITH, H. 1982. Blue crabs in South Australia-their status, potential and biological. Australian Fisheries Industry Council (SAFIC), South Australia, 6: 6-9.
SONGRAK, A. & CHOOPUNTH, P. 2006. Stock Assessment of Blue Swimming Crab (Portunus pelagicus Linnaeus) in Sikao Bay, Trang Province, Southern Thailand. In Proceedings of the Coastal Oceanography and Sustainable Marine Aquaculture,
Confluence & Synergy, pp. 260-267. Kota Kinabalu, Sabah Malaysia.
47 SUMPTON, W. D., POTTER, M. A. & SMITH, G. S. 1994. Reproduction and growth of commercial sand crab, portunus pelagicus (L.) in Moreton Bay, Queensland. Asian Fisheries Science, 7: 103-113.
THÚY, N. T. D. 2010. Chương trình cải thiện nghề khai thác ghẹ xanh Kiên Giang. In Hội thảo xây dựng chương trình cải thiện nghề khai thác ghẹ xanh Kiên Giang. Hà Tiên, Kiên Giang.
WENG, H. T. 1992. The sand crab Portunus pelagicus (Linnaeus) populations of two different environments in Queensland. Fisheries Research,, 13: 407-422.
48
APPENDICES
Appendix 1. Discriptive statistics of BSC samples collected from catches of gillnets and traps fisheries in Kien Giang Province
50
CW (mm) CL (mm) Aver.
weight
(g) N
Trip Gear Sex Min Medium
Std,
Dev. Max Min Medium
Std,
Dev. Max
Female 76.0 123.9 21.9 180.0 34.0 57.0 10.8 84.0 149.1 76.0 Male 63.0 117.9 13.6 150.0 36.0 54.2 6.5 72.0 132.8 117.0
Trap 78.0 98.4 11.0 135.0 36.0 45.1 5.0 62.0 69.9 133.0
Female 80.0 100.8 12.4 135.0 36.0 46.2 5.5 62.0 74.3 57.0
51
Appendix 2. Boat Activity Coefficent (BAC), activeday/month, catch per unit effort (CPUE, kg/day) and total catch of BSC in Kien Giang Province in 2013
Month Gear BAC Mean Activeday
CPUE (kg/day) Total Catch (tons)
52
Month Gear BAC Mean Activeday
CPUE (kg/day) Total Catch (tons)
<20CV >20CV <20CV >20CV TOTAL
12 Gillnet 0.56 15.9 9.1 18.6 61.2 95.7 156.9
12 Trap 0.67 19.8 45.6 146.2 115.9 361.9 477.8
TOTAL 2,934.5 4,920.1 7,854.7