304
Analyzing the Impact of Brand Equity and Marketing Mix towards Consumer
Loyalty: Case Study of Aqua in Surabaya
Christian Adi Basuki
International Business Management Program, Petra Christian University Jl. Siwalankerto 121-131, Surabaya
E-mail: [email protected]
ABSTRACT
This research is being done to know the impact of brand equity and marketing mix towards consumer loyalty of Aqua in Surabaya. The data was gathered using simple random sampling by distributing o n l i n e questionnaires to 130 respondents in Surabaya. The data was analyzed using Multiple Linear Regression Analysis. The result shows that the brand equity and marketing mix simultaneously have significant impact on consumer loyalty of Aqua in Surabaya. Meanwhile, as individual dimension, brand loyalty, brand awareness, perceived quality, price, and promotion have significant impact toward consumer loyalty of Aqua in Surabaya.
Keywords: marketing, consumer behavior, brand equity, marketing mix, consumer loyalty
ABSTRAK
Penelitian ini dilakukan untuk menganalisa dampak ekuitas merk dan bauran pemasaran terhadap loyalitas konsumen Aqua di Surabaya. Data diperoleh menggunakan metode simple random sampling dengan mendistribusikan kuesioner o n l i n e kepada 130 responden di Surabaya. Data kemudian dianalisa dengan menggunakan Multiple Linear Regression Analysis. Hasil penelitian menunjukkan bahwa ekuitas merk dan bauran pemasaran secara keseluruhan mempunyai pengaruh yang signifikan terhadap loyalitas konsumen Aqua di Surabaya. Secara dimensi individu, l o y a l i t a s m e r k , k e s a d a r a n m e r k , p e r s e p s i k u a l i t a s , h a r g a , d a n p r o m o s i mempunyai pengaruh yang signifikan terhadap loyalitas konsumen Aqua di Surabaya.
Kata Kunci: pemasaran, perilaku konsumen, ekuitas merk, bauran pemasaran, loyalitas konsumen
INTRODUCTION
In this globalization era, the competition in industrial sector is getting stiff and harsh. Many manufacturers open their business to compete in the industry that urges every company to be able to survive in those competitions. As the number of competitor in the industry increases, more choice of product or services is given to the consumers. They tend to be more selective in choosing the products or services to gain more benefits than the costs they should bare.
The same phenomenon also happens in bottled drinking water business, where there is an increasing number of companies produce bottled drinking water that makes the competition in the industry become harder. As in 2010, there were only 400 companies that produce around 1000 brand of bottled drinking water. The numbers of bottled drinking water
producers soar to 800 companies in 2013 like, Aqua, Club, Vit, Prima, Cheers, Flow, Ades, and many others (Yanto, 2013).
305 consumer in Indonesia have more demand in more practical products.
According to Tjiptono (2008), the key factor that every company need to win in the competition is to create and sustain consumers. And to achieve those objectives, every company need to produce goods and services that fulfill consumer’s need with the suitable
price. Thus, companies’ sustainability to fulfill
consumer’s need and want rely on the consumer
behaviour.
With the right business strategy and the ability to keep innovating as the standard that every company need to have, they can face the stiff competition in the industry. It can be done by giving the consumer more value in the product or services compare to the competitors.
The stiff competition also makes companies to focus on gaining more market share in the industry. Market share become one of the parameter showing which company are leading in the competition inside the industry. The pioneer in the industry which usually has bigger market share will try to withstand from the attack from the followers to cope as much market share as possible.
According to Seow-Chien Chew (2009), one way to boost the market share is by having loyal customers. They will spend more based on the company that they trust and they will give referrals to friends. However, to make consumers become loyal is not easy, it requires long-time process. Building trust inside consumer need to be done from the first time they were established to ensure the company maintain its product quality all the time.
One of the factors that make customers become loyal is brand equity (Taylor, Celuch, & Goodwin, 2004). By having a strong brand, it can help the company to differentiate itself from their competitors in the stiff condition inside the market. As brand equity shows the value added to the products and services by a company, it become the stimulus that makes consumers to purchase the products and services. According to Aaker (1991), there are four elements of brand equity which are, brand loyalty, brand awareness, perceived quality, and brand associations.
The other factors that have impact towards customer loyalty are marketing mix and customer satisfaction (Hooi, 2012).Through marketing mix, companies will have the ability to influence consumers to know their products and buy their products. After purchasing the product that fulfilling
the consumer’s need, they will become satisfied and become loyal consumers if the company maintain its product that meet their demand. According to Kotler and Keller (2012), marketing mix can also be defined
as four P’s of marketing which are product, price, place, and promotion.
According to PT. Tirta Investama (2011), the pioneer brand of bottled drinking water in Indonesia
is Aqua. Aqua is produced by PT. Aqua Golden Mississippi that established in 1973 by Mr. Tirto Utomo. Their first product was 950 ml glass-bottled drinking water that sold for 75 Rupiah in 1974. In 1985, it launched 220 ml bottled drinking water which focused on the quality and safety of the products to be consumed. A big decision was made in 1998 when Aqua decided to sell it shares to Danone Group. This step enabled Aqua to survive the crisis at that time and made Aqua as the biggest bottled drinking water producer in Indonesia. In 2000, it launched a brand called Danone-Aqua (PT. Tirta Investama, 2011).
Excellence in product quality and the continuous innovation that Aqua gave to bottled drinking water industry in Indonesia make Aqua become the market leader in this industry. Moreover, the brand Aqua itself turned out to be a generic brand in Indonesia. When the consumer of bottled drinking water says they want to drink Aqua to replace the real meaning which is bottled drinking water. Being a generic brand can be caused because the brand itself become top of mind or the brand dominates the market in that industry. Aqua can benefits from that situation where people will associate bottled drinking water to its brand and boost its sales and performance (Kartajaya, 2006).
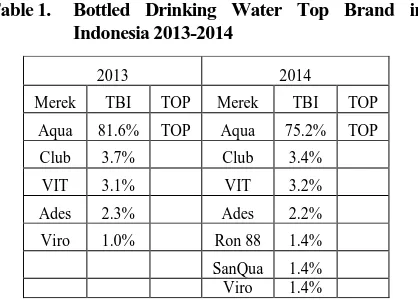
Table 1. Bottled Drinking Water Top Brand in Indonesia 2013-2014
Unfortunately, the condition in the market will not go smooth as the company plan. Due to the stiff competition happen in the bottled drinking water industry, Aqua starts to lose its market share. From table 1, Aqua still becomes the market leader in 2013 and 2014 with market share 81.6% and 75.2% respectively. Aqua also achieved TOP award in the year of 2013 and 2014, where a brand are in the top 3 in the industry and has a minimum market share of 10%. Even though Aqua is still being the market leader the effect of the increasing number of brand in bottled drinking water industry makes Aqua market share decreases 6.4% in 2014. And it is predicted that
the downtrend of the Aqua’s market share will
continue in the following year. Even bottled drinking water brand that was not listed in the 2013 index showed up in the 2014 top brand index like, Ron 88 and SanQua.
2013 2014
Merek TBI TOP Merek TBI TOP
Aqua 81.6% TOP Aqua 75.2% TOP
Club 3.7% Club 3.4%
VIT 3.1% VIT 3.2%
Ades 2.3% Ades 2.2%
Viro 1.0% Ron 88 1.4%
306 This research will focus only in Surabaya bottled drinking water industry. According to (Wasesa, 2013), the stiff competition in bottled drinking water industry requires Aqua to maintain its quality and innovation in order to sustain its market share. Even in big cities like, Surabaya and Malang, Aqua bottled drinking water is harder to be found. Previously Aqua still became the market leader in hotel, restaurant, and café market and you can only find Aqua brand in those places. Nowadays many brands like Club and Prima as the main competitors of Aqua exists in that market. The situations also got worsen for Aqua with the strategic attack from Club and Prima brand where they focus on the small consumers of the bottled drinking water in those markets, thus Aqua loses its market share respectively.
LITERATURE REVIEW
In this chapter, the writer will explain all the concepts and relevant researches related to brand equity, brand loyalty, brand awareness, perceived quality, brand associations, marketing mix factors (product, price, place, and promotion), and consumer loyalty. Relationship between brand equity factors and marketing mix factors towards consumer loyalty will also be discussed as the basis of this research.
Bottled Drinking Water Industry
The industry of bottled drinking water in Indonesia is started in 1973 when a former employee of Pertamina Jakarta decided to open a company focusing on bottled drinking water. He was Tirto Utomo who had the idea to open PT Aqua Golden Mississippi due to the crisis of clean water during that time. Due to the success of Aqua in dominating the market of bottled drinking water in Indonesia, many companies were established to enter the industry. One of them is PT Ades Alfindo Putra Setia that was established in 1985 by A. Gunawan.
This bottled water industry is growing as the demand from Indonesian consumer of clean water increases. It can be seen that until 2013, there are more than 800 companies that produce bottled drinking water. The increase of competition in this industry urges PT Aqua Golden Mississippi as the market leader to maintain its performance and quality in order to sustain as the market leader. According to Kartajaya (2006), one way to win in the global competition is to maintain the quality of the product by choosing the right marketing strategy.
According to Kotler and Keller (2012), marketing is defined as the activity done by the companies to give more value to its product or services in order to meet the customer demand and build relationship with the consumers. The right choice of marketing strategy in the bottled drinking water industry will give better results for the company
in term of value and market share. Thus, the marketing mix strategy is being used to examine the level of consumer loyalty of Aqua bottled drinking water.
The other consideration in winning the harsh competition happened in the bottled drinking water industry is to keep maintaining the brand equity of Aqua. As the brand Aqua is perceived as the generic brand to associates with bottled drinking water product, the researcher want to examine the condition of the brand equity of Aqua.
Brand Equity
Brand equity is “a set of assets and liabilities
linked to a brand, its name and symbol that adds to or subtracts from the value provided by a product or service to a firm and/or to that firm’s customers” (Aaker, 1991). According to Knapp (2002), brand
equity is defined as “a totality of brand perception that
includes quality of product and service, financial performance, customer loyalty, satisfaction, and
award towards the brand itself.” Thus, brand equity is
the power of a brand that affects the value of products in the eye of the customer through the perceived product quality.
According to Aaker (2000) in Tjiptono (2005), there are 4 elements that have contribution in the making of brand equity, which are brand loyalty, brand awareness, perceived quality, and brand associations. However for this research brand loyalty factor will be excluded since it contains similar indicators with the dependent variable which is consumer loyalty.
Tjiptono (2005) defined brand awareness as “the ability of the consumer to identify and remember a
brand and connect it with a category of product.”
Brand awareness will be valued on how deep the consumers able to recognize and recall a brand. Rangkuti (2004) also has another definition of brand
awareness, which is “the ability of consumers to recall
a certain brand or certain advertising spontaneously
after being stimulated with some keywords.”
Perceived quality is “customer perception where a brand is perceived as a high quality product”
(Tjiptono, 2005). According to Darmadi, Sugiarto, and Sitinjak (2001), perceived quality is defined as
“consumer perception towards overall quality or the
excellence of products or services that are related with
what the consumer expectation.”
According to Tjiptono (2005), brand
associations are “everything that related to the memory of a certain brand.” Brand associations are “something in consumer’s mind or memories that connect to the brand including product attributes,
consumer’s benefits, uses, life styles, product classes, competitors, and countries of origin” (Aaker, 1991).
307 Marketing Mix
Kotler and Keller (2002) said that marketing mix is a marketing tool that used by the company to reach the marketing objectives in fulfilling the target market.
Following the concept of 4P’s that is developed
by Jerome McCarthy in 1964, where he divided the marketing mix into 4 factors, which are product, price, place, and promotion. Each of the marketing mix factors will be explained in the following section.
According to Cravens (2000), product can be
defined as “everything that potentially has value to
the target market that can give benefits and satisfaction that include products and services.” Kotler and Amstrong (2007) also have another
definition of product which is “everything that can be offered to the market to fulfil the want and need.”
Price is “the amount of money that is imposed
on a product or service, or the value of the exchange by the consumer with the benefits due to the
ownership or usage of the product or service” (Kotler & Amstrong, 2007). Price is the only factor in the marketing mix that can generate revenue, thus it play a key role in creating customer value and building loyal customers. According to Tjiptono (2008), price
is “the value indicator where the price itself is linked
to the benefits that are felt on certain product or
service by the consumer.”
Place is “the distribution channels of an
organizational structure inside and outside the
company” (Alma, 2004). Place also play an important role in the marketing mix as the decision made related
with place will affect the consumer’s choice of
purchasing the product. Tjiptono (2008) definition of
place is “every activity done by the producer to make
the product can be obtained by the customers at any
time and place.”
Place is “the distribution channels of an
organizational structure inside and outside the
company” (Alma, 2004). Place also play an important role in the marketing mix as the decision made related with place will affect the consumer’s choice of purchasing the product. Tjiptono (2008) definition of
place is “every activity done by the producer to make
the product can be obtained by the customers at any
time and place.”
Consumer Loyalty
According to Oliver (1997), loyalty is described
as “A commitment to rebuy or repurchase a preferred
product/service consistently in the future, despite situational influences and marketing efforts having the potential to cause switching behaviour.” Oliver (1997) also mentioned that there are two elements of consumer loyalty, which are repeat sales and referral business. A consumer will be considered loyal when they do repeat sales and give referral about the product/service.
By having loyal consumers, there are several benefits that the company can achieve that will
increase the company’s profitability. The company’s
profitability can be increase in some ways, like reduce the marketing costs, press down the transaction costs, and increase the cross-selling sale. In addition, loyal customers will also most likely to tell their experience to other people which can results in increasing the word-of-mouth (WOM) (Griffin, 2005).
In this research, three major theories are used as the basis of the research, which are Brand Equity, Marketing Mix, and Consumer Loyalty. Brand Equity and Marketing Mix are believed to be the factors that influence the Consumer Loyalty. Brand Awareness here will make the consumers aware with the brand of the product and at the highest level will recall the brand when it comes with the purchase decision of a particular product. The brand awareness also will attract newly consumer to purchase product from certain brand and become loyal. Brand associations make the consumer of a certain brand of product associates the benefit received and the attitude towards the brand. Thus, positive attitude of the consumer will make them continue purchasing the product and become our loyal consumers. Perceived quality will be able to deliver more value into the product to the consumer. Thus, it makes consumers are more willing to purchase the product, satisfied with the product, and become the loyal consumers. As mentioned above that marketing mix consists of 4 factors, which are product, price, place, and promotion. Product here will be the main consideration of consumer when the want to purchase our product continuously. Thus, maintaining the product quality and performance will enhance the number of loyal consumers. While price here can
enhance the consumer’s willingness as it will be
compared to the quality of the product therefore it can influenced the consumer loyalty. Place signals the easiness for our consumers to find our products and how good the company can distribute its products therefore it can consumers become more loyal to our products or services. Promotion acts as one of the important factor in marketing the production, where suitable promotion strategies can lead into higher loyalty of the consumers towards the product or service.
Some relevant researches that have been conducted by other researchers will be explained further to make this research have strong foundation and give additional insights on what the research is about. There are 3 relevant researches that are being used related with the theoretical framework of this research.
308 effect of those 4 factors of brand equity towards the customer loyalty in the case study of Aqua in Malang. The researchers used explanatory research and stratified random sampling to gather the data by the help of questionnaires. They made 4 hypotheses where each of them stating that each brand equity factor had significant effect towards customer loyalty of Aqua bottled drinking water in Malang. This
research support the writer’s theoretical framework
where the brand equity factors – brand awareness, brand associations, perceived quality, and brand loyalty had significant effect towards customer loyalty.
The second research is conducted by Cahyono (2013) wit the title of Investigating the Influence of Marketing Mix Factors of Cleo Pure Water on Consumer Loyalty of Surabaya People. The objectives of this research is to determine the influence of marketing mix factors, like product, price, place, and promotion towards the consumer loyalty of Cleo Pure Water of Surabaya people.There are four hypotheses in this research related with the four factors of marketing mix. The hypotheses were to examine each factor of marketing mix had significant
and positive impact towards Cleo Pure Water’s
consumer loyalty of Surabaya people. The research used the sample of 100 respondents that ever bought and consumed Cleo Pure Water in Surabaya. From this research, it supported the theoretical framework that the writer made as the marketing mix factors – product, price, place, and promotion – had significant and positive impact towards consumer loyalty.
The last research that is related is the one conducted by Sinthupinyo and Ngamkroeckjoti (2013) entitled Using Group Comparisons to Explore Customer Loyalty Towards the Thai Bottled Drinking Water. The objective of this research is to determine the effect of brand awareness, promotion, and price towards customer loyalty of Thai bottled drinking
water. This research supports the writer’s theoretical
framework that the dependent variables which are the brand awareness and marketing mix factors – promotion and price - turn out to have significant impact towards consumer loyalty.
RESEARCH METHOD
The purpose of this study is to examine the impact of brand equity and marketing mix towards the consumer loyalty in the case study of Aqua in Surabaya by conducting a hypothesis testing. From the 4 types of study explained by Cooper & Schindler (2014), causal-explanatory study is believed to be the suitable type for this research. By using causal-explanatory study, the writer can test the hypotheses where the independent variables, brand equity and marketing mix have influence towards the dependent variable, the consumer loyalty.
There are 7 independent variables and 1 dependent variable used in this research. Those independent variables are brand awareness, perceived quality, brand associations, product, price, place, and promotion.
Brand awareness is the ability of the customer in identifying and recalling a certain brand of some category if product. In this research of Aqua, there are 4 indicators to identify the brand awareness that will be used (Rangkuti, 2004), like aware the brand, recognize the brand, recall the brand, and Top of Mind.
Perceived quality is the perception of the customer where a certain brand has a high quality of product or service. It is also described as the overall quality of a brand that meets the expectation of the consumer (Tjiptono, 2005). In this research, a theory about perceived quality indicators according to Darmadi, Sugiarto, and Sitinjak will be used to determine the quality of Aqua bottled drinking water, like service, durability, reliability, and conformance. However 1 indicator will be excluded in this current research which is the fit and finish. The reason is it gives similar answer to others indicator used in this research. The other reason is this indicator somehow will be the sum of other indicators in the perceived quality variable, thus it will be excluded.
Brand associations are how consumer memorizes certain brand and connect it to the product attributes, benefits, and lifestyle (Tjiptono, 2005). While in this research, the indicators for brand associations will be divided into 3 categories according to Keller (2008), which are attributes, benefits, and attitudes.
Product as one of the elements of marketing mix is defined as everything that can be sold to the potential target customers by adding more value on them in return to give benefits to the company (Kotler & Amstrong, 2007). In this research for Aqua bottled drinking water, the indicator for this variable will be following the theory from Kotler and Keller (2009), like variety, performance, features, packaging, and sizes. However 1 indicator will be excluded in this research which is brand name. The reason why the writer excludes brand name is because it is already explained in the previous variable under brand equity factors.
Price is the amount of cost that the customer needs to bare in exchange of consuming the product or service (Kotler & Amstrong, 2007). Price here also defined as the difference between the benefits and costs that the customers get in the buying process (Tjiptono, 2008). In this research, the indicators that are proposed by Kotler & Amstrong will be used to determine the questions for this variable, like price affordability, price-to-quality, price discounts, and price competitiveness.
309 location where the product is sold (Tjiptono, 2008). According to Kotler and Amstrong (2007), there are several indicators to explain the variable place that will be used in this research, like channels, locations, and inventory. One indicator will be excluded from this variable which is transport. As the definition for that indicator is the availability of transportation that the consumer can use to reach the location, it will not fit for the consumption of convenience product. Many consumers will use their own transportation (the company will not provide the transportation) to buy this kind of product in the location where the product sold.
Promotion is defined as the activities done by the company to communicate the product to the potential or existing customer to change their behaviour and attitude towards the product. It is also can described as the persuasive way of communication done the seller in selling the product to the buyer (Tjiptono, 2008). In this research, the indicators to measure this variable are following the theory from Kotler and Keller (2009), like sales promotion, advertising, personal selling, public relations, direct marketing, and WOM marketing.
While the dependent variable is the consumer loyalty as the commitment of the consumer of certain product or service that will repurchase, purchase interlinear product, give good referral, and have the immunity to purchase similar product sold by competitors (Griffin, 2005). From that theory, the indicators for the independent variable are repucharse the product, purchase interlinear product, referral the product, and immunity to competitor.
In this research the type of data that will be used are nominal, ordinal, and interval data. Nominal data will be used for the classification questions for respondents such as, gender, occupation, and domicile. Ordinal data will be used for age classification and spending per month. Those questions are given to the respondents in order to know the profile of the respondents.
The other type of measurement that is used is interval data in this research will be used for the dependent variable and independent variables questions that will be rated by the respondents according to the rating scales used which is Likert scale.
In this research, the writer will only uses primary sources and secondary sources. Primary sources will be collected from the questionnaire that will be distributed to the respondents. The respondents of this research are the consumers on Aqua bottled drinking water in Surabaya.
While the secondary sources for this research are collected from books, articles, websites, and journals. Those data will be used by the writer to construct the theoretical background, bottled drinking water industry, and company profile for Aqua in this research.
In this research, the writer will use simple random sampling as the sampling method because it provides more general data. The target population will be the consumers of Aqua bottled drinking water in Surabaya. The questionnaires will be spread through online media by using Google doc and spread only to Surabaya citizen. Next, the sample size will be determined by using the formula from Tabachnick & Fidell (2007) to calculate sample size for testing multiple correlations. Thus, the sample size in this research must be greater than 114 samples; therefore, the number of questionnaires that will be spread is more or less 130 to anticipate lost and invalid response.
According to Cooper & Schindler (2014), all of the data gathered in a research must be valid, reliable, and practical. Practicality can be measured through three aspects of measurement which are economic aspect, convenience aspect, and interpretability aspect. This research is executed practically as it has tried to fulfil those 3 aspects, on budget (economic aspect), easily to be done (using questionnaire with clear instructions), and can be interpreted using the right method in analysing the data and the results.
Validity can be measure by a test in order to know the instrument wished to be measured. Validity also means that the data that is being measured is right (Ghozali, 2011). In this research, validity test is conducted by comparing the value of r that is calculated from the questionnaire result and the r value in the table (r-table). The r value that is calculated from the questionnaire can be seen on the SPSS output in the Correlated Item – Total Correlation column. While the r-table value can be seen from the 2-tailed table with the degree of freedom of n-2, with n as the number of sample used. In order for all the data can be valid the calculated r value must be higher than the r-table value.
Reliability test is a test to check whether the measuring instruments used are free from random error or not. There are two ways of testing the reliability which are stability and internal consistency (Cooper & Schindler, Business Researh Methods, 2014). Based on stability, a measurement can be said to be reliable when the measurement ability has consistent results at different time from the same person. While the internal consistency said that a measurement can be reliable when the instrument items being observed are homogenous and highly correlated. In this research, internal consistency will
be used that can be measured through the Cronbach’s
Alpha. The measuring instrument can be said to be
reliable when the Cronbach’s Alpha is higher than 0.6
(Ghozali, 2011). The closer the Cronbach’s Alpha to 1, the more reliable the measuring instrument is.
310 Normality test can be used to test whether the independent variables and dependent variables are distributed normally in the regression model. A good regression model has normally distributed data (Ghozali, 2011). This test is usually used to measure ordinal, interval, or ratio data. Normal distribution can be tested through graph analysis and statistical analysis. From the graph analysis, normal distribution can be seen through scatter plot and histogram. From the scatter plot, it is said that the residuals are normally distributed when the dots are fall between the straight lines. On the other hand, if the dots are scattered around, it means that the residuals are not normally distributed. Looking at the histogram, normal distribution can be seen through the bell-shaped probability. Normality test can also be done statistically by looking at the kurtosis and skewness. If one of the value is larger than the Z-critical value, it means the regression model is not significant. This research uses 5% of significance level, thus the value of Z should be within ±1.96. Other statistical method to test the normality is using the non-parametric statistical test called Kolmogorov-Smirnoff test. The residuals in the regression mode will be called to be normally distributed if the significance is above 0.05.
Autocorrelation test is a test that is done to know whether there is correlation between residuals of a certain period (t) with the residuals of preceding period (t-1) (Ghozali, 2011). Autocorrelation can be checked through Durbin-Watson test, where the value will range from 0 to 4. The autocorrelation does not exist when the value of Durbin Watson is between du to 4-du.
Multicollinearity test is conducted to check whether there is intercorrellation between two or more independent variables. When there is multicollinearity, it makes the result of the multiple regression model is unreliable. To check the correlation between independent variables, tolerance value and variance inflation factor (VIF) will be used. Tolerance value measures the variability of the chosen independent variable that is not explained by other predictor variables. The minimum limit of the tolerance value is 0.10. Thus, if the tolerance value is higher than 0.10, it means that there is no mulitcollinearity and the null hypothesis cannot be rejected. However, if the tolerance value is lower than 0.10, it means that there is multicollinearity and the null hypothesis is rejected.
Heteroscedasticity test is conducted to analyse whether there is different variance of errors in different observations or different value of predictor. A good regression model should has homoscedasticity instead of heteroscedasticity, meaning that the variance of errors stay constant across different observations (Ghozali, 2011). To examine the presence of heteroscedasticity, the writer can use graph analysis or statistical analysis. For the graph
analysis, the writer will examine the Scatterplot Graph which has the predicted dependent variable (ZPRED) as the X-axis and the residual value of the dependent variable (SRESID) as the Y-axis. Heteroscedasticity occurs when the plots on the graph has some pattern. However, if the plots on the graph are scattered above and below 0, there is no heteroscedasticity. Using another analysis which is statistical analysis, the writer will use Park test to examine the presence of heteroscedasticity. The level of significance used in this research is 5%. If the significance F (P-value) shown in the SPSS is below the significance level of 5%, the null hypothesis is rejected. On the other hand, if the significance F (P-value) of the SPSS output is above the significance level of 5%, it means that the null hypothesis cannot be rejected.
The last analysis is the multiple linear regression analysis that is being divided into F-test, t-test, and Adjusted R Square. Multiple linear regression is an analysis tool that is used to measure the relationship between dependent variable and independent variables. This analysis is used when there is more than one independent variable (Cooper & Schindler, Business Researh Methods, 2014). In this research, a multiple regression analysis formula is made to know the value of the dependent variable.
F-test is a test to measure the overall significance of the model. It tries to examine whether all of the independent variables that are included in the regression model have significant impact towards the dependent variable or not. This research will use confidence level of 95%, therefore the significance level (�) is 5%. In order to test the hypothesis using the F-test, the writer can either look at the significance F (P-value) or at the F-value (F-test). By looking at the significance F (P-value), the decision is made based on the result explained as follow. If significance F (P-value) is lower than 5% significance level, it means the H0 is rejected. On the other hand when the significance F (P-value) is higher than 5% significance level, the H0 cannot be rejected. The other way to test the hypothesis using F-test as mentioned above is by looking at the F-value (F-test). If the F-value test) is higher than the F-table (F-critical value), it means the H0 is rejected. However, if the F-value test) is lower than the F-table (F-critical value), it means that the H0 cannot be rejected.
311 rejected. On the other hand when the significance t (P-value) is higher than 5% significance level, the H0 cannot be rejected. The other way to test the hypothesis using t-test as mentioned above is by looking at the t-value test statistic). If the t-value (t-test statistic) is higher than the t-table (t-critical value), it means the H0 is rejected. However, if the t-value test statistic) is lower than the t-table (t-critical value), it means that the H0 cannot be rejected.
Adjusted R square is the indicator used to show how the independent variables are influencing the dependent variables. The value of adjusted R square range from 0 to 1 with the less value meaning that the influence of independent variables towards the dependent variables is weak. Adjusted R square is different with R square in term of estimating the value of independent variables. Thus, the adjusted R square value is less than the R square value (Ghozali, 2011). Regarding the result of adjusted R square, the closer the value to 1, it means the independent variables are better at explaining the dependent variables.
RESULTS AND DISCUSSION
There are some tests that are needed to be conducted before analyzing the data further, which are reliability and validity test. For the reliability test, it
can be concluded by looking at the Cronbach’s Alpha
score for each variable. It is considered as reliable
when the Cronbach’s Alpha score are above 0.6 for
both dependent and independent variables. The other test is the validity test for each variable of this research (dependent and independent variables). This test is done by comparing the r value calculated from the questionnaire and the r value in the r-table. All of the variables can be considered valid when the calculated r value is higher than the r value in the r-table. The calculated r value can be seen in the Corrected Item-Total Correlation column. For this research, since there are 130 respondents that fill the questionnaires, the value of n-2 is 128. Therefore with the degree of freedom of 128, the r value in the r-table is 0.1723. Those indicators in each variable can be said as valid if the calculated r value in the Corrected Item-Total Correlation column is higher than 0.1723.
Table 2. Reliability and Validity Test Summary
Variable name Cronbach’s Alpha
Corrected Item-Total
Correlation
Brand
Awareness 0.681 0.393; 0.483; 0.492; 0.490
Perceived
Quality 0.645 0.483; 0.362; 0.463; 0.399
Brand
Associations 0.720 0.574; 0.456; 0.505; 0.497
Product 0.720 0.533; 0.484; 0.428; 0.562; 0.391
Price 0.729 0.588; 0.540; 0.349; 0.608
Place 0.722 0.614; 0.454; 0.566
Promotion 0.703 0.501; 0.502; 0.460; 0.390; 0.234; 0.417; 0.426
Consumer
Loyalty 0.764 0.588; 0.584; 0.629; 0.463
Looking at the results in the table 2 above for the
Cronbach’s Alpha column, it shows that all the values
are above 0.6. It means that all of the variables used in this research are reliable. The next thing is the validity test results, based on the value in the corrected item-total correlation above that all of the values are higher than 0.1723. Thus, it can be concluded that all of the indicators in each variable is valid and can be used for further analysis.
Moreover, the model that is being used for this research is proven to be a linear regression model since it passes all of the classic assumption tests. The model firstly passes the normality test where the graphical results form a bell-shaped curve and the dots are align with the linear regression model. It also supported with the statistical tests when the Z skewness value (-1.7316) and Z kurtosis value (1.1381) do not exceed the critical value of . It is also being convinced when the model passes the Kolmogorov-Smirnoff test when the significance value (0.727) is above 0.05. The model also passes the second test which is the autocorrelation test. It can be seen when the Durbin Watson value of this model (2.065) lies between the accepted ranges (1.82823 – 2.17177). For the next test which is the multicollinearity test, the model once again can pass the test. It can be concluded because all of the independent variables have the value of VIF below 10 and the tolerance is above 0.1. The model also passes the last test which is the heteroscedasticity test. It can be seen when the graphical analysis result shows that all of the data are scattered above and below zero value. It is also being supported with the statistical analysis result (Park test) where the significance values of all independent variables are above 0.05.
312 hypothesis said that the brand equity and marketing mix simultaneously do not have significant influence towards consumer loyalty in the case study of Aqua in Surabaya can be tested with the F-test. Since the significance value is 0.000 that is below 0.05 and the significance F (P value) is 17.480 that are above 2.1731. Therefore it can be decided to reject the null hypothesis and concluded that the brand equity and marketing mix simultaneously have significant influence towards consumer loyalty in the case study of Aqua in Surabaya. It is also conforming the other
researcher’s results in section 2.3 that said brand
awareness and marketing mix simultaneously have significant impact towards customer loyalty.
The second type of hypotheses said that each independent variable of brand equity and marketing mix individually has significant influence towards consumer loyalty in the case study of Aqua in Surabaya. In order to test the hypotheses, the writer conducted t-test through the model of the regression. Below are the summary of the results from the t-test and an analysis will be explained for each independent variable included in the regression model.
Table 3. Regression Coefficient Test Summary
Model
Unstandardized
Coefficients Standardized Coefficients
Beta
t Sig. B Std.
Error
(Constant) .567 .531 1.066 .288
AVGBAW .277 .092 .254 3.008 .003
AVGPQ .189 .073 .180 2.592 .011
AVGBAS -.117 .087 -.088 -1.343 .182
AVGPD -.016 .094 -.014 -.170 .866
AVGPR .264 .086 .273 3.052 .003
AVGPL -.027 .065 -.027 -0.411 .682
AVGPO .303 .111 .245 2.722 .007
a. Dependent Variable: AVGCL
The first independent variable is brand awareness where the t value is 3.008 which is above 1.9785 and the significance value is 0.003 which is below 0.05. Therefore, the brand awareness has significant influence towards consumer loyalty in the case study of Aqua in Surabaya. Other researcher in section 2.3 also had brand awareness as one of the independent variable that agree that is predicted to have influence towards consumer loyalty. The results from their research agree that brand awareness has significant influence towards consumer loyalty. It also confirms one of the researchers in section 2.3 that brand awareness is the most significant variable that has influence towards consumer loyalty. It can be concluded through the coefficient value of brand awareness in this research (0.277) is the highest value compare with other independent variables. The
positive value of the coefficient also means that there is positive relationship between brand awareness and consumer loyalty. Therefore, the more the consumers aware of the brand, the more loyal they are.
The second independent variable is the perceived quality where the t value is 2.592 which is above 1.9785 and the significant value is 0.011 which is below 0.05. Therefore, the perceived quality has significant influence towards the consumer loyalty in the case study of Aqua in Surabaya. It confirms other
researchers’ from section 2.3 also used perceived
quality as one of the independent variable predicted to have significant influence towards consumer loyalty. From their results it agrees that perceived quality has significant influence towards consumer loyalty. The coefficient value of 0.189 which is a positive value means that there is a positive relationship between perceived quality and consumer loyalty. Therefore, the higher the quality of a brand, the more loyal also the consumers are.
The third independent variable is brand associations where the t value is -1.343 which is above -.19785 and the significance value is .182 which is above 0.05. Therefore, the brand associations
don’t have significant influence towards the consumer loyalty in the case study of Aqua in Surabaya. This result is not in accordance with the other researcher result in section 2.3. The possible reason is the benefits of consuming other brands of bottled drinking water will be the same as consuming the
brand of Aqua bottled drinking water. Thus, it won’t
affect the decision of the consumers in purchasing and being loyal with one brand of bottled drinking water. The coefficient value of -.117 which is a negative value means that there is a negative relationship between brand associations and consumers loyalty. However, since the significance value is above 0.05 it
doesn’t mean that the higher the brand associations,
the less loyal the consumers are.
The forth independent variable is product where the t value is -0.170 which is above -.19785 and the significance value is .866 which is above 0.05.
Therefore, product doesn’t have significant influence
towards the consumer loyalty in the case study of Aqua in Surabaya. This result is not in accordance with the other researcher result in section 2.3. The possible reason behind it is the consumers already perceived the Aqua bottled drinking water has high quality of product and has the ability to maintain its quality. As stated previously above that perceived quality has significant influence towards consumer loyalty in the case study of Aqua in Surabaya. The coefficient value of -.016 which is a negative value means that there is a negative relationship between product and consumers loyalty. However, since the
significance value is above 0.05 it doesn’t mean that
313 The fifth independent variable is price where the t value is 3.052 which is above 1.9785 and the significance value is 0.003 which is below 0.05. Therefore, price has significant influence towards consumer loyalty in the case study of Aqua in
Surabaya. It also confirms other researchers’ results in
section 2.3 that said price as one of the independent variable used has significant influence towards consumer loyalty. The coefficient value of 0.264 which is a positive value means that there is a positive relationship between price and consumer loyalty. Therefore, the more affordable the price, the more loyal also the consumers are.
The sixth independent variable is place where the t value is -.411 which is above -.19785 and the significance value is .682 which is above 0.05.
Therefore, place doesn’t have significant influence
towards the consumer loyalty in the case study of Aqua in Surabaya. This result is not in accordance with the other researcher result in section 2.3. The possible reason behind it is this type of product of bottled drinking water is believed to be easily found in the market of Surabaya. Thus, loyal consumers will tend to ignore the place variable as the influence for them to become loyal consumers. The coefficient value of -.027 which is a negative value means that there is a negative relationship between place and consumers loyalty. However, since the significance
value is above 0.05 it doesn’t mean that the more
accessible the place is, the less loyal the consumers are.
The last independent variable is promotion where the t value is 2.722 which is above 1.9785 and the significance value is 0.007 which is below 0.05. Therefore, price has significant influence towards consumer loyalty in the case study of Aqua in Surabaya. Other researchers in section 2.3 also had price as one of the independent variable that is predicted to have significant influence towards
consumer loyalty. From their research’s results it
agrees that price has significant influence towards consumer loyalty. The coefficient value of 0.303 which is a positive value means that there is a positive relationship between price and consumer loyalty. Therefore, the more interesting and often the promotion, the more loyal also the consumers are.
Adjusted R square test is done in this research in order to examine how much the independent variables can explain the dependent variable. Based on the result from table 4.23 below, the Adjusted R Square value is 0.472 meaning that 47.2% of the variation of the consumer loyalty in the case study of Aqua in Surabaya can be explained by the brand equity and marketing mix. The remaining 52.8% of the variation might be explained by other variables outside the regression model in this current research.
CONCLUSION
In this chapter, the writer will summarize all the findings and results that have been made throughout this research. At the beginning of this research, the writer has formulated five questions related with the problem of this research. Those statements of research problem asked about the impact of brand equity and marketing mix simultaneously and individually towards the consumer loyalty in the case study of Aqua in Surabaya, and also which variable of brand equity and marketing mix that has the most significant impact towards the consumer loyalty. From the research problems above, nine hypotheses were made in order to be the basis of the research. Afterwards, the writer used online questionnaires to gather the responses from the consumer of Aqua bottled drinking water in Surabaya. In this research, the writer has gathered 130 respondents that have qualified to fill the questionnaires by ever bought Aqua bottled drinking water before. Those responses will be processed through preliminary tests such as validity test and reliability test to show the data can are valid and reliable to be used for further analysis. Another preliminary test that is conducted is the classis assumption test, such as normality test, autocorrelation test, multicollinearity test, and heteroscedasticity test. The result from those tests show that the model is normally distributed, there is no autocorrelation, multicollinearity, heteroscedasticity in the model.
The next analysis is the multiple linear regression analysis to answer all five questions in the statement of research problem. Based on the result from the F-test, it can be concluded that the brand equity and marketing mix simultaneously have significant influence towards consumer loyalty in the case study of Aqua in Surabaya. Another result is from the t-test, it can be seen that only brand awareness, perceived quality, price, and promotion that individually have significant influence towards consumer loyalty in the case study of Aqua in Surabaya. While the other three independent
variables, brand associations, product, and place don’t
have significant influence towards consumer loyalty in the case study of Aqua in Surabaya. It is also concluded from the adjusted r square value, that those eight independent variables of brand equity and marketing mix can only describe 47.2% of the variation of consumer loyalty.
314 Thus, the company are able to have the insight to focus on those two factors in order to increase the loyalty of its consumer in Surabaya.
Moreover, the benefits for the reader of this research have also been achieved as the questions from the research problem have been answered. This research can be the basis for other researchers that want to conduct similar research in the future. The benefits for the writer also can be achieved as the writer has successfully finished the entire research process. Throughout this research, the writer has been applied the marketing theories into the real marketing research.
As the results that have been discussed above, five variables that have the significant impact towards consumer loyalty is brand awareness, perceived quality, price, and promotion. Thus, some recommendations will be given in order to increase the consumer loyalty of Aqua bottled drinking water in Surabaya.
From the result of the descriptive statistics, it shows that all 130 respondents have ever bought Aqua bottled drinking water before. It can be said that the brand awareness of Aqua bottled drinking water in Surabaya is already there. However, it cannot be concluded the level of brand awareness of Aqua bottled drinking water whether the consumers are only aware of Aqua or it become the top of mind of bottled drinking water. Thus, it is still needed for the company to increase the brand awareness of Aqua bottled drinking water. In order to increase the brand awareness of a brand, one way to do it is through effective and efficient promotion. As the promotion also become one of the factors that has high significant towards consumer loyalty.
First thing that the company can do is to maximize the promotion through social media and website. Social media can be an effective way to communicate with the consumers as it is easily accessible for both company and consumers in Surabaya. It is also being supported as the number of internet users in Surabaya is around 31% of the total population and most of them use the internet to open the social media (Asosiasi Penyelenggara Jasa Internet Indonesia, 2015). It is also mentioned that social media that is often being accessed is Facebook and Twitter. As Aqua has already had the Facebook and Twitter page, the thing the company need to do is to maximize them in promoting the brand of Aqua. From the website and social media of Aqua, the consumers can share their thoughts and opinion about the performance of Aqua. It can be done by having the feedback and critics section for both website and social media page of the company. From the website also it can uploads photos of events that Aqua join, the consistency of the quality of the product through product knowledge. From that it can increase the
consumer’s perception of the quality of Aqua.
Next suggestion in order to increase the brand awareness through promotion is by advertise the brand or product through several public events. As the number of public events such as food festivals or clothing expo is increasing in Surabaya, and it can absorb a lot of attention of Surabaya citizen to come. Aqua can be the sponsor of such events in order for them to communicate to the consumers the existence of the brand. Other thing that Aqua can do is promote their newly established product like Aqua Reflection in those events.
Lastly, bundling program can be considered to be given to the consumers due to price has significant influence towards consumer loyalty. Thus, Aqua needs to pay attention to the price of the bottled drinking water. By giving bundling program like 1 Aqua bottled drinking water 600ml, 1 Aqua Reflection can be sold for 12,000 rupiahs, from the normal price of 15,000 rupiahs. It also can be done to introduce new product of new packaging of the product.
In conducting this research, the writer believes that there is no such thing as perfection. Thus, the writer faces several limitations in conducting the research as follow. The limitation will be the
respondents’ profile. Here in this research the
respondents for this research are limited to only Surabaya consumers. And the result from the respondents who participated in this research is mostly 18-25 years old.
Regardless some limitations that are occurred in this research, the writer provides some suggestion for further research. The suggestion for further research is to widen the area coverage of the respondents. It can be done by increasing the area coverage of the research to another city instead of Surabaya only. As the consumers of Aqua bottled drinking water are not only coming from Surabaya area. The next thing is to
increase the variation of the respondents’ profile as
not only focusing on the several ages group.
REFERENCES
Aaker, D. A. (1991). Managing Brand Equity. San Fransisco: Free Press.
Aaker, D. A., & Joachimsthaler, E. (2000). Brand Leadership. San Fransisco: Free Press.
Alma, B. (2004). Manajemen Pemasaran dan Pemasaran Jasa. Bandung: Alfabeta.
Asosiasi Penyelenggara Jasa Internet Indonesia. (2015, March). Statistik: Profil Pengguna Internet Indonesia 2014. Retrieved from Asosiasi Penyelenggara Jasa Internet Indonesia:
http://www.apjii.or.id/v2/upload/statistik/Surve y%20APJII%202014%20v3.pdf
315 Tribunnews.com:
http://www.tribunnews.com/bisnis/2015/01/19/ konsumsi-air-minuman-dalam-kemasan-di-indonesia-capai-231-miliar-liter
Buhori, I. (2013, May 16). Foto: Laju pertumbuhan penduduk Indonesia terus meningkat.
Retrieved from merdeka.com:
http://www.merdeka.com/foto/jakarta/laju- pertumbuhan-penduduk-indonesia-terus-meningkat.html
Cahyono, C. D. (2013). Investigating the Influence of Marketing Mix Factors of Cleo Pure Water on Consumer Loyalty of Surabaya People. Cooper, D. R., & Schindler, P. S. (2014). Business
Researh Methods (12th ed.). New York: McGraw-Hill.
Cravens, D. W. (2000). Strategic Marketing. New York: The McGraw Hill Companies Inc. Darmadi, D., Sugiarto, & Sitinjak, T. (2001). Strategi
Menaklukan Pasar. Jakarta: PT. Gramedia Pustaka Utama.
Erviana, I. P., Suyadi, I., & Sunarti. (2013). The Effect of Brand Awareness, Brand Associations, Perceived Quality, and Brand Loyalty Towards Customer Loyalty.
Ghozali, I. (2011). Aplikasi Analisis Multivariate dengan Program IBM SPSS 19. Semarang: Badan Penerbit Universitas Diponegoro. Griffin, J. (2005). Customer loyalty = Menumbuhkan
dan Mempertahankan Kesetian Pelanggan. Jakarta: Erlangga.
Hooi, K. K. (2012). CUSTOMER LOYALTY, SATISFACTION AND MARKETING MIX: EMPIRICAL EVIDENCE FROM INFANT FORMULA INDUSTRY .
Kartajaya, H. (2006). Marketing Plus 2000: Siasat Memenangka Persaingan Global. Jakarta: PT Gramedia Pustaka Utama.
Keller, K. L. (2008). Strategic Brand Management: Building, Measuring, and Managing Brand Equity. New Jersey: Pearson/Prentice Hall. Knapp, D. E. (2002). The Brand Mindset.
Yogyakarta: Andi Offset.
Kotler, P., & Amstrong, P. (2007). Principle of Marketing (12 th ed.). New Jersey: Prentice Hall.
Kotler, P., & Keller, K. (2002). Marketing Management. New Jersey: Prentice Hall. Kotler, P., & Keller, K. (2019). Marketing
Management. New Jersey: Prentice Hall. Kotler, P., & Keller, K. L. (2012). Marketing
Management. New Jersey: Prentice Hall. Laksana, F. (2008). Manajemen Pemasaran.
Yogyakarta: Graha Ilmu.
Lind, D. A., Marchal, W. G., & Wathen, S. A. (2012). Statistical Techniques in Business & Economics (15th ed.). New York: McGraw-Hill.Mowen, J. C., & Minor, M. (1998).
Consumer Behavior. New Jersey: Prentice Hall.
Oliver, R. L. (1997). Satisfaction: A Behavioral Perspective on the Consumer. New York: Irwin/McGraw-Hill.
PT. Tirta Investama. (2011). Tentang Aqua: Nilai
Luhur. Retrieved from Aqua:
http://www.aqua.com/tentang_aqua/nilai-luhur Rangkuti, F. (2004). The Power of Brands: Teknik
Mengelola Brand Equity dan Strategi Pengembangan Merek. Jakarta: PT. Gramedia Pustaka Utama.
Seow-Chien Chew, R. M. (2009, August 24). Business Insights: Loyal customers help companies win market share in downturn. Retrieved from Bain & Company: http://www.bain.com/publications/articles/loya l-customers-help-companies-win.aspx
Sinthupinyo, P., & Ngamkroeckjoti, C. (2013). Using Group Comparisons to Explore Customer Loyalty Towards the Thai Bottled Drinking Water. The 2013 IBEA, International Conference on Business, Economics, and Accounting.
Steven A. Taylor, K. C. (2004). The Importance of Brand Equity to Customer Loyalty. Journal of Product & Brand Management, Vol. 13 Iss 4, 217-227.
Tjiptono, F. (2005). Brand Managemen & Strategi. Yogyakarta: Andi.
Tjiptono, F. (2005). Strategi Bisnis. Yogyakarta: Andi Offset.
Tjiptono, F. (2008). Strategi Pemasaran. Yogyakarta: Andi.
Top Brand Award. (2014). Top Brand Index 2014 Fase 2: Kategori Makanan dan Minuman. Retrieved from Top Brand Award: http://www.topbrand-award.com/top-brand-
survey/survey-result/top_brand_index_2014_fase_2
Wasesa, S. A. (2013, January 28). Marketingnesia: Club Aqua. Retrieved from marketing.co.id: http://www.marketing.co.id/club-aqua/
Yanto. (2013, January 16). Bisnis: Industri Air Minum Dalam Kemasan Terus Menggeliat. Retrieved
from bisnis.com: