Correlation Test Application of Supplier’s Ranking Using TOPSIS and
AHP-TOPSIS
Method
Ika Yuniwati
Postgraduate Statistics Program, Brawijaya University, Malang
Email: [email protected]
ABSTRACT
The supplier selection process can be done using multi-criteria decision making (MCDM) methods in firms. There are many MCDM Methods, but firms must choose the method suitable with the firm condition. Company A has analyzed supplier’s ranking using TOPSIS method. TOPSIS method has a marjor weakness in its subjective weighting. This flaw is overcome using AHP method weighting having undergone a consistency test. In this study, the comparison of supplier’s ranking using TOPSIS and AHP-TOPSIS method used correlation test. The aim of this paper is to determine different result from two methods. Data in suppliers’ ranking is ordinal data, so this process used Spearman’s rank and Kendall’s tau b correlation. If most of the ranked scored are same, Kendall’s tau b correlation should be used. The other way, Spearman rank should be used. The result of this study is that most of the ranked scored are different, so the process used Spearman rank p-value of Spearman’s rank correlation of 0.505. It is greater than 0.05, means there is no statistically significant correlation between two methods. Furthermore, increment or decrement of supplier’s ranking in one method is not significantly related to the increment or decrement of supplier’s ranking in the second method.
Keywords: Supplier’s ranking, TOPSIS method, AHP-TOPSIS method, and correlation test.
INTRODUCTION
In the competitive business environmet, the companies have to follow strategies to achieve reduced costs and higher quality. One of them, they must select the right suppliers. The supplier selection process requires evaluating various criteria in suppliers performance. Supplier ranking methods are required to know the right future supplier. Company A has implemented entry of Technique for Order Preference by Similiarity to Ideal Solution (TOPSIS) matrix with loss of performance of suppliers and subjective weighting for TOPSIS method. The main advantages of using this method is its simplicity. It takes into account all types of criteria (negative or positive criteria). It is also rational and understandable method. Company A wants to know the ranking of suppliers with AHP-TOPSIS method. In TOPSIS method, the entry of matrix TOPSIS is the company's losses in 50 times procurement of supplier performance in each criteria. In this study, AHP-TOPSIS method used entry matrix TOPSIS with oppinion of six experts. Then, the subjective weightings were replaced by Analytic Hierarchy Process (AHP) method weighting. AHP method weighting having undergone a consistency test.
That is because Spearman's rho limits the outlier to the value of its rank. While Kendall rank correlation coefficient, commonly referred to as Kendall's tau b coefficient is a statistic used to measure the ordinal association between two measured quantities. It is a measure of rank correlation, the similarity of the orderings of the data when ranked by each of the quantities. The result of correlation test was used to answer problem of Company A.
The purpose of this study is to determine the relationship of the decrease or increase of supplier ranking in TOPSIS and AHP-TOPSIS Method. Then Company A can make decision in supplier selection problem, it will choose TOPSIS or AHP-TOPSIS Method to identify criteria for evaluation of suppliers. There are six criterias of supplier selection in Company A. They are quality material, price, delivery time, purchase time, supply capability, and response to claim.
THEORITICAL REVIEW
Supplier selection problem have been discussed since 1960s. The study conducted by Dickson [1] identified 23 criteria to evaluate 170 buyers, namely: quality; delivery; performance history; warranties and claim policies, production facilities and capacity; price; technical capability; financial position; procedural compliance; communication system; reputation and position in industry; desire for business; management and organitation; operating controls; repair services; attitude; impression; packaging ability; labor relation records; geographical location; amount of pass bussiness; training aids; and reciprocal arrangement. Ellram [2] studied three principal criteria, namely: financial statement of supplier; organizational culture of supplier; and technological state of supplier. Wirdianto and Unbersa [3] developed criteria of supplier selection using Analytic Hierarchy Process in Company X. There are six criterias, those are condition of company, completeness of company document, price, quality, delivery, and service.
Various multi-criteria decision making (MCDM) methods have been suggested for supplier selection problem. Jannah, et al [4] used AHP to reassure raw material of good quality. The researchers used Quality, Cost, Delivery, Flexibility, Responsiveness (QCDFR) model. There are several suppliers which come from four different areas, namely Madura, Bondowoso,
Tulungagung, and Malang. Moreover, supplier’s ranking according to area were Madura,
Tulungagung, Bondowoso, and Malang. Wangchen and Phipon [5] applied AHP and TOPSIS for supplier selection problem. Based on AHP, they have calculated weights for each criterion and inputted those weights to TOPSIS method to rank suppliers. Then Shahroudi and Roydel [6] used ANP-TOPSIS to evaluate suppliers in Iran’s auto industry. The purpose of researchers integrated approach of ANP-TOPSIS choosed the best supplier and defined the optimum quantities order among selected suppliers by using Multi-Objective Linier Programming (MOLP). Lavanpriya, et al [7] integrated Taguchi Loss Function and TOPSIS method to select optimal supplier in manufacturing industry. They used two characteristics of Taguchi Loss Function, namely higher is better and lower is better. Loss of each criterion were inputted in matrix TOPSIS to rank suppliers. Afterwards, Onder and Dag [8] combined AHP and TOPSIS approaches to select cable company supplier. The company detected eight criteria for procurement of Electrolytic Copper Cathode. These are origin, quality, availability, cost, delivery requerements, cost of conveyance, reliability of supplier, and quality certificates. Ginting, et al [9] evaluated raw material suppliers using AHP and Loss Function. They calculated AHP weighting and Loss Function weighting. Then they multiplyed AHP weighting and Loss Function weighting to determine total loss. Based on total Loss, they selected the best suppliers performance. Moreover, Bhatt [10] integrated AHP and TOPSIS approach to select the best supplier in automotive industry.
Using Topsis Method to rank the suppliers
(non-optimal solutions). According Wangchen and Phipon [5]; Tzeng and Huang [12] general measures of TOPSIS Method consists of seven steps.
1. Establish a decision matrix for ranking. When given a set of alternatives, 𝐴 = {𝐴𝑘|𝑘 = 1, … , 𝑛 },
2. Normalize the decision matrix 𝐷 by using the following formula (2)
𝑟𝑘𝑗 = 𝑥𝑘𝑗
√∑𝑛𝑖=1𝑥𝑘𝑗2
𝑘 = 1, … 𝑛; 𝑗 = 1, … , 𝑚.
(2)
3. Construct the weighted normalized decision matrix by multiplying the normalized decision matrix by its associated weights. The weighted normalized value (3) is calculated as
𝑣𝑘𝑗 = 𝑤𝑗𝑟𝑘𝑗, 𝑘 = 1, … 𝑛; 𝑗 = 1, … , 𝑚 (3)
4. Determine the positive ideal solution and negative ideal solution
The ideal solution positive is denoted A+ by and negative ideal solution is denoted by A-,
they can be expressed in equation (4) and (5)
𝐴+ = {(max 𝑣
Separation measure is a measurement of the geometric distance of an alternative to the positive ideal solution and negative ideal solution. The separation measure of each alternative from the positive ideal one (6) is given by :
𝑆𝑘+= √∑ (𝑣𝑘𝑗− 𝑣𝑗+)2
𝑛
𝑗=1 , where k = 1, 2, 3, … n (6)
𝑆𝑘−= √∑ (𝑣𝑘𝑗− 𝑣𝑗−)2 𝑛
𝑗=1 , where k = 1, 2, 3, … n (7)
6. Calculate the relative closeness to the ideal solution
The relative closeness of with Ai respect to A+ is defined as equation (8)
𝐶𝑘 = 𝑆𝑘 −
𝑆𝑘−+ 𝑆𝑘+, where 0 < 𝐶𝑘< 1 and ∀𝑘 = 1,2,3, … 𝑚 (8)
7. ank the preference order
The larger the 𝐶𝑘 value, the better performance of the suppliers
Using ahp-topsis Method to Rank The Suppliers
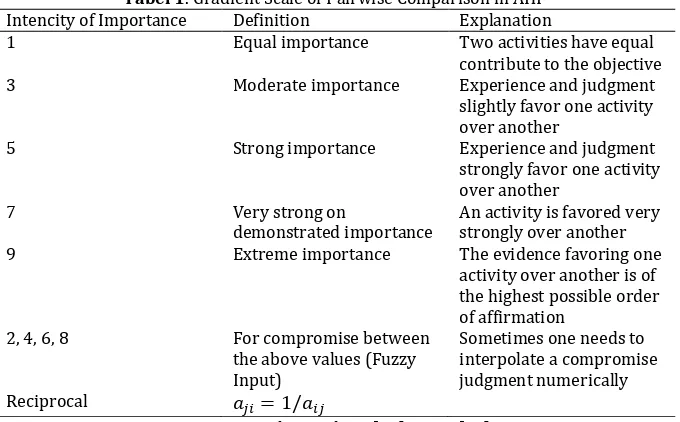
AHP-TOPSIS method is MCDM method which combined AHP and TOPSIS method. Based on AHP, we have calculated weights for each criteria and inputted those weights to TOPSIS method to rank suppliers. Analytic Hierarchy Process (AHP) developed in the 1970s by Thomas Saaty [12]. It has beeen used for analyzing complex decision. There are several steps in AHP method. The first step covers define the problem, determine criteria, structure the decision hierarchy. Afterwards, We collected data from experts using gradient scale of Saaty in Table 1.
Tabel 1. Gradient Scale of Pairwise Comparison in AHP
Intencity of Importance Definition Explanation
1 Equal importance Two activities have equal
contribute to the objective
3 Moderate importance Experience and judgment
slightly favor one activity over another
5 Strong importance Experience and judgment
strongly favor one activity
9 Extreme importance The evidence favoring one
activity over another is of
Sources: Bushan and Rai [13], Saaty [14]
Weighting the criteria by multiple experts avoid the bias decision making. Saaty [14] said geometric mean to obtain a sigle assesment of variety different opinions on the same criteria. Geometric mean calculated by the following formula (9)
Afterwards, the result of pairwise comparison in each criterion inputted in a square matrix. It can be represented by Matrix A in equation (10)
𝐴 = [𝑎𝑖𝑗] = [
The next step of AHP, normalize matrix by using formula (11)
𝑎𝑖𝑗′ =∑𝑎𝑖𝑗𝑎 𝑖𝑗 𝑛
𝑖=1 (11)
After normalization matrix process, it will be determined weighting in each criterion by formula (12)
𝑤𝑖 =
∑𝑛 𝑎𝑖𝑗′ 𝑗=1
𝑗 (12)
Saaty [15] said to avoid inconsistency in AHP, we must use maximum Eigen value (𝜆𝑚𝑎𝑥). It purposed for calculate effectiveness of decision. Mukherjee [16] calculated maximum Eigen value (13) by
𝜆𝑚𝑎𝑥 =∑ 𝑎𝑖𝑗𝑤𝑖
𝑛 𝑖=1
𝑛 , 𝑖 = 1,2,3, … 𝑛 (13)
For measure consistency index (CI) adopt the value (14)
𝐶𝐼 =𝜆𝑚𝑎𝑥𝑛 − 1− 𝑛 (14)
Accept the estimate of w if the consistency ratio (CR) of CI that random matrix is significant small. The Cr is obtained comparing the CI with an average random consistency index (RI). Saaty [15] showed that the matrix is consistent, then the CR value ≤0,05 for n = 3, CRvalue ≤0,08 for n = 4, and CR value ≤0,1 forn≥5. RI value can be seen in Table 2.
Tabel 2. List of Random Consistency Index (RI) Value
N 3 4 5 6 7 8 9 10 11 12 13 14 15
RI 0,58 0,90 1,12 1,24 1,32 1,41 1,45 1,49 1,51 1,48 1,56 1,57 1,59
Sources: Tzeng and Huang [12]
In AHP-TOPSIS method, AHP method weighting in formula (12) used in formula (3). Based
on the process we got supplier’s ranking from formula (8) in the second method.
Correlation Test
According to Karami [17] comparison of two methods of MCDM can be done using Spearman Rank Correlation Test. Spearman Rank Correlation Coefficient (rho) shows the strength of the relationship of two variables or two MCDM methods were compared. The formula to get the value of rho [18] as follows:
n: the sample size (supplier)
Hypothesis of Spearman Rank Correlation Test as follows H0 : 𝑟𝑠 = 0
H1 : 𝑟𝑠 ≠ 0
Significance test p-value is known through the test t with 𝑡 = 𝑟𝑠√𝑛−2
1−𝑟𝑠2. If the p-value less
than or equal to 0.05, then reject H0, The conclusion is there is no statistically significant correlation between two variable, so increase and decrease in one variable is not significantly related to increase or decrease in second variable.
Karami [17] also suggests a comparison of two methods of MCDM can use Kendall's Tau b correlation to determine the strength of the relationship between two variables or two methods of MCDM. The test is used when a lot of ranked score are same. The formula used to calculate the correlation Kendall's Tau b [18]:
𝑇 =𝑛(𝑛 − 1) 2𝑆 (16)
Where
S = total score of all (grand total) = sum of (concordant - discordant) n = sample size
Hypothesis of Correlation Kendall's Tau b as follows
H0 : 𝑇 = 0 H1 : 𝑇 ≠ 0
Significance test p-value is known through the t test, if the p-value less or equal to 0.05, then reject H0, thus conclusion there is not relationship between these two variables. So increase and decrease in one variable is not significantly related to increment or decrement in the second variable.
RESULTS AND DISCUSSION
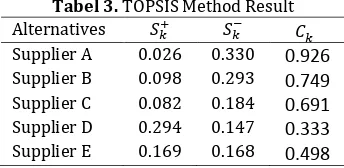
In this study, we used case study in Company A which have six criterias of supplier performance. Then we analyzed their performance in TOPSIS and AHP-TOPSIS method. By using TOPSIS method, the ranking of alternative suppliers are calculated. Table 3 shows the evaluation result and final ranking of alternative suppliers.
Tabel 3. TOPSIS Method Result
Alternatives 𝑆𝑘+ 𝑆𝑘− 𝐶𝑘
Supplier A 0.026 0.330 0.926
Supplier B 0.098 0.293 0.749
Supplier C 0.082 0.184 0.691
Supplier D 0.294 0.147 0.333
Supplier E 0.169 0.168 0.498
Sources: Data calculated by researcher
Depends of the 𝐶𝑘 value, the supplier’s ranking in TOPSIS method from top to bottom order are supplier A, supplier B, supplier C, supplier E, and supplier D.
Tabel 4. The pairwise comparison matrix for criteria
C1 C2 C3 C4 C5 C6
C1 1.000 1.308 1.201 4.155 2.840 2.720
C2 0.765 1.000 1.000 2.646 1.661 3.271
C3 0.833 1.000 1.000 4.583 3.460 4.524
C4 0.241 0.378 0.218 1.000 1.886 2.498
C5 0.352 0.602 0.289 0.530 1.000 3.979
C6 0.368 0.306 0.221 0.400 0.251 1.000
Sources: Data calculated by researcher
Where C1 is quality material, C2 is price, C3 is delivery time, C4 is purchase time, C5 is supply capability, C6 is response to claim. Then the next step of AHP method determined Eigen value.
Tabel 5. Eigen Value in Each Criteria Criteria of Supplier Selection Eigen Value
Quality material 0,2651
Price 0,2029
Delivery time 0,2689
Purchase time 0,0982
Supply capability 0,1091
Response to claim 0,0557
Sources: Data calculated by researcher
Table 5 shows that the most important criteria in supplier selection in Company A is delivery time. Based on Eigen value, the importance of criteria can be rated from top to bottom order are delivery time criteria, quality material criteria, price criteria, supply capability criteria, purchase time criteria, and response to claim criteria. Moreover, consistency test will be done by determined 𝜆𝑚𝑎𝑥, CI, and CR. The result of 𝜆𝑚𝑎𝑥 and CI are 0.6543 and 0.091. Then CI value were compared with IR in ordo 6 x 6. The result of CR is 0.073, so eigen value can be used in TOPSIS method weighting. It expressed in Figure 1.
Figure 1. TOPSIS Weighting in AHP-TOPSIS Method
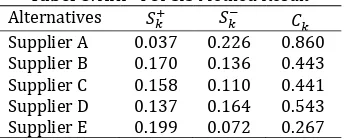
After consistency test of AHP method, the process continued in TOPSIS method. By using AHP weighting method, the result of AHP-TOPSIS method can be showed in Table
Tabel 6. AHP-TOPSIS Method Result
Alternatives 𝑆𝑘+ 𝑆𝑘− 𝐶𝑘
Supplier A 0.037 0.226 0.860
Supplier B 0.170 0.136 0.443
Supplier C 0.158 0.110 0.441
Supplier D 0.137 0.164 0.543
Sources: Data calculated by researcher
Depends of the 𝐶𝑘 value in Table 6, the supplier’s ranking in TOPSIS method from top to bottom order are supplier A, supplier D, supplier B, supplier C, and supplier E.
Correlation test indicated relationship between two methods, so each supplier should be given scored rank. It can be showed in Table 7. Afterwards they will be observed to determine number of the same scored.
Tabel 7.Supplier’s Ranking in Two Methods Alternatives TOPSIS Method AHP-TOPSIS Method
Supplier A 1 1
Supplier B 2 3
Supplier C 3 4
Supplier D 5 2
Supplier E 4 5
Sources: Data calculated by researcher
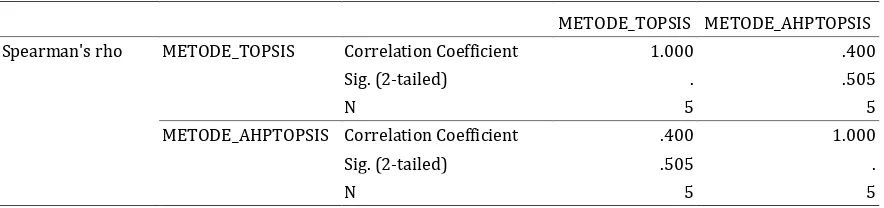
Most of scored rank in two methods are different, so we used Speraman Rank Correlation. The result of Spearman rho can be expressed in Table 8.
Sig. (2-tailed) in Spearman’s rho is 0.505. It is less than 0.05, so The conclusion is there is no statistically significant correlation between two variable, so increase and decrease in one variable is not significantly related to increase or decrease in second variable.
CONCLUSION
Multi-criteria decision making becomes important strategic decision in complex and competitive business life. The company should choose the right method of MCDM, in order to they
can select the best supplier in the future. Correlation test (Speraman’s rho and Kendall’s tau b correlation) can be used to determine supplier’s ranking between two methods. If suppliers’s
ranking of two method is different, the process can be continued with sensitivity and accuracy method. It purposed to determine the best MCDM.
REFERENCE
[1] G. W. Dickson, "An analysis of vendor selection systems and decisions," pp. --, 1996.
[2] L. M. Ellram, G. A. Zsidisin, S. P. Siferd and M. J. Stanly, "The impact of purchasing and supply management activities on corporate success," Journal of Supply Chain Management, vol. 38, no. 4, pp. 4-17, 2002.
[3] E. Wirdianto and E. Unbersa, "Aplikasi Metode Analytical Hierarchy Process dalam Menentukan Kriteria Penilaian Supplier," Jurnal Teknik Industri, vol. 2, no. 29, pp. --, 2008.
Tabel 8. Correlations Test Result
METODE_TOPSIS METODE_AHPTOPSIS
Spearman's rho METODE_TOPSIS Correlation Coefficient 1.000 .400
Sig. (2-tailed) . .505
N 5 5
METODE_AHPTOPSIS Correlation Coefficient .400 1.000
Sig. (2-tailed) .505 .
[4] M. Jannah, M. Fakhry and Rahmawati, "Pengambilan Keputusan untuk Pemilihan Supplier Bahan Baku dengan Pendekatan Analytic Hierarchy Process di PT PAHALA Sidoarjo," Jurnal Agrointek, vol. 5, pp. 88-97, 2011.
[5] P. W. Bhutia and R. Phipon, "Appication of ahp and topsis method for supplier selection problem," IOSR Journal of Engineering (IOSRJEN) Volume, vol. 2, pp. 43-50, 2012.
[6] K. Shahroudi and H. Rouydel, "Using a multi-criteria decision making approach (ANP-TOPSIS) to evaluate suppliers in Iran†™s auto industry," International Journal of Applied Operational Research-An Open Access Journal, vol. 2, no. 2, pp. 0-0, 2012.
[7] C. Lavanpriya, V. M. Mauralidaran and C. Laksmanpriya, "A Case Study of Integrating The Taguchi Loss Function and TOPSIS Method to Select an Optimal Supplier in a Manufacturing Industry," Journal IFBM, vol. 1, pp. 18-22, 2013.
[8] E. Onder and S. Dag, "Combining Analytical Hierarchy Process and Topsis approaches for supplier selection in a cable company," Journal of Business, Economics and Finance (JBEF), vol. 2, pp. 56-74, 2013.
[9] E. S. Ginting, "Evaluasi Supplier Bahan Baku pada PT XYZ dengan Menggunakan Metode AHP dan Loss Function," pp. --, 2015.
[10] N. Bhatt, "An Integrated AHP-TOPSIS Approach in Supplier Selection: An Automotive Industry as a Case Study," The International Journal of Business \& Management, vol. 3, no. 8, pp. 160--, 2015. [11] K. P. Yoon and C.-L. Hwang, Multiple attribute decision making: an introduction, vol. 104, Sage
publications, 1995, pp. --.
[12] G.-H. Tzeng and J.-J. Huang, Multiple attribute decision making: methods and applications, CRC press, 2011, pp. --.
[13] N. Bhushan and K. Rai, Strategic decision making: applying the analytic hierarchy process, Springer Science \& Business Media, 2007, pp. --.
[14] T. L. Saaty, "Pengambilan keputusan bagi para pemimpin," Terjemahan). PT Pustaka Binaman Pressindo, Jakarta, pp. --, 1993.
[15] T. L. Saaty, "The analytic hierarchy process: planning, priority setting, resources allocation," New York: McGraw, pp. --, 1980.
[16] K. Mukherjee, "Analytic hierarchy process and technique for order preference by similarity to ideal solution: a bibliometric analysis †˜ from†™past, present and future of AHP and TOPSIS," International Journal of Intelligent Engineering Informatics, vol. 2, no. 2-3, pp. 96-117, 2014.
[17] A. Karami, "Utilization and comparison of multi attribute decision making techniques to rank bayesian network options," pp. --, 2011.