Anindita Chakravarty, Alok Kumar, & Rajdeep Grewal
Customer Orientation Structure for
Internet-Based Business-to-Business
Platform Firms
Internet-based business-to-business platforms involve a buyer side transacting with a seller side, both of which are customers of an intermediary platform firm. Dyadic viewpoints implicit in conventional theories of customer orientation thus must be modified to apply to a triadic relationship system (seller–platform–buyer) in platform settings. The authors propose that customer orientation of platform firms consists of total customer orientation (customer orientation toward both the buyer and seller sides) and customer orientation asymmetry (customer orientation in favor of the seller relative to the buyer side) and examine the antecedents and consequences of these orientations. Data from 109 business-to-business electronic platforms reveal that buyer- (seller-) side concentration increases total customer orientation and customer orientation asymmetry toward sellers (buyers). These positive effects are weaker when buyers and sellers interact directly (two-sided matching) versus indirectly (one-sided matching) and are stronger when the offering prices vary (dynamic price discovery) versus remain stable (static price discovery) during negotiations. Finally, total customer orientation increases platform performance by itself and in interaction with customer concentration, but orientation asymmetry increases performance only in conjunction with customer concentration.
Keywords: customer relationship marketing, business-to-business marketing, customer orientation, electronic markets, survey
Anindita Chakravarty is Assistant Professor, Department of Marketing, Terry College of Business, University of Georgia (e-mail: achakra@ uga. edu). Alok Kumar is Assistant Professor, Department of Marketing, College of Business Administration, University of Nebraska–Lincoln (e-mail: akumar5@ unl.edu). Rajdeep Grewal is the Townsend Family Distinguished Professor of Marketing, Kenan-Flagler Business School, University of North Carolina at Chapel Hill (e-mail: grewalr@kenan-flagler. unc. edu). All authors con-tributed equally and are listed randomly. The authors acknowledge feedback from John Hulland, Hari Sridhar, and Raji Srinivasan on a previous draft of this article. The article also benefited from the feedback of JM review-ers. Jan-Benedict E.M. Steenkamp served as area editor for this article.
B
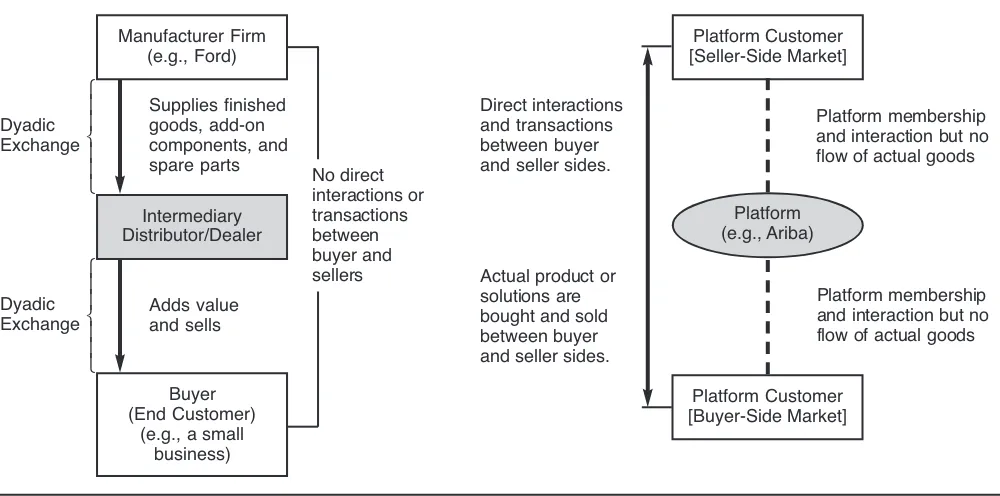
usiness-to-business (B2B) exchange is oftencon-ducted through e-commerce platforms that provide the infrastructure to facilitate interactions between user firms in so-called multisided markets (Dagenais and Gautschi 2002; Jap 2003). Multisided electronic markets involve an Internet-based intermediary platform firm that must attract two or more groups of users that occupy dis-tinct functional roles (e.g., buyers and sellers) and “value each other’s participation onboard the same platform to generate any economic value” (Silverthorne 2006). For example, as Figure 1 illustrates, businesses such as eBay and Ariba must attract bothbuyers and sellers for their con-tinued existence; without participation from either side, these platforms would be defunct (Cennamo and Santalo
2013; Mittal and Sawhney 2001).1 Thus, multisided plat-forms are distinct from traditional B2B relationships, in which the interaction between different sides is not a condi-tion for value generacondi-tion; for example, Ford’s suppliers are not viewed as its customers or required to interact with Ford’s customers (i.e., automobile buyers).
Our research focuses on such two-sided2B2B electronic platforms (or electronic marketplaces) that connect seller firms and buyer firms and enable them to negotiate and transact; for example, Tradeford.com brings together auto-motive equipment suppliers (seller side) and automobile manufacturers (buyer side). The U.S. Census Bureau (2012) recognizes the importance of B2B electronic platforms for economic growth and notes that B2B e-commerce in the United States has increased from sales of less than $.5 trillion in 2001 to $1.6 trillion in 2004 and $3.7 trillion in 2010. A wide range of industries engage in B2B e-commerce through electronic platforms, including automobiles (18% 1Multisided markets differ from multiple customer segments, in
which all customer segments are buyers. For example, Coca-Cola sells to both businesses and individuals, but both segments are buyers to Coca-Cola. In contrast, platforms have distinct seller and buyer sides, characterized by demand externalities such that a greater number of participants on one side attracts participants on the other side. No such direct externalities exist among the multi-ple customer segments of Coca-Cola.
2We consider only B2B platforms on which actors external to the
of industry sales occur through such platforms), metals and machinery (17%), chemicals (14%), petroleum (13%), and electronics (9%) (U.S. Census Bureau 2012). Examples of B2B platforms include Virtual Chip Exchange (electronics), ChemConnect (chemicals), and Catex Exchange (insur-ance). With their cross-industry scope and economic impor-tance, B2B platforms have begun to garner more attention from diverse disciplines such as economics (e.g., Rochet and Tirole 2006), management (e.g., Parker and Van Alstyne 2005), and law (e.g., Evans 2008).
A fundamental marketing challenge for B2B platforms stems from the complexity associated with managing differ-ent customer sides with distinct, even conflicting, demands. Customers are the “lifeblood” (Gupta and Lehmann 2005, p. 2) of any organization, and customer orientation is the primary mechanism for engaging customers (Kirca, Jay-achadran, and Bearden 2005; Kumar et al. 2011; Narver and Slater 1990); yet no systematic research has addressed how platform firms manage their customers. Therefore, in this article, we build on extant customer orientation research to explicate the nature, antecedents, and consequences of cus-tomer orientation for B2B platforms. Practitioners (e.g., Sculley and Woods 2001) have already recognized the salience of customer orientation for enabling B2B platforms to acquire and retain customers; for example, 80% of prospective customers rely on customer satisfaction out-comes to decide whether to participate on a focal platform,
and 61% of platform executives view customer manage-ment as their top priority (Oracle 2011).3
Customer management on B2B platforms differs from that in dyadic relationships as typically studied in market-ing. In a dyadic exchange, a manufacturer procures compo-nents from upstream suppliers, integrates them into its final products, and sells the products to downstream buyers; buy-ers are the only custombuy-ers of the manufacturer. In contrast, a B2B platform is a triadic exchange system involving a seller side, a buyer side, and the intermediary platform (Hagiu and Wright 2013). The platform’s role is to attract and retain quality participants on both sides, so it faces a complex customer management task. First, the platform must exhibit its customer orientation toward both sides because its success depends on continued patronage by both (Evans 2008). Second, as is true of any interfirm system (Geyskens, Steenkamp, and Kumar 2006; Shervani, Frazier, and Challagalla 2007), the platform and its customers are interdependent, which influences the platform’s customer orientation. When confronted by powerful actors on one side of the market, for example, a platform might opt to exhibit differential levels of customer orientation toward the two sides of its market.
From these two complexities, we propose a two-dimensional conceptualization of customer orientation that consists of total customer orientation and customer orienta-tion asymmetry. Total customer orientaorienta-tion is the extent to which a platform firm engages in efforts to understand, serve, and satisfy its customers, irrespective of their affilia-tion with buyer or seller sides. It thus reflects the premise that a platform must satisfy the needs of both buyers and sellers, which are both customers of the platform (Hagiu 2007; Rochet and Tirole 2006). In contrast, customer orien-tation asymmetry is the extent to which the platform firm understands, serves, and satisfies one customer side more
FIGURE 1
3A recent report by Hybris GmbH (2013) explicitly states that “the
than the other; this factor captures the possibility that some platforms focus their customer efforts more on one side of the marketplace than on the other side.
To study the antecedents and consequences of this pro-posed customer orientation structure, we rely on power-dependence theories pertaining to interfirm relationships (Frazier 1983; Kumar, Scheer, and Steenkamp 1995). We describe how platforms manage their dependence on pow-erful buyers (and sellers) both by appeasing the powpow-erful partners (i.e., offering greater transaction utilities directly to the powerful side) and by balancing their dependence on the powerful partners (i.e., by bonding with the other side of the marketplace to countervail the powerful side) (e.g., Emerson 1962). For antecedents, we hypothesize that plat-form firms nurture their total customer orientation and cus-tomer orientation asymmetry in accordance with their per-ceived dependence (captured as customer concentration) on both sides of the market. Consistent with broader B2B research (e.g., Ghosh, Dutta, and Stremersch 2006; Kashyap, Antia, and Frazier 2012), we also posit that cer-tain attributes of platform-based exchange process, such as uncertainty and switching costs, moderate the effect of a platform’s dependence on its customer orientation. In terms of consequences, we posit that both components of platform customer orientation support platform performance, contin-gent on the dependence considerations at hand. A unique field study of U.S.-based B2B platforms largely supports our hypotheses.
Business-to-business platforms are proliferating, but research in marketing on this topic has only just begun to emerge (e.g., Kaplan and Sawhney 2000; Grewal, Chakravarty, and Saini 2010; Sridhar et al. 2011). Our research contributes to the body of marketing literature by describing platform firms’ customer practices. Although customer orientation is elemental to any exchange and rep-resents “a central doctrine” (Lusch and Laczniak 1987, p. 1) in marketing, it remains unexplored for platform firms (Gawer and Cusumano 2008; Rochet and Tirole 2006). Our research also adds to the interfirm relationships literature by highlighting the relevance of power-dependence theories for customer orientation in platform-based exchange. Limited extant research on platforms, which has appeared primarily in the field of economics, has focused almost exclusively on pricing issues and adopts analytical approaches (e.g., Chakravorti and Roson 2006; Rochet and Tirole 2006). In contrast, we (1) describe the complex interplay of a plat-form’s customer management efforts and theoretically salient attributes of the platform-based exchange process (i.e., platform attributes) and (2) use unique real-world data to test how this interplay influences platform performance. For practitioners, we also describe how and when customer orientation creates value in platform-based exchange (Kirca, Jayachandran, and Bearden 2005; Kumar et al. 2011). An IBM Institute for Business Value (1999) study affirms the utility of such recommendations by noting that the key challenge facing B2B platforms is managing trade-offs across customer sides while providing superior cus-tomer experiences.
In the next section, we describe platform-based exchange and propose a customer orientation framework for platform firms. We then discuss the antecedents and per-formance consequences of these elements and present our hypotheses. Then, we describe our research methodology and findings before closing with a discussion of the impli-cations of our research.
Conceptual Background
Platform Firms and Traditional B2B Exchange
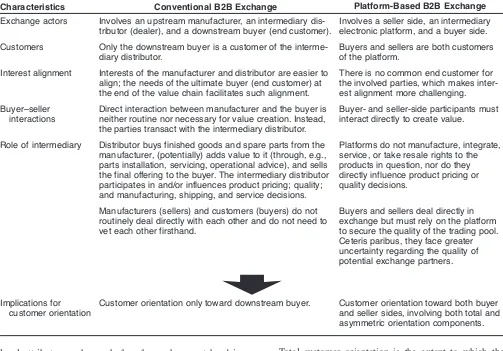
As depicted in Figure 1 and described in Table 1, several critical differences exist between platform-based exchange and traditional B2B exchange. First, a traditional B2B sup-ply chain comprises an upstream manufacturer, an interme-diary distributor (or dealer), and a downstream buyer or end customer (e.g., a small business). In this vertical chain, the needs of the common buyer promote alignment between the interests of the manufacturers and distributors. In contrast, B2B platforms lack a common buyer for all the involved parties, which makes such interest alignment inherently challenging. Second, the distributor manages the upstream and downstream relationships as two distinct dyadic rela-tionships; even if the two relationships influence each other indirectly (Wuyts and Geyskens 2005), the upstream seller (i.e., manufacturer) and the downstream buyer do not typi-cally transact or interact directly. In contrast, platform-based exchange relationships are triadic in that the platform serves only as a go-between, enabling the buyer and seller sides to interact directly with each other. Economic value is created only through interaction between the sides (Hagiu 2007). Thus, a core benefit that each side seeks from the platform is access to participants on the other side; the pres-ence of quality buyers (sellers) motivates sellers (buyers) to transact, but a lack of sellers (buyers) could drive buyers (sellers) away from the platform (Evans 2008). Thus, both sides are customers of the platform, which must cultivate customer orientation toward both sides.
Third, the buyer and seller sides of a platform feature distinct characteristics. For example, a dominant (powerful) side might demand more favorable exchange terms from the platform relative to the less powerful side (Archer and Gebauer 2000). As such, the platform must decide purpose-fully whether to invest in different levels of customer orien-tation toward the two sides of the marketplace. Such com-plications are not present in conventional exchange.
platform-level attributes, such as whether the exchange at hand is one-sided.
Finally, in a conventional dyadic B2B exchange, the distributor has multiple avenues it can use to manage cus-tomers, such as servicing, product pricing, and promotional actions (Kashyap, Antia, and Frazier 2012; Palmatier, Dant, and Grewal 2007). Within a platform context, however, the intermediary (platform) has no direct involvement in or control over production, pricing, or service decisions. Thus, customer orientation efforts offer one of the few avenues platforms can apply to retain their customers.
Customer Orientation of Platform Firms
Following extant research (e.g., Jaworski and Kohli 1993), we define customer orientation as the extent to which a platform aims to understand, serve, and satisfy customers’ (buyers’ and sellers’) needs. In our context of B2B platform firms, customer orientation behaviors involve tailoring trad-ing interfaces, technical help lines, and work flow support systems to meet the specific needs of buyers and sellers in a given industry (Archer and Gebauer 2000). To delineate platform customer orientation, we rely on relationship mar-keting constructs such as interfirm dependence (Kumar, Scheer, and Steenkamp 1995) to propose two distinct com-ponents of customer orientation: total customer orientation and customer orientation asymmetry.
Total customer orientation is the extent to which the behavior of a platform firm is geared toward understanding, serving, and satisfying the needs of both buyers and sellers. This notion assesses the platform’s orientation toward both buyers and sellers collectively and reflects a view of plat-form relationships as an “interdependent” (Kumar, Scheer, and Steenkamp 1995, p. 348) exchange system. Inter-dependence arises because the platform relies on both buy-ers and sellbuy-ers for revenues, so it must maintain customer orientations toward and provide transaction efficiencies to both sides (Bakos 1991; Wang and Benaroch 2004). Because the appeal of a platform to a prospective partici-pant on each side depends partly on the quality of the trad-ing partners on the other side (Evans and Schmalensee 2010), platforms must cultivate customer orientations toward both sides. Customer orientation asymmetry, in con-trast, is the extent to which a platform firm understands, serves, and satisfies one customer side (e.g., sellers) more than the other side (e.g., buyers). To conceptualize this con-struct, we draw on marketing research suggesting that inter-firm dependence, which motivates inter-firms to engage with customers in the first place, can entail asymmetric positions on the part of the firms involved. Gupta and Lehmann (2005) argue that various customers offer differing “[perfor-mance] value” to a firm, which should be factored into the firm’s customer orientation decisions. More specifically, different sides of a platform exhibit distinct characteristics
Characteristics Conventional B2B Exchange Platform-Based B2B Exchange
Exchange actors Involves an upstream manufacturer, an intermediary
dis-tributor (dealer), and a downstream buyer (end customer).
Involves a seller side, an intermediary electronic platform, and a buyer side.
Customers Only the downstream buyer is a customer of the
interme-diary distributor.
Buyers and sellers are both customers of the platform.
Interest alignment Interests of the manufacturer and distributor are easier to
align; the needs of the ultimate buyer (end customer) at the end of the value chain facilitates such alignment.
There is no common end customer for the involved parties, which makes inter-est alignment more challenging.
Buyer–seller interactions
Direct interaction between manufacturer and the buyer is neither routine nor necessary for value creation. Instead, the parties transact with the intermediary distributor.
Buyer- and seller-side participants must interact directly to create value.
Role of intermediary Distributor buys finished goods and spare parts from the
manufacturer, (potentially) adds value to it (through, e.g., parts installation, servicing, operational advice), and sells the final offering to the buyer. The intermediary distributor participates in and/or influences product pricing; quality; and manufacturing, shipping, and service decisions.
Platforms do not manufacture, integrate, service, or take resale rights to the products in question, nor do they directly influence product pricing or quality decisions.
Manufacturers (sellers) and customers (buyers) do not routinely deal directly with each other and do not need to vet each other firsthand.
Buyers and sellers deal directly in exchange but must rely on the platform to secure the quality of the trading pool. Ceteris paribus, they face greater uncertainty regarding the quality of potential exchange partners.
Implications for customer orientation
Customer orientation only toward downstream buyer. Customer orientation toward both buyer
and seller sides, involving both total and asymmetric orientation components. TABLE 1
(e.g., dependence on the platform), which might dictate dif-ferent levels of the platform’s customer efforts (Pavlou and El-Sawy 2002). Prior research in marketing (e.g., Anderson et al. 2001; Anderson and Jap 2005) and information sys-tems (Chatterjee and Ravichandran 2004; Dagenais and Gautschi 2002) has agreed that a firm’s willingness to invest resources in an interfirm relationship increases as the focal partner becomes more dependent on it and, therefore, becomes easier to manage. A platform thus might orient itself more toward the side of the market on which it is less dependent.
As an example of an asymmetrically oriented platform, consider Covisint, a B2B platform operating in industries such as health care, automobiles, and financial services, which offers greater control to buyers in the bidding process. In contrast, Catex Global Exchange, an insurance B2B platform, focuses on the seller side and offers sellers specialized risk-management data and software, an elec-tronic invoicing system, and network-building tools. Thus, asymmetric orientation can exist toward either side of the market. For consistency, we consider asymmetry toward sellers relative to buyers in our study, unless otherwise noted.
Antecedents of Customer Orientation
Because platform-based exchange represents a system of dependence relationships, we rely on power-dependence theories (e.g., Emerson 1962) to identify the platform’s dependence on marketplace participants as a key antecedent of its customer orientation.4A widely used gauge of depen-dence in interfirm contexts is market concentration: more-concentrated markets are dominated by larger players, unlike less-concentrated markets (Pfeffer and Salancik 1978). In a platform context, buyer (seller) concentration is the extent to which the platform’s business disperses across buyers (sellers); as the number of buyers (sellers) decreases or their sizes increase, market concentration increases. When the concentration of buyers (sellers) increases, the platform’s dependence on them increases as well. In turn, we expect dependence considerations to influence a plat-form’s customer orientation decisions, in line with research that recognizes the relevance of market concentration for market orientation (Jaworski and Kohli 1993; Ramani and Kumar 2008).
Beyond the direct dependence-based effect of buyer-(seller-) side concentration on a platform’s customer orien-tation, we refer to contingency frameworks in the interfirm literature (Kim et al. 2011; Rindfleisch and Moorman 2003) to predict that certain platformspecific contextual attri -butes— which are also viewed as key descriptors of a plat-form’s business model in information systems research (Bakos 1991; Pavlou and El-Sawy 2002)—moderate the effect of buyer (seller) concentration. These contextual attributes are (1) one- and two-sided matching processes, (2) dynamic and static pricing, and (3) platform transaction fee structure. Specifically, the B2B relationships research in
which our conceptualization is anchored has suggested the importance of incorporating these attributes in a study of interfirm systems such as B2B platforms. To elaborate, transaction cost (Williamson 1996), agency theory (Alchian and Demsetz 1972), and marketing (e.g., Heide 1994) lit-erature streams have described three generic exchange con-ditions—performance ambiguity, market uncertainty, and switching costs—that are expected to influence a firm’s customer management efforts. We posit that these three conditions are manifested as one- and two-sided matching, dynamic and static pricing, and transaction fee structures, respectively, on platforms.
One- and two-sided matching processes as performance ambiguity. Performance ambiguity refers to a firm’s inabil-ity to gauge the qualinabil-ity of an exchange partner’s abilities, motivations, and offerings (Geyskens, Steenkamp, and Kumar 2006; Ouchi 1980). In our context of B2B plat-forms, a particular type of performance ambiguity problem exists in the form of one- and two-sided customer matching processes. One-sided matching (e.g., auctions, reverse auc-tions) enables buyers and sellers to negotiate indirectly or anonymously through the platform interface, without revealing their identities to each other. In contrast, two-sided matching (e.g., exchanges) enables buyers and sellers to interact directly and know each other’s identities. Thus, ambiguity is higher for one-sided than for two-sided match-ing processes.5
Dynamic and static price discovery process as market uncertainty. Market uncertainty refers to turbulence in the decision environment, which makes it difficult to predict future states or outcomes of a given exchange (Anderson 1985). We operationalize uncertainty as dynamic and static pricing arrangements. Static pricing involves offerings sold at fixed prices (e.g., catalog aggregation), whereas dynamic pricing involves changing prices (e.g., bidding). Price changes are often a visible form of uncertainty to partici-pants and indeed constitute a key element of any platform’s business model (Haruvy and Jap 2012). Dynamic pricing creates uncertainty about actual prices and participants’ individual outcomes: buyers perceive a greater risk of over-paying, and sellers fear not getting the desired amount for their offerings. The possibility that some participants col-lude to manipulate prices (i.e., shilling; Kauffman and Wood 2005) also cannot be ruled out with dynamic pricing.
Proportion of transaction-driven fees as switching costs. Switching costs refer to the costs incurred to replace a focal product, brand, or exchange partner (Dubé, Hitsch, and Rossi 2010; Monteverde and Teece 1982). Prior research (e.g., Day, Fein, and Ruppersberger 2003) has
4We thank the area editor for suggesting the relevance of
power-dependence theories for our framework.
5Even if one-sidedness were greater for a specific side,
identified a key manifestation of switching costs in a plat-form setting—namely, the proportion of transaction-driven fees (i.e., fees paid on a transaction basis by the participants as a ratio of the total dollar value of each transaction). The magnitude of fixed fees can be a metric for switching costs, but because firms vary in their operations, size, and resources, scaling fixed fees by the total fees offers a com-parable metric of switching costs for firms of distinct sizes in different industries (e.g., Adebanjo 2010). Fees charged by platforms can involve (1) transaction-based fees that vary with the level of activity of the buyer or seller and (2) fixed fees, such as for subscriptions or licenses that buyers and sellers pay for the right to participate on the platform. As the proportion of fixed component increases, partici-pants face progressively greater switching costs because if they changed platforms, they would sacrifice the subscrip-tion fee. In contrast, as the proporsubscrip-tion of transacsubscrip-tion-based fees increases, participants face lower switching costs (Kambil and Van Heck 2002).
Research Hypotheses
Antecedents of Total Customer Orientation
Buyer (seller) concentration. With increasing buyer concentration, each individual buyer represents a more sub-stantial share of the transactions on the platform, which then becomes progressively more dependent on fewer buyers. As such, the platform is vulnerable to concentrated buyers that are in a position to wrest special concessions from it (Kumar, Heide, and Wathne 1998; Palmatier, Dant, and Grewal 2007). One approach to managing powerful partners is by appeasing them through additional inducements or exchange benefits (Cook et al. 2013). These benefits reduce a focal firm’s relative dependence on a powerful partner because partners that abuse their power stand to lose these benefits if the focal firm terminates the relationship (Emerson 1962). Thus, a platform might manage its dependence on concentrated buyers by increasing its total customer orien-tation (i.e., augmenting the quality of service or the transac-tion experiences available to all platform customers; McIvor and Humphreys 2004). For example, the platform might establish a superior returns system selectively for the powerful buyers (keeping customer orientation constant on the seller side), or it might invest in market-wide infrastruc-ture (e.g., new trading software), which can simultaneously benefit both sides. By cultivating favorable market percep-tions of its customer orientation, the platform not only appeases buyers but also attracts and retains quality sellers, which is a key benefit buyers seek. Therefore, increasing buyer concentration should enhance a platform’s reliance on total customer orientation as a dependence management strategy. (Although a platform’s customer base includes both buyers and sellers, for brevity, we state our hypotheses for the buyer side; parallel predictions apply to seller con-centration, and we test them as well.) Formally, we propose the following:
H1a: As buyer (seller) concentration increases, the platform firm’s total customer orientation increases.
Buyer (seller) concentration with matching processes as performance ambiguity. The matching process should mod-erate the effect of buyer (seller) concentration on total cus-tomer orientation. In other words, buyers benefit from lower levels of ambiguity about sellers in a two-sided matching process (i.e., when the two sides are not anony-mous to each other and can interact and negotiate directly) than they do in a one-sided matching process (i.e., when the two sides are anonymous and cannot interact or negotiate directly). Therefore, we predict that two-sided matching results in more predictable transaction experiences for buy-ers than a one-sided matching process (Haruvy and Jap 2012; Niederle, Roth, and Sonmez 2008). To the degree that buyers value such predictability in transactions (Anderson 1985; Ouchi 1980), even with increasing buyer concentration, buyers are less likely to exploit the platform’s dependence for a two- than for a one-sided matching process. Thus, the platform’s need to engage in dependence management actions—specifically, by cultivating greater total customer orientation in response to increasing buyer concentration (per H1a)—should be lower for two-sided than for one-sided matching processes. We posit the following:
H1b: The positive effect of buyer (seller) concentration on
total customer orientation is smaller for a two-sided matching process than for a one-sided matching process.
Buyer (seller) concentration with price discovery pro-cesses as market uncertainty. A dynamic price discovery process entails greater market uncertainty for buyers than a static process (Choudhury, Hartzel, and Konsynski 1998; Lee 1998), so buyers should be more reluctant to participate in markets with dynamic pricing than in those with static pricing. From the platform’s perspective, such reluctance is more consequential with increasing buyer concentration; specifically, given a platform’s increasing dependence on buyers as buyer concentration increases, the reluctance of these buyers to participate on the platform can severely impede the platform’s performance. Consistent with this reasoning, substantial research (e.g., Buvik and John 2000; Foss and Laursen 2005; Gatignon and Anderson 1988) has shown how uncertainty can exacerbate the deleterious effects of dependence on performance. Thus, as a depen-dence management strategy, a platform should increase its total customer orientation to a greater degree with increas-ing buyer concentration (per H1a) when price discovery is dynamic as opposed to static. Formally,
H1c: The positive effect of buyer (seller) concentration on
total customer orientation is larger for a dynamic versus a static price discovery process.
sig-nificant consequences as the switching costs they face decrease (Bakos 1991; Ganesan et al. 2010). Thus, the joint presence of increasing buyer concentration and decreasing switching costs should increase the platform’s dependence on buyers; in turn, the joint effect of increasing buyer con-centration and decreasing switching costs should be to increase the platform’s reliance on total customer orienta-tion as a dependence management strategy. Formally stated,
H1d: The positive effect of buyer (seller) concentration on total customer orientation increases with the proportion of transaction-driven fees.
Antecedents of Customer Orientation Asymmetry
Buyer (seller) concentration. Platforms invest in cus-tomer orientation toward both buyer and seller sides; how-ever, investments made on each side of the marketplace involve “localized” and “tacit” content (Citrin, Wuyts, and Rindfleisch 2007, p. 9) tailored to each specific side. For example, as a part of its buyer-side orientation efforts, the Ariba platform has built an extensive database of buyer firms, developed best practices to serve buyers, and trained its staff to handle buyers’ complaints; these investments are specialized to the buyer side. At the same time, Ariba’s Sup-plier Membership Program offers functionalities such as contract management, receivables management, and lead generation tools, which are tailored only to the seller side. As this example suggests, platforms make separate cus-tomer orientation investments on buyer and seller sides, and many of these investments are specialized to the side in question. However, it is not apparent whether greater investments should focus on the buyer side or the seller side when buyer concentration increases; we explore this issue of asymmetric orientation next.6
First, as buyer concentration increases, the platform’s dependence on buyers increases as well, which in turn heightens the likelihood that buyers will extract undue con-cessions from the platform. In such situations, increasing customer orientation efforts toward the buyer side could appease buyers, as we argued previously. However, it also creates a risk of unintentionally deepening the platform’s dependence on the buyers even further as a result of the idiosyncratic customer orientation investments toward the buyer side, which locks in the platform with the buyers (Hart and Saunders 1997; Williamson 1996). Empirical evi-dence has suggested that although such investments can produce favorable relationship outcomes (Anderson and Weitz 1992), they could also be exploited, particularly when the partner in question is powerful to begin with (Heide and John 1988; Rokkan, Heide, and Wathne 2003). Thus, as buyer concentration increases, increasing customer
orientation—though beneficial in terms of appeasing the powerful buyers—might not by itself be sufficient for man-aging dependence.
Emerson (1962) suggests that a “fundamental” (p. 35) strategy to manage powerful partners is dependence balanc-ing, which involves the “diffusion of dependency into new relations” (p. 37) by strengthening relationships with other parties in the firm’s network. Bacharach and Lawler (1981) demonstrate experimentally that power-disadvantaged actors are more likely to engage in dependence balancing than appeasement actions toward the powerful partner (see also Lawler and Yoon 1993); Skinner and Guiltinan (1986) also show similar results in a marketing channels context. Bae and Gargiulo (2004) document that instead of appeas-ing powerful alliance partners, telecommunication firms actively invest in third-party ties to gain “indirect leverage” (p. 843) on the powerful partners and are “better off” fol-lowing such dependence-balancing initiatives. Anderson and Coughlan (2002) state that salespeople achieve lever-age over powerful principals by “cultivating strong ties with the principal’s customers” (p. 238), which the authors view as a “key element” (p. 240) of any dependence man-agement strategy.
Following these perspectives, we propose that a plat-form can effectively manage its dependence, even with increasing buyer concentration, by purposely investing more on the seller side than on the buyer side.7 To the degree that the seller-side customer orientation efforts are tailored to sellers, these investments are likely to be viewed by sellers as valuable benefits and credible signals of the platform’s seriousness toward sellers (Anderson and Weitz 1992; Rokkan, Heide, and Wathne 2003). Thus, seller-side customer investments should bond sellers with the platform and limit buyers’ access to these sellers through alternative avenues (Kaplan and Sawhney 2000). In turn, even as buyer concentration increases, to the degree that the buyers desire continued access to the sellers, buyers are less likely to
6Customer orientation asymmetry can be operationalized to
refer to either side, but we focus on asymmetry in favor of sellers, which we compute as seller-side orientation minus buyer-side ori-entation. Customer orientation asymmetry is a continuous variable, so all effects should simply reverse when the operationalization is reversed (i.e., buyer orientation minus seller orientation). Asym-metry and total orientation can increase jointly because the plat-form can increase customer orientation toward both sides while also increasing orientation toward one side more than the other.
7Transaction cost theory (Williamson 1996) likewise holds that
firms that fear exploitation by powerful partners can, instead of further deepening their lock-in, balance dependence by exiting market exchange through vertical integration. Fundamentally, ver-tical integration can be viewed as a type of dependence-balancing initiative whereby a market relationship is replaced with an alter-native relationship—namely, the hierarchy. When vertical integra-tion is infeasible or undesirable, dependence balancing can be accomplished by cultivating alternative market relationships. Thus, Liker and Choi (2004) describe the case of Japanese car-makers that routinely multisource to limit their dependence (lock-in) on a single vendor. Similarly, we contend that a platform that has customized customer orientation investments to the powerful buyer side might be exploited further because it focuses more deeply on the buyers; instead, the platform could strengthen alter-native relationships—namely, the other side of the marketplace.
8Our claim here is that, given a choice, the platform likely
exploit the platform’s dependence.8 Consistent with this argument, Heide and John (1988) show that manufacturer agents balance dependence on powerful suppliers by bond-ing with downstream buyers, and Bensaou and Anderson (1999) discuss the role of buyer-specific investments in counteracting powerful sellers in industrial markets. In a platform context, Manchanda and Chu (2013) state that platforms such as Taobao.com pay more attention to one side of the marketplace with the intent of managing the marketplace effectively (see also Wang and Benaroch 2004). Thus, we propose the following hypothesis:
H2a: As buyer concentration increases, the platform firm’s
customer orientation asymmetry toward sellers relative to buyers also increases.9
Buyer (seller) concentration with matching processes as performance ambiguity. The matching process captures per-formance ambiguity (Ouchi 1980) and should moderate the influence of buyer concentration on customer orientation asymmetry because the dependence-balancing strategy of bonding sellers to the platform can be more effective for one-sided than for two-sided matching processes. Without the direct buyer–seller interactions that are available in a two-sided matching process, sellers experience greater ambiguity about buyer credentials and motivations with one-sided than with two-sided matching (Gebauer and Mahoney 2014; Pavlou and El-Sawy 2002). Therefore, sell-ers should value the platform’s customer orientation efforts more for a one-sided than for a two-sided matching process, and platform customer orientation efforts likely prove more effective at attracting and retaining sellers with one- than with two-sided matching.10 As such, platforms are less likely to engage in asymmetric orientation in favor of
sell-ers for dependence-balancing purposes (in response to increasing buyer concentration, per H2a) with two-sided matching than with one-sided matching. That is,
H2b: The positive effect of buyer concentration on customer
orientation asymmetry toward sellers relative to buyers is weaker when the matching process is two sided versus one sided.
Buyer (seller) concentration with price discovery pro-cesses as market uncertainty. Compared with a static price discovery process, sellers face greater uncertainty in exchange with a dynamic price discovery process (Anand and Aaron 2003; Wang and Benaroch 2004) and, thus, are more likely to suspect opportunistic buyer behavior (Carter and Stevens 2007); this is especially true as buyer concen-tration increases and buyers become progressively more dominant relative to sellers (Jap 2003, 2007). Thus, com-pared with a static price discovery process, sellers should value the platform’s customer orientation efforts more under dynamic price discovery because such efforts signal the platform’s readiness to protect sellers’ interests. The plat-form’s motivation to balance its dependence on concentrated buyers by bonding with sellers through customer orientation asymmetry favoring sellers (per H2a) then should be greater with dynamic than with static price discovery. Formally,
H2c: The positive effect of buyer concentration on customer orientation asymmetry toward sellers relative to buyers is larger when the price discovery process is dynamic as opposed to static.
Buyer (seller) concentration with proportion of transaction-driven fees as switching costs.As the propor-tion of transacpropor-tion-driven fees decreases (and the share of fixed fees increases), switching costs for participants increase. In this scenario, given increasing buyer concentra-tion, the need for the platform to balance its dependence on buyers by cultivating greater customer orientation asymme-try toward sellers (per H2a) decreases because buyers are increasingly locked in with the platform due to their rising switching costs. If such buyers were to exploit the platform’s dependence in the face of increasing switching costs, the platform could retaliate in subsequent interactions and impose consequences (Antia and Frazier 2001; Axelrod 1984). In contrast, as the proportion of transaction-driven fees increase (and the share of fixed fees reduces), switching costs for participants decline; in this situation, given increasing buyer concentration, buyers are increasingly in a position to exploit the platform’s dependence, which in turn heightens the platform’s need for dependence balancing through increased customer orientation efforts toward sellers. Thus,
H2d: The positive effect of buyer concentration on customer
orientation asymmetry toward sellers relative to buyers increases as the proportion of transaction-driven fees increases.
Performance Consequences of Customer Orientation Structure
To explore the performance implications of our theory, we link platform customer orientation to platform performance, or the extent to which the platform meets its financial and 9A clarification is in order: we have argued that as a baseline
scenario, increasing customer orientation investments on any (say, buyer) side should create a bonding effect by signaling the plat-form’s seriousness toward the platplat-form’s customers (H1a).
How-ever, as buyer concentration increases, such idiosyncratic invest-ments might also create a risk of exploitation, so the platform should orient itself asymmetrically toward the seller side to bal-ance its dependence on concentrated buyers (H2a). Increasing
ori-entation toward sellers, to the extent that it bonds quality sellers to the focal platform, is also likely to appease the buyer side, whose key interest in joining a platform is to obtain access to high-quality sellers. Thus, asymmetric orientation toward sellers can appease powerful buyers without raising the risk of exploitation by them. In contrast, given increasing buyer concentration, although buyers may be appeased by asymmetric orientation toward them (which exacerbates the potential for exploitation by locking in the plat-form with them), such an orientation might not facilitate depen-dence management as effectively. Thus, a platform’s specialized customer orientation investments can trigger both exploitation and bonding responses by marketplace participants, contingent on con-centration of the relevant side of the market (e.g., Rokkan, Heide, and Wathne 2003).
10In contrast, we do not expect greater orientation efforts toward
buyers as buyer concentration increases, because these buyers are in a position to exploit the platform’s customer orientation (H2a).
strategic objectives. Specifically, we examine whether plat-form firms that craft their customer orientation structure in a manner consistent with our hypotheses experience supe-rior performance.
With respect to total customer orientation, prior research has argued and empirically documented a positive link between customer orientation and firm performance (Homburg, Muller, and Klarmann 2011; Narver and Slater 1990; Voss and Voss 2000). Consistent with this research, we have contended that a platform’s customer orientation involves various resource investments that are tailored to a specific side of the platform. These customer-oriented efforts offer important transaction utilities to participants (e.g., a superior exchange interface) while also signaling the platform’s supportive intentions toward participants. Thus, a greater total customer orientation of the platform should lower its customer retention costs and enhance the value (e.g., sales, profits) it derives from customers (Gupta and Lehmann 2005; Kumar and Reinartz 2012), leading to enhanced platform firm performance. Thus, we propose the following:
H3: An increase in a platform firm’s total customer orientation
enhances its performance.
In H1a we posit that increasing buyer concentration enhances total customer orientation, in line with the premise that platforms can manage their dependence on powerful buyers by offering incremental transaction effi-ciencies through increased total customer orientation. If, as we have argued, increasing total customer orientation in conjunction with increasing buyer concentration truly facilitates a platform’s ability to manage dependence, the platform should, ceteris paribus, have superior
perfor-mance. Resource dependence theory (Pfeffer and Salancik 1978) suggests that unbalanced (unilateral) dependence makes a firm vulnerable to exploitation (Gilliland, Bello, and Gundlach 2010), whereas balanced (bilateral) depen-dence improves exchange performance (Palmatier, Dant, and Grewal 2007). Kumar, Scheer, and Steenkamp (1995, p. 349) note explicitly that proportionate dependence “dis-courages conflict” and makes the interests of the parties “convergent.” Thus, to the degree that the joint effect of increase in total customer orientation and buyer concentra-tion facilitates dependence management, it should enhance platform performance. We hypothesize the following:
H4: The joint effect of platform total customer orientation
and buyer concentration is to enhance platform firm performance.
If increasing buyer concentration heightens customer orientation asymmetry toward sellers, as we predicted in H2a(drawing on the notion that “bonding” with sellers can permit the platform to balance dependence on the increas-ingly concentrated buyer side), platform firms that are increasingly asymmetrically oriented toward sellers given increased buyer concentration (i.e., customer orientation asymmetry ¥ buyer concentration interaction) should have superior performance because successful dependence bal-ancing is expected to enhance performance. Thus,
H5: The joint effect of platform customer orientation asymme-try toward sellers and buyer concentration is to enhance platform firm performance.
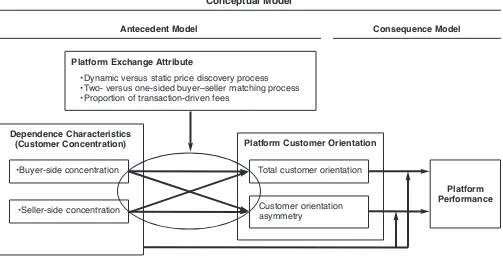
We summarize our hypotheses in Figure 2.
Dependence Characteristics
(Customer Concentration) Platform Customer Orientation
Platform Performance Total customer orientation
Customer orientation asymmetry
FIGURE 2 Conceptual Model
•Buyer-side concentration
•Seller-side concentration
Platform Exchange Attribute
•Dynamic versus static price discovery process •Two- versus one-sided buyer–seller matching process •Proportion of transaction-driven fees
Notes: Nonhypothesized effects and control variables are not shown for clarity but were incorporated in the analyses.
Method
Sample Selection and Data Collection
We gathered data directly from platform firms because our field interviews suggested that marketplace participants were unlikely to be fully aware of a platform’s performance (dependent variable) or customer orientation efforts toward the other side (independent variable). We compiled a list of Internet-based platform firms from a comprehensive directory (dir.yahoo.com) and the online magazine B2Byellowpages. com. The former lists Internet-based platform firms that serve single industries (e.g., www.buzzsaw.com, which serves the construction industry). The latter lists all types of Internet-based platform firms, ranging from auctions to catalog aggregators. We combined information from multi-ple sources because no consolidated calling list of platform firms is available. Our initial sampling frame consisted of 572 Internet-based platform firms that serve B2B markets, including infrastructure providers (e.g., www.bidnet.com) and industry-sponsored marketplaces (e.g., www.virtualchip. com). We visited the websites of all these firms to confirm their existence and address.
We then contacted each firm by telephone to locate will-ing, knowledgeable informants (i.e., members of the execu-tive team who are responsible for key decisions); we made up to three contact attempts for each firm. In 70% of the cases, we spoke directly to chief executive officers or vice presidents, and in another 5%, these executives provided contact details for other suitable firms, creating a snow-balling process. Ultimately, we obtained a feasible sample of 428 platform firms.
We contacted the prospective informants to request their participation and mailed them a questionnaire, a cover letter explaining the purpose our study, and a self-addressed return envelope. We specifically instructed informants to respond with respect to their electronic marketplace. To account for the (unlikely) possibility of clustering if a
plat-form firm owned multiple marketplaces, we requested informants to complete separate questionnaires for each marketplace or, if that was infeasible, to complete one ques-tionnaire with respect to a typical marketplace. As an incen-tive, we promised a summary of the key findings to all respondents. Follow-up survey packets were mailed to non-respondents after three weeks, and the enclosed letter reem-phasized the importance of Internet-based platform firms and the substantive significance of our study. Ultimately, we obtained 114 returns for a 27% response rate, and 109 returns contained usable data. Because our sampling frame came from sources that specifically listed B2B businesses (e.g., B2Byellowpages.com), only B2B platforms are included in our sample; we also cross-checked each response to confirm this.
A comparison of early and late respondents indicated no significant differences for key variables, including various demographic measures such as annual sales, firm age, and number of employees (p> .10). Thus, response bias seems unlikely in our data.
Measures
We adopted established scales for some constructs (e.g., performance) and created new measures for others (e.g., customer orientation components, customer concentration, price discovery process, buyer–seller matching process). For the new constructs, we adapted some established scales with conceptual links to our constructs and developed new items from in-depth (45- to 60-minute) field interviews with four platform executives. To finalize the measurement items, we applied an iterative procedure in which two doc-toral students identified any ambiguous items and two e-commerce consultants evaluated the items for content rele-vance, format suitability, and clarity. We report the descriptive statistics in Table 2 and the measures in the Appendix.
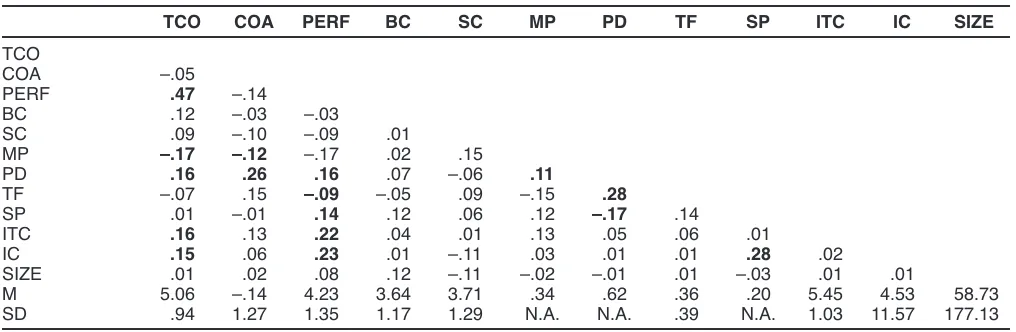
TABLE 2 Descriptive Statistics
TCO COA PERF BC SC MP PD TF SP ITC IC SIZE
TCO
COA –.05
PERF .47 –.14
BC .12 –.03 –.03
SC .09 –.10 –.09 .01
MP –.17 –.12 –.17 .02 .15
PD .16 .26 .16 .07 –.06 .11
TF –.07 .15 –.09 –.05 .09 –.15 .28
SP .01 –.01 .14 .12 .06 .12 –.17 .14
ITC .16 .13 .22 .04 .01 .13 .05 .06 .01
IC .15 .06 .23 .01 –.11 .03 .01 .01 .28 .02
SIZE .01 .02 .08 .12 –.11 –.02 –.01 .01 –.03 .01 .01
M 5.06 –.14 4.23 3.64 3.71 .34 .62 .36 .20 5.45 4.53 58.73 SD .94 1.27 1.35 1.17 1.29 N.A. N.A. .39 N.A. 1.03 11.57 177.13
Total customer orientation. We obtained separate mea-sures for the platform firm’s orientations toward buyers and sellers. For orientation toward buyers, we adapted measures from Narver and Slater (1990). Specific items included the extent to which the platform crafted its business objectives on the basis of buyer satisfaction, monitored its commit-ment to buyer needs, measured buyer satisfaction, and developed its strategy with an understanding of buyer needs. A similar scale measured orientation toward sellers. We then collated all the measurement items for buyer and seller orientation and averaged them to obtain a total cus-tomer orientation measure.
Customer orientation asymmetry. We subtracted buyer orientation from seller orientation to arrive at the measure of customer orientation asymmetry toward sellers relative to buyers. Prior research in the interfirm domain in which our work is anchored has used similar operationalizations for various customer-facing constructs (e.g., Kumar, Scheer, and Steenkamp 1995). An increase in the value of this measure would suggest an increase in the platform firm’s orientation toward sellers relative to buyers; a decrease implies an increase in its orientation toward buy-ers relative to sellbuy-ers.
Platform performance. In line with extant research (e.g., Fang, Palmatier, and Grewal 2011), we employed multiple items to measure the financial and strategic performance of the B2B electronic marketplace. These items include return on investments, sales, profits, growth, and market share.
Customer concentration. We used parallel measures for buyer and seller concentration, in accordance with our defi-nition of customer concentration and similar notions in prior research. For example, Morgan, Anderson, and Mittal (2005) conceptualize customer concentration as the frag-mentation of a firm’s business among customers and cus-tomer power, and Zeitz, Mittal, and McAuley (1999) use customer concentration to imply powerful and dominant customers. For buyer-side concentration, we used items that reflected the extent to which (1) fragmentation existed among buyers in the electronic marketplace (reverse coded), (2) buyers wielded power in the marketplace, (3) many buyers competed for seller contracts (reverse coded), and (4) a few buyers dominated the marketplace.
Buyer–seller matching process. Following extant theory (e.g., Gallaugher and Ramanathan 2002), we used a cate-gorical measure for the matching process, coded as 1 if the electronic marketplace was an exchange and 0 otherwise. An exchange is the only form of marketplace that enables buyers and sellers to communicate and negotiate directly (Kambil and Van Heck 2002). Therefore, a value of 1 indi-cated a two-sided matching process, and 0 indiindi-cated a one-sided process.
Price discovery process. We coded the measure for price discovery process as 1 when transactions in the marketplace took place through a bidding process (e.g., auctions, reverse auctions), which entails evolving prices, and 0 for all other processes (e.g., catalog aggregators, work flow market-places), for which prices are predetermined (Pavlou and
El-Sawy 2002). Thus, a value of 1 indicated a dynamic price discovery process, and 0 indicated a static process.
Proportion of transaction-driven fees. We used the per-centage of marketplace revenues that, according to the plat-form firms, came from individual, pay-per-use customer transactions (Sculley and Woods 2001) as a measure of the proportion of transaction-driven fees. On average, 36% of marketplace revenues were derived from transaction-based fees, and the rest came from fixed prepayments (e.g., sub-scription and license fees).
Control variables. We controlled for whether the plat-form firm self-participated in the electronic marketplace as a buyer or seller, which could bias its orientation toward its own side of the market. We also controlled for the informa-tion technology (IT) capabilities of the platform firm, which can influence customer orientation behaviors and perfor-mance. To measure IT capabilities, we used a second-order construct that captured both IT infrastructure and IT skills. Moreover, we controlled for the complexity of the focal platform’s industry, manifested as variability in the compo-sition and behavior of marketplace participants. Finally, we incorporated the platform’s firm size (log-transformed), which might correlate with our independent (e.g., customer orientation) and dependent (e.g., performance) variables, and whose exclusion could bias our estimated coefficients.
Measure Validation and Common Method Bias
Measure validation. We assessed the validity of our multi-item measures using a confirmatory factor analysis (CFA). The overall CFA model with all latent constructs (platform performance, orientation toward buyers, orienta-tion toward sellers, buyer concentraorienta-tion, seller concentra-tion, industry complexity, IT skills, and IT resources) pro-duced an acceptable fit (c2
194 = 177.72, root mean square error of approximation = .05, confirmatory fit index = .98, nonnormed fit index = .98). All items loaded substantively and were statistically significant (t > 1.96) on their latent factors. All composite scale reliabilities were acceptable (.94 for platform performance, .84 for orientation toward buyers, .82 for orientation toward sellers, .75 for buyer-side concentration, .73 for seller-side concentration, .91 for industry complexity, .94 for IT skills, and .88 for IT infra-structure). Thus, we have evidence of convergent validity. The average variance extracted exceeded the relevant squared correlations, in support of discriminant validity (average variance extracted = .58 for platform performance, .71 for orientation toward buyers, .72 for orientation toward sellers, .50 for buyer-side concentration, .52 for seller-side concentration, .88 for industry complexity, .83 for IT skills, and .82 for IT infrastructure). A second-order CFA for IT capabilities, with the first-order constructs of IT infrastruc-ture and IT skills, also exhibited acceptable model fit (c2
Common method variance. To alleviate common method concerns, we first applied Harman’s single-factor test. We estimated a model involving all our latent con-structs. The scree plot explained 88% of the variance, but no common factor emerged. The unrotated component matrix showed that the scale items did not load on a single construct; the rotated factor-loading matrix indicated that items for different constructs loaded uniquely on different factors.
Second, we used the marker variable technique speci-fied by Lindell and Whitney (2001). The second-lowest observed positive correlation in the correlation matrix is a reasonable proxy of common method variance (CMV); if adjusting for CMV does not substantially alter the observed correlations, CMV is unlikely to be substantial. The second-lowest correlation coefficient in our data was .02, and adjusting observed correlations did not result in any statisti-cally significant difference between the observed and adjusted correlation coefficients.
Third, we employed a general factor covariate tech-nique (Bemmels 1994). After conducting an exploratory factor analysis of all scale items, we noted the factor score for the first unrotated factor, which should serve as a rea-sonable proxy for CMV. We used this factor score as a covariate in our focal regression models (which we describe subsequently). The regression coefficients of interest did not change in direction or statistical significance. Thus, CMV did not seem to be a major issue for our measurement model.
Model and Estimation
To test our conceptual framework, we specified our antecedent model first and then the consequences model. The antecedent model contained two equations to capture the effects of customer concentration, buyer–selling match-ing process, price discovery process, and proportion of transaction-driven fees on total customer orientation (Equa-tion 1) and customer orienta(Equa-tion asymmetry in favor of sell-ers relative to buysell-ers (Equation 2). That is,
(1) TCOf= b0, TCO+ b1, TCOBCf+ b2, TCOSCf+ b3, TCOMPf
+ b4, TCOPDf+ b5, TCOTFf+ b6, TCOBCf¥MPf
+ b7, TCOSCf¥MPf+ b8, TCOBCf¥PDf
+ b9, TCOSCf¥PDf+ b10, TCOBCf¥TFf
+ b11, TCOSCf¥TFf+ b12, TCOBCf¥SCf
+ SJ
j = 1cTCO, jCONTROLTCO, fj+ eTCO, f, and
(2) COAf= b0, COA+ b1, COABCf+ b2, COASCf+ b3, COAMPf
+ b4, COAPDf+ b5, COATFf+ b6, COABCf¥MPf
+ b7, COASCf¥MPf+ b8, COABCf¥PDf
+ b9, COASCf¥PDf+ b10, COABCf¥TFf
+ b11, COASCf¥TFf+ b12, COABCf¥SCf
+ SJ
j = 1cCOA, jCONTROLCOA, fj+eCOA, f,
where f = 1, 2, …, F represents firms, TCOf is total cus-tomer orientation, COAfis customer orientation asymmetry
toward sellers relative to buyers, BCfis buyer-side concen-tration, SCfis seller-side concentration, MPfis the buyer– seller matching process, PDfis the price discovery process, TFf is proportion of transaction-driven fees, CONTROL includes all control variables, b0, TCOand b0, COAare inter-cepts, and eTCO, fand eCOA, fare error terms.
The consequences model included the effects of total customer orientation and customer orientation asymmetry on platform performance:
(3) PFPf= b0, PFP+ b1, PFPTCOf+ b2, PFPCOAf
+ b3, PFPTCOf¥BCf+ b4, PFPTCOf¥SCf
+ b5, PFPCOAf¥BCf+ b6, PFPCOAf¥SCf
+ b7, PFPMPf+ b8, PFPPDf+ b9, PFPTFf
+ SJj = 1cPFP, jCONTROLPFP, fj
+ b10, PFPTCOf¥COAf+ ePFP, f,
where PFPfis platform performance, b0, PFPis the intercept,
ePFP, fis the error term, and all other variables are defined as in Equations 1 and 2. Although we did not offer a specific prediction for the TCO ¥COA interaction, we include this term to investigate the possible interaction effects.
Endogeneity
We constructed our empirical model in two stages. First, we estimated the two antecedent regression equations. Because Equations 1 and 2 have the same predictors, ordinary least square estimates are unbiased and efficient, so we can esti-mate each equation separately and do not need to resort to generalized least squares estimation.
In the second stage, we considered the possibility that the orientation constructs in the consequences model (Equa-tion 3) were endogenous because the decisions about total customer orientation and customer orientation asymmetry might have involved some anticipation of performance out-comes. We employ Garen’s (1988) correction to correct for the potential endogeneity bias in total customer orientation and customer orientation asymmetry in Equation 3. For this correction, we used the estimated residuals from Equations 1 and 2 (i.e., eˆTCO, fand eˆCOA, f) and added them as predic-tors in Equation 3. We also included the products of eˆTCO, f and TCOfand of eˆCOA, fand COAf. This approach is prefer-able for continuous endogenous variprefer-ables because unlike discrete variables (which possess only high and low levels), each level of a continuous variable is influenced by unob-served factors and requires correction.
Accounting for Observed and Unobserved Heterogeneity
each of the three intercepts (b0, TCO, b0, COA, and b0, PFP) to differ across unobserved latent classes. Our semiparametric approach employs a latent class specification with a finite number of support points for the intercept term (Heckman and Singer 1984), so the estimates of the intercepts differ across unobserved latent classes (Chintagunta 2001; Wedel, Kamakura, and Bockenholt 2000). To incorporate multiple latent classes on the intercept term, we used the following generic form to replace Equations 1, 2, and 3:
where yfrepresents the generic form for dependent variable, Xf is the generic form for covariates, b represents the generic form for parameter estimates of covariates, and ef represents the residuals. The intercept, p, which is allowed to vary across latent classes, as noted previously, can take the value of a finite number of discrete (Bernoulli) support points p1, ..., pK; the indicator function I{} is 1 for all f Œk, and 0 otherwise. In our estimation, we allow the number of latent classes k to increase until the information criteria suggest otherwise (Wedel, Kamakura, and Bockenholt 2000).
Results
We mean-centered all predictor variables except buyer– seller matching process and price discovery process, which we operationalized as dummy variables. We estimated
∑
{ }= π ∈ + + ε
=
(4) yf kI f k X bf f,
k 1 K
regression Equations 1–3 using a latent class regression method. Only the intercepts were allowed to vary by latent class; all the other parameter estimates were independent of latent class (i.e., did not vary by latent class). We maxi-mized the log-likelihood function of each equation using 5,000 iterations of the expectation-maximization algorithm so that it converged to a global maximum independent of the starting values (Muthén and Muthén 2007). Our mea-sure of model fit, the modified Akaike information criterion (MAIC), suggested that the four-class solution for the inter-cept was optimal because the MAIC reduced up to four classes (regimes) and increased thereafter (Equation 1: MAIC1 regime = 501.82, MAIC2 regime = 344.98, MAIC3
regime = 353.54, MAIC4 regime = 153.54, MAIC5 regime = 164.09; Equation 2: MAIC1 regime= 128.46, MAIC2 regime= 139.21, MAIC3 regime = 93.17, MAIC4 regime = 85.73, MAIC5 regime= 91.06; Equation 3: MAIC1 regime= 1,386.37, MAIC2 regime= 1,387.09, MAIC3 regime= 1,324.22, MAIC4
regime= 1,302.54, MAIC5 regime= 1,302.86). The entropy of separation of the four-class solution for each equation exceeded .85, indicating a good separation of the latent classes (Celeux and Soromenho 1996). We provide the results for the antecedent hypotheses (H1a–H2d) in Table 3 and those for the consequences hypotheses (H3–H5) in Table 4.
First-Stage Antecedent Model
H1a suggests that buyer and seller concentration are key antecedents to a platform’s total customer orientation. As shown in Table 3, this prediction is supported: the slopes of
TABLE 3
Latent Class Regression Results for Antecedent Model
Total Customer Customer Orientation Hypothesis Orientation Hypothesis Asymmetrya
Two- versus one-sidedness of matching process (MP) .18 (.31) .01 (.47) Dynamic versus static price discovery process (PD) .99** (.31) .21 (.48) Proportion of transaction-driven fee (TF) .01** (.002) .01* (.004) Buyer concentration (BC) H1a .15** (.06) H2a .21** (.09)
BC ¥MP H1b –.06** (.02) H2b –.19** (.08)
BC ¥PD H1c .24** (.06) H2c .20** (.08)
BC ¥TF H1d .001 (.005) H2d –.004 (.008)
Seller concentration (SC) H1a .12** (.05) H2a –.10 (.08)
SC ¥MP H1b –.10** (.04) H2b –.12** (.04)
SC ¥PD H1c .11** (.02) H2c .07* (.04)
SC ¥TF H1d –.005 (.04) H2d –.001 (.001)
Platform firm self-participation .22 (.45) .18 (.41) Platform firm’s IT capabilities .67** (.04) –.01 (.02) Industry complexity 1.39** (.21) .66** (.12) Firm size .29** (.03) –.02** (.004) BC ¥SC .05 (.08) .001 (.35) R-square .97 .89
*p< .05. **p< .01.
aRepresents customer orientation asymmetry in favor of sellers relative to buyers.