INVENTORY MODEL WITH PRICE AND
QUALITY DEPENDING ON DEMAND
Dame Meldaria Sipahutar and Tulus
Abstract. This paper analyzes the problem of inventory in which the
produc-tion system produces perfect and defective goods. In this model it is assumed that only fraction defective can be repaired. The model jointly determine the quality products and prices that maximize the average net revenue (ANR) per unit time. Model generally developed to describe the model and some case presented.
1. INTRODUCTION
In a business every company aims to obtain maximum benefit. To realize the aims, the company is required to produce goods that have the quality and price to suit the needs of consumers.
The quality of goods is a very important factor to attract consumers, because consumer stend to buy goods with high quality. In general, quality is directly proportional to the price. High quality requires a high production cost, causing the price to be high. However, high prices could lead to a decrease in the level of consumer demand for goods. Thus challenging task for the production manager is to produce goods in quality and price in accordance with the needs of consumers.
Received 12-11-2014, Accepted 15-12-2014. 2010 Mathematics Subject Classification: 90B05
Key words and Phrases: Inventory model, Price and quality, Rate demand .
In general, pricing is based on quality goods. Measure of quality is very important in the production system. But until now there is no well-defined method for measuring quality, even characteristics of the goods vary from one another. In some production systems are not perfect all the goods produced. On some systems factory produced goods is a good mix of items and damaged goods. This situation can be found in industries that produce large quantities of goods. Salameh and Jaber [1] developed a model of Economic Order Quantity (EOQ), where the goods are produced are not perfect. Salameh and Jaber assume imperfect goods to be sold in a set in the screening process. Chiu [2] developed a model inventory levels are limited by the assumption that some of the damaged goods can be reworked and the rest will be discarded.
Datta [3] developed a model inventory adjusted to the level of produc-tion and the selling price-sensitive demand. The article assumes that the goods produced are not perfect. This model jointly determine the optimal level of production, future production and the selling price. Some researchers realized the importance of quality goods and quality factors included in the model study of the few researchers who has done none of that explains the shared determination on the best selling price, quality and quantity of goods under quality goods depends the rate of production and cost. This model jointly determine the optimal level of production, future production and the selling price.
2. LITERATURE REVIEW
2.1 Assumption and Notation
In general, the increase in the selling price of goods is based on quality, so size is very important quality in a production system. Although consumers have a tendency to buy high quality products, but sometimes because of the high prices consumers would consider quality. Usually the demand decreases when the price increase. The production process is not all perfect. A small portion of damaged goods produced can be improved to create a perfect rest, which can not be repaired will be discarded.
Production levels are usually dependent on the quality. The level of production P(r) is a function of a decrease in r. Production levels will decrease when produced good quality. Assumptions are given as follows:
P(r) =P1+
P2
Prices of goods Cu(r) will increase and depends on the quality of goods produced. The linear form taken for goods Cur = a+br, where a and b are two positive constants. Where this statement can be denoted by this equation.
a+br1 6Cu6a+b
.
Carrying costs areCh(r) the price per unit of time. The costs of storage this will improve the quality ofr and given the general form
Ch(r) =p+qr2
Wherep and q are positive constants.
The level of demand D(k, r) depends on price increases kand quality r. D(k, r) decreases with k and D(k, r) increases in function of r, but in some situations customers judge quality by price.It states that for a certain k, demand will increase with r. Thus, the condition of this demand must meet this equation
D(k, r) :Dk<0, Dkk <0
This condition must meet the following inequality:
(1−α)P(r)D(k, r)>0 (2)
2.2 Proposed System
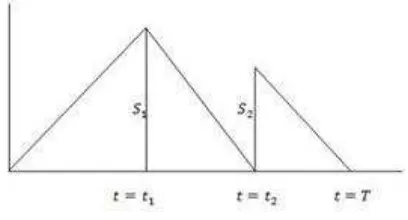
Production will begin after time t = 0. Each item will be checked imme-diately by the automated inspection system after the goods were manu-factured. Defective goods will soon move to there pair. Repair parts will separate the damaged items can be repaired and that can not be repaired. TotalCr is a completion fee charged to each item. Cd is the cost of repairs for each item produced is broken.
Damaged goods that have been fixed will go into inventory as soon as possible when the level ofthe stock is 0. Consumption and production will continue during [0, t1]. Inventory levels at the time t1 is S1. Production
ceased at the time t1. It is only consumed during [t1, t2]. Inventory levels
to 0 at timet=t2. Damaged goods that can be repaired will be brought to
Figure 1: Inventory Model
3. PROBLEM FORMULATION
3.1 Total Production Costs in a Cycle
The costs involved in the proposed system of inventory at Datta [4] is the cost of manufacture, the cost perunit of goods, storage costs, repair costs and settlement costs. The policy is to maximize the average net revenue (ANR) per unit time during the cycle of equipment. Decision variable is the time of production (t1), fare price increases (k), and the level of quality (r).
In a period of inventory, it is difficult to determine the exact value of r to the level of demand. To more easily made the demand in a interval 0 < r1 6 r 6 1. Where r = 1 is showing the best quality, taking into
consideration the quality of the goods produced are defective called alpha. Initial production only starts at time t = 0 and the total amount produced during [0, t1] is
P(r)t1 (3)
By looking equation (3) can be obtained total amount of goods pro-duced perfect
(1−α)P(r)t1 (4)
From equation(4) obtainedS1 inventory level at the timet1 expressed as
Their manufactured goods damaged and can be repaired will be brought to the level of inventory and will become the new inventory at timet=t2.
S2 =αβP(r)t1 (6)
Total number of damaged goods can be obtained from(4) as follows
αP(r))t1 (7)
And the total number of defective goods can not be repaired are
α(1−β)P(r)t1 (8)
The level of demandD(k, r) of goods dependent on bothkis the rate of price increases and quality r. It states that for a givenk, r demand will decline by up to a certain level. This condition must meet the D(k, r) : Dk < 0, Dkk <0 as follows
(1−α)P(r)−D(k, r)>0 (9)
In the presence of (5) and (6) can be obtainedt2 and T, as follows
tn=tn−1 +
(Sn−1) D(k, r)
t2 =t1+
S1
D(k, r)
= t1(1 + (1−α)P(r)−1) D(k, r)
T =t2+ S2
D(k, r) (10)
By looking at the total amount of production (3), then the total cost of production are used in a cycle is
Cu(r)P(r)t1 (11)
From equation (8) obtained total settlement costs
Cdα(1−β)P(r)t1 (12)
See an equation (7) can obtained also the total cost of repairs
CrαβP(r)t1 (13)
In producing a total cost of storage of goods consisting of initial inventory and new inventory, namely:
Ch(r) = (Ch(r)
2 )[S1t2+S2(T−t2)] (14)
Revenues or gross profit obtained in the manufacture of goods are as follows
kCu(r)(1−α+αβ)P(r)t1 (15)
Therefore the values obtained AN R(average net revenue) per unit time of (10) (11) (12) (13) (14) (15) can maximize revenue or net income perunit of time.
gross revenue−setup cost −production cost−repairing cost
−disposal cost−holding cost
obtain the optimal value fort1 andk, then theAN Rderived partially ont1
and k, then equate to 0. AN Rin the equation, ∂AN R t1
Then to obtain optimal value k then the value of AN R lowered to k and then equated 0.
∂AN R
k =Cu(r)D(k, r) (16)
To prove that t1 and kvalues obtained are optimal, then the D(t1, k)<0.
For the AN Rmust be lowered partially twice againstt1 and k.
∂2AN R
For a particular value of r, the values of most economies int∗
1 and k∗ ont1
and kcan be obtained by solving the equations (16) and (17). Sot∗
1 andk∗
In this research producer want to obtain net profit of time. where producers consider the goods damages or disabled α and damage goods it can be repaired isβ. While goods produces perfect is 1−α.
Case 1. When α = 0
This is the optimal amount of production when all kinds of goods produced is perfect. It can be denoted with a basic inventory model with unlimited production rate and without flaws.
Q∗ =P(r)t
This case states that the optimal amount of production when all kinds of manufactured goods repaired damaged.
deter-mine the quality of the goods and prices that will maximize the average net income perunit timeAN R. This model considers the quality is continuous variables were described by the index r, where producers face the problem of choosing the right quality of a limited number of quality options. In this case is a collection of discrete quality.
AN R models are used to solve the problem with a combination of small and in this case it was found that most best AN R or maximum for each quality that may occur and obtained optimum production quantityQ∗
in one cycle.
References
[1] Salameh, M.K. dan Jaber, M.Y. (2000).Economic production quantity model for items with imperfect quality. International Journal of Produc-tion Economics, vol. 64, no. 1, pp. 59-64.
[2] Chiu, Y.P. (2003). Determining the optimal lot size for the finite pro-duction model with random defective rate, the rework process, and back-logging. Engineering Optimization, vol. 35, no. 4, pp. 427-437.
[3] Datta, T.K. (2010).Production rate and selling price determination in an inventory system with partially defective products IST Transactions of Applied MathematicsModeling and Simulation, vol. 1, no. 2, pp. 15-19.
[4] Datta, T.K. (2013). Inventory Model with Price and Quality Depen-dent where Some Item Produced are Defective,Advances in Operations Research, volume 2013, 1–8.
Dame Meldaria Sipahutar : Graduate School of Mathematics, Faculty of
Ma-thematics and Natural Sciences, University of Sumatera Utara, Medan 20155, In-donesia.
E-mail: [email protected]
Tulus: Department of Mathematics, Faculty of Mathematics and Natural Sciences,