Using 3D-Var Data Assimilation for Improving
the
Accuracy
of
Initial
Condition of Weather Research and Forecasting (WRF) Model in Java
Region (Case Study : 23 January 2015)
Novvria Sagita*,1, Rini Hidayati2, Rahmat Hidayat2, Indra Gustari1, and Fatkhuroyan1
1)Indonesian Agency for Meteorology, Climathology, and Geophysics (BMKG) 2)Department of Geophysics and Meteorology, Bogor Agricultural University (IPB)
*)Corresponding author (e-mail: [email protected])
Abstract. :HDWKHU5HVHDUFKDQG)RUHFDVWLQJ:5)LVDQXPHULFDOZHDWKHUSUHGLFWLRQ
PRGHO GHYHORSHG E\ YDULRXV SDUWLHV GXH WR LWV RSHQ VRXUFH EXW WKH :5) KDV WKH GLVDGYDQWDJHRIORZDFFXUDF\LQZHDWKHUSUHGLFWLRQ2QHUHDVRQRIORZDFFXUDF\RIPRGHO LVLQDFFXUDF\LQLWLDOFRQGLWLRQPRGHOWRWKHDFWXDODWPRVSKHULFFRQGLWLRQV7HFKQLTXHV WR LPSURYH WKH LQLWLDO FRQGLWLRQ PRGHO LV WKH REVHUYDWLRQ GDWD DVVLPLODWLRQ ,Q WKLV VWXG\ZHXVHGWKUHHGLPHQVLRQDOYDULDWLRQDO'9DUWRSHUIRUPGDWDDVVLPLODWLRQ RIVRPHREVHUYDWLRQGDWD2EVHUYDWLRQDOGDWDXVHGLQGDWDDVVLPLODWLRQDUHREVHUYDWLRQ GDWDIURPEDVLFVWDWLRQVQRQEDVLFVWDWLRQVUDGLRVRQGHGDWDDQG7KH%LQDU\8QLYHUVDO )RUP IRU WKH 5HSUHVHQWDWLRQ RI PHWHRURORJLFDO GDWD %8)5 data from the National
&HQWHUVIRU(QYLURQPHQWDO3UHGLFWLRQ1&(3DQGDJJUHJDWHREVHUYDWLRQGDWDIURP DOOVWDWLRQV7KHDLPRIWKLVVWXG\FRPSDUHVWKHHIIHFWRIGDWDDVVLPLODWLRQZLWKGLIIHUHQW GDWDREVHUYDWLRQRQ-DQXDU\DW87&IRU-DYDLVODQGUHJLRQ7KHUHVXOWV VKRZHGWKDWFKDQJHVURRWPHDQVTXDUHHUURU506(RIVXUIDFHWHPSHUDWXUHIURP &WR&&GHZSRLQWIURPo &WRo&o&UHODWLYHKXPLGLW\IURP
WRDIWHUWKHGDWDDVVLPLODWLRQ
Keywords::5)LQLWLDOFRQGLWLRQGDWDDVVLPLODWLRQ'9DU
Abstrak. :HDWKHU5HVHDUFKDQG)RUHFDVWLQJ:5)PHUXSDNDQVHEXDKPRGHOSUHGLNVLFXDFD QXPHULN\DQJVHGDQJGLNHPEDQJNDQROHKEHUEDJDLSLKDNNDUHQDEHUVLIDWWHUEXNDRSHQVRXUFH WHWDSL:5)PHPLOLNLNHNXUDQJDQEHUXSDNHDNXUDVLDQSUHGLNVLFXDFD\DQJNXUDQJEDLN6DODK VDWXSHQ\HEDEQ\DDGDODKNHWLGDNVHVXDLQV\DUDWDZDOPRGHOLQLWLDOFRQGLWLRQWHUKDGDSNRQGLVL DWPRVIHU DNWXDO 6DODK VDWX PHWRGH XQWXN PHPSHUEDLNL V\DUDW DZDO PRGHO DGDODK GHQJDQ DVLPLODVL GDWD REVHUYDVL PHQJJXQDNDQ PHWRGH WKUHH GLPHQVLRQDO YDULWLRQDO '9DU 'DWD REVHUYDVL\DQJGLJXQDNDQDGDODKGDWDREVHUYDVLSHUPXNDDQGDULVWDVLXQXWDPDGDWDREVHUYDVL SHUPXNDDQ GDUL VWDVLXQ QRQXWDPD GDWD REVHUYDVL UDVRQ GDWD REVHUYDVL IRUPDW %8)5 GDUL 1DWLRQDO&HQWHUVIRU(QYLURQPHQWDO3UHGLFWLRQ1&(3GDQGDWDJDEXQJDQGDULGDWDREVHUYDVL GDUL VHOXUXK VWDVLXQ 7XMXDQ SHQHOLWLDQ LQL XQWXN PHPEDQGLQJNDQ SHQJDUXK DVLPLODVL GDWD GHQJDQGDWD\DQJEHUEHGDWHUKDGDSV\DUDWDZDOPRGHOSDGDWDQJJDO-DQXDULMDP 87& XQWXN ZLOD\DK SXODX -DZD +DVLO SHQHOLWLDQ PHQXQMXNNDQ SHUXEDKDQ QLODL URRW PHDQ
VTXDUHHUURU506(V\DUDWDZDOPRGHOSDGDHVWLPDVLVXKXGDULo &PHQMDGLNLVDUDQo &
KLQJJDo &WLWLNHPEXQGDULo &PHQMDGLNLVDUDQo &KLQJJDo &GDQNHOHPEDSDQQLVEL
GDULPHQMDGLKLQJJDVHWHODKDVLPLODVL
1. Introduction
One of the problems of NWP system model is the inaccurate of initial conditions models. Initial condition of NWP system is one that is closer to the actual atmospheric
FRQGLWLRQV 2QH WHFKQLTXH LQ IRUPLQJ WKH
initial condition model that approaches the actual data of the atmosphere is by data
DVVLPLODWLRQ'DWDDVVLPLODWLRQLVWKHWHFKQLTXH
for combining observations data with an
1:3 SURGXFW WKH ÀUVW JXHVV RU EDFNJURXQG
forecast) and their respective error statistics to provide an improved estimate (the analysis) of the atmospheric state (Skamarock et al., 2005; Talagrand, 1997).
Indonesia Agency for Meteorology,
&OLPDWRORJ\ DQG *HRSK\VLFV %0.* GLÀQHV
the types of stations into the basic and the non-basic based on the obligation insending the data. The basic station has the obligation to send data to the international and non-basic station only has the obligation of data into a national system (BMKG, 2014). Data coming from the basic station is the one used in building global forecasting models. Utilization of observational data from non-basic station has not been made to establish a system of global NWP models. Data assimilation method is used to incoporate data observations from non-basic station into establishing the system of NWP models. Observation data itself is divided into two types i.e. surface and upper air data. Surface observation data are meteorological parameters up to a height of 10-meters, while the upper air observation data cover parameter up to a height of 10 kilometers (WMO, 2003).
The development of data assimilation method has improved weather prediction models. For instances, assimilation of observation data affects the predictions of planetary boundary layeras (PBL) heights as shown by Stauffer et al. (1991) who studied the effect of direct assimilation surface temperature by four-dimensional method of data assimilation (FDDA) resulting in reduced errors but the surface temperature can trigger high errors on the PBL height for changes that
DUH QRW UHDOLVWLF IRU VXUIDFH EXR\DQF\ ÁX[
Alapaty et al. (2001) used assimilation method to increase the one-dimensional simulation
RI 3%/ 7KH PHWKRG FDQ VLJQLÀFDQWO\ UHGXFH
the error model of PBL height. One method that has been known is the three-dimensional
variational methods of data assimilation (3D-Var), which was introduced by Lorenc
'9DUPHWKRGFDQUHGXFHRYHUHVWLPDWH
precipitation WRF models in Tanzania (Athumani, 2012). Using the method of 3D-Var assimilation from Automatic Weather Station (AWS) data produces little improvement on the prediction of meteorological parameters (Junaedhi, IG et al., 2008; Dash, SK et al., 2013; Hou, T et al., 2013; Sahu, DK et al, 2014). 3D-Var method has a disadvantage that is not sensitive to the uncertainty of the vertical limit (Gao et al, 2004). Development of data assimilation methods produce another method called the four-dimensional variational methods of
GDWD DVVLPLODWLRQ '9DU WKH WHFKQLTXH RI
advanced data assimilation which takes into account the observation data every hour (Yang et al., 2009; Banister, R.N., 2007).
WRF is a numerical weather forecast system designed for atmospheric research to weather forecasting. WRF has been developed by the National Center for Atmospheric Research (NCAR), the National Centers for Environmental Prediction (NCEP), Forecast Systems Laboratory (FSL), Air Force Weather Agency (AFWA), Naval Research Laboratory, University of Oklahoma and the Federation Aviation Administration (FAA) since late 1990 (Skamarock et al., 2005). WRF allows researchers to generate atmospheric simulations based on real data observation. Part of WRF is used for the assimillation of the data referred to WRFDA (WRF Data Assimiation) (Skamarock et al., 2005).
This study will examine the difference impacts of the data assimilation using observation from the basic stations (bas), non-basic stations (non-bas), upper air data (rason), all observation data (all) and observation data from NCEP in the format of BUFR by comparing between the value of root mean
VTXDUH HUURU 506( RI LQLWLDO FRQGLWLRQV
without data assimilation and with data assimilation. This study also analyzes the spatial distribution of bias in the form of the difference of initial conditions between models with data assimilated initial condition and the model without data assimilation (control).
2. Research Method
with a resolution of 0.5o x 0.5o. Observation data is divided into a basic stations data, non-basic stations data, upper air observation data (rason) and observational data from NCEP in BUFR format.
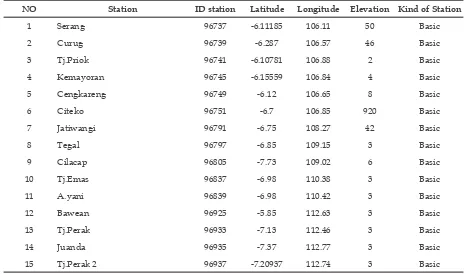
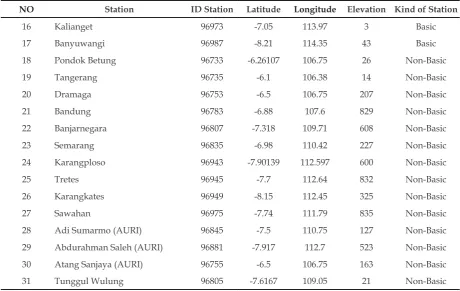
NCEP data consists of a surface observation data, upper air observation data sent to the Global Telecommunication System (GTS), and data from satellites NESDIS (National Environmental Satellite Data and Information Service). This research will only be focused in java island region on January 23, 2015 at 00.00 UTC when. There 17 basic stations and 14 non-basic stations used in this study. Table 1 describes those stations. In addition, the only used rason data in Java is in Juanda meteorological stations.
7KH ZRUNÁRZ RI WKLV VWXG\ FDQ EH VHHQ
in Figure 1. This study uses a background ( ) and background error (B) WRF models.
Background ( ) is the initial conditions of the
model obtained from the simulation results in the WRF-GFS data input. Background error (B) is the statistical error of the model. Background errors are divided into: the global and regional background.
Background global error has been provided by the WRFDA. This study used the data assimilation with the background of global error that has been provided in the application WRFDA. is an observation data used to data assimilation and error value of observation shown by the parameter R.
Figure 1. Flowchart of data assimilation
Table 1.
NO Station ID station Latitude Longitude Elevation Kind of Station
1 Serang 50 Basic
2 Curug Basic
3 Tj.Priok 2 Basic
4 Kemayoran 4 Basic
5 Cengkareng 8 Basic
Citeko 920 Basic
7 Jatiwangi 108.27 42 Basic
8 Tegal 109.15 3 Basic
9 Cilacap -7.73 109.02 Basic
10 Tj.Emas 110.38 3 Basic
11 A.yani 110.42 3 Basic
12 Bawean -5.85 3 Basic
13 Tj.Perak -7.13 3 Basic
14 Juanda -7.37 112.77 3 Basic
NO Station ID Station Latitude Longitude Elevation Kind of Station
Kalianget -7.05 113.97 3 Basic
17 Banyuwangi -8.21 114.35 43 Basic
18 Pondok Betung Non-Basic
19 Tangerang 14 Non-Basic
20 Dramaga 207 Non-Basic
21 Bandung 829 Non-Basic
22 Banjarnegara -7.318 109.71 Non-Basic
23 Semarang 110.42 227 Non-Basic
24 Karangploso -7.90139 112.597 Non-Basic
25 Tretes -7.7 832 Non-Basic
Karangkates -8.15 112.45 325 Non-Basic
27 Sawahan -7.74 111.79 835 Non-Basic
28 Adi Sumarmo (AURI) -7.5 110.75 127 Non-Basic
29 Abdurahman Saleh (AURI) -7.917 112.7 523 Non-Basic
30 Atang Sanjaya (AURI) Non-Basic
31 Tunggul Wulung 109.05 21 Non-Basic
The intial condition ( ), the background
error (B), and observation and the error ( ) were used as input to the application WRFDA to assimilate the data and generate
the new initial conditions ( ) after the model
RIDVVLPLODWLRQ:5)FRQÀJXUDWLRQVHWWLQJVDUH performed in (Table 2) :
Table 2
h. Background error
9 km
Thompson scheme (Thompson, 2004) RUC
%HWWV0LOOHU-DQMLFVFKHPH%HWWVDQG0LOOHU
Global (Barker et al., 2005)
The method used for the data assimilation is varitional three-dimensional analysis (3D-Var). Formula of 3D-Var is (Kalnay, 2003):
J (x) is a function that calculates the cost dissimilarity between models with observational data surface. The calculation of WKHFRVWIXQFWLRQ-[GHVFULEHGLQHTXDWLRQV where x and xb is an analysis of data expected and the data background. H is the observation operator, R is the observation error covariance operator, B is operator background error, y is an observation data and yo is observation data in the model grid.
3. Results and Discussions
7KLVVWXG\DQDO\]HVWKHLQÁXHQFHRIGDWD
assimilation to the initial conditions (initial condition) models with several different observational data source. Analysis of the data
DVVLPLODWLRQLPSDFWVRQWKHLQLWLDOUHTXLUHPHQW
model is an important step for checking the
LQÁXHQFH RI DVVLPLODWLRQ RI GDWD IRU ZHDWKHU
prediction. Analysis of the impact of the initial condition the model is done by comparing the value of RMSE between initial condition without data assimilation against observational data (TA-O) and the initial conditions of models
with data assimilation (bas, non-bas, rason, sma, and BUFR) against observation data (AO).
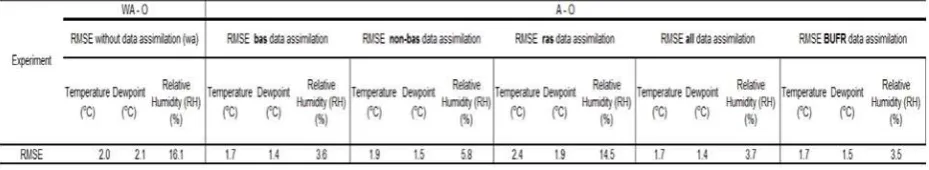
506(YDOXHLVXVHGWRLGHQWLI\LQÁXHQFH
data assimilation. Table 4 shows the changes of
RMSE value for temperature from 2.0 oC (WA)
to 1.7 °C (bass), 1.9 °C (non-bass), 2.4 oC (rason),
1.7 oC (all), and 1.7 °C (BUFR). For dewpoint
temperature RMSE values have changed from 2.1 °C (WA) to 1.4 ° C (bass), 1.5 °C (non-bass), 1.9 oC (rason), 1.4 oC (all), and 1.5 °C (BUFR). The RMSE value for RH have changed from
:$WREDVQRQEDV
% (rason), 3.7 % (all), 3.5 % (BUFR). Almost all condition with data assimilation have RMSE value that are smaller than the initial condition without data assimilation. Data assimilation with rason generate increased RMSE for temperature parameters. This occurs because only one station used in data assimilation. While data assimilation with bass, all and BUFR have the smallest RMSE values for the third parameter (temperature, dewpoint, and relative humidity) weather among other data assimilation.This chapter contains the results of research.
Table 2. E SE , ,
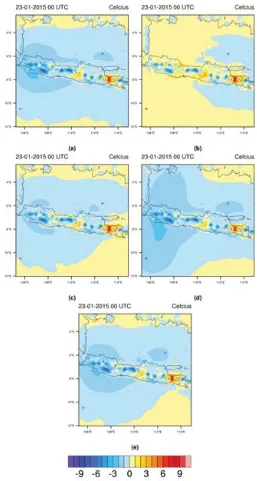
Figure 2 shows the estimation temperature bias at a height of 2 meters of the initial condition of the models with assimilation against initial condition of without assimilation. In general, all experiment of data assimilation resulted positive value of bias value for the eastern part of Java and negative bias for the region of western Java.
On the data assimilation BUFR provides a broad impact on the parameters indicated
distribution bias initial condition of data assimilation models BUFR the initial condition of assimilation model without reaching areas outside Java.
4. Conclusion
7KH LQÁXHQFH RI GDWD DVVLPLODWLRQ
relative humidity). The best data assimilation used for decreasing RMSE value of the initial condition model are the ones that used data from the basic station, surface observation data from all stations, and data BUFR from
1&(3 ,Q WKH VWXG\ DUHD WKH LQÁXHQFHV RI
data assimilation are also spatially visible for the surface temperature estimation which underestimated after data assimilation in the western part of Java and overestimated in the eastern part of Java.
Figure 2.Bias temperature estimation model of assimilation 2m initial conditions (a) bass, (b) rason, (c) non, (d) BUFR, and (e) all against without assimilation (control).
5. References
Alapaty, K., Seaman, NL., Niyogi, DS., Hanna, A.F.(2001)$VVLPLODWLQJ6XUIDFH'DWDWR,PSURYHWKH
$FFXUDF\ RI $WPRVSKHULF %RXQGDU\ /D\HU 6LPXODWLRQV. Journal Of Applied Meteorology.40,
4DVAR in a Quasigeostrophic Model. 0RQWKO\:HDWKHU5HYLHZSS²
Bannister, R.N.,(2007)(OHPHQWDU\'YDU'$5&7HFKQLFDO5HSRUW1R. Data Assimilation Research
Centre, University of Reading, UK
Barker, D., Guo, Y.R., Lin, H.C.(2005)6SHFLÀFDWLRQDQG8VHRI)RUHFDVW(UURU&RYDULDQFHVLQ:5)9DU.
NCAR, Taiwan.
%HWWV$.DQG0LOOHU0-$QHZFRQYHFWLYHDGMXVWPHQWVFKHPH3DUW,,6LQJOHFROXPQWHVWV XVLQJ*$7(ZDYH%20(;$7(;DQG$UFWLF$LUPDVVGDWDVHWV. Q4-50HWHRURO6RF,112,
BMKG, (2014)Regulation of Chief Indonesian Agency for Meteorology, Climatology, and Geophysics (BMKG) No 12. Jakarta
WMO, (2003) Manual on the Global Observing System. World Meteorological Organization (WMO). Geneva.
&KLQ+16*ODVFRH//XQGTXLVW-:KDUWRQ6,PSDFWRI:5)3K\VLFVDQG*ULG5HVROXWLRQ RQ/RZ/HYHO:LQG3UHGLFWLRQ7RZDUGWKH$VVHVPHQWRI&OLPDWH&KDQJH,PSDFWRQ)XWXUH:LQG 3RZHU.
Dash, S.K., Sahu, D.K., Sahu, S.C.(2013),PSDFWRI$:6REVHUYDWLRQLQ:5)'9$5GDWDDVVLPLODWLRQ
V\VWHPDFDVHVWXG\RQDEQRUPDOZDUPLQJFRQGLWLRQLQ2GLVKD1HW+D]DUG
Gao, J.D. et al., (2004) $WKUHHGLPHQVLRQDOYDULDWLRQDOGDWDDQDO\VLVPHWKRGZLWKUHFXUVLYHÀOWHUIRU
'RSSOHUUDGDUV-RXUQDORI$WPRVSKHULFDQG2FHDQLF7HFKQRORJ\SS²
Hou, T., Kong, F., Chen, X. and Lei, H.,(2013),PSDFWRI'9$5GDWDDVVLPLODWLRQRQWKHSUHGLFWLRQRI
KHDY\UDLQIDOORYHU6RXWKHUQ&KLQD.$GYDQFHVLQ0HWHRURORJ\,, 1-17.
Junnaedhi, I.D.G.(2008)3HQJDUXKDVLPLODVLGDWDGHQJDQPHWRGH'9$5WHUKDGDSKDVLOSUHGLNVLFXDFD
QXPHULNGL,QGRQHVLD Tesis Institut Teknologi Bandung. Bandung. 73 hlm.
Kalnay, E.(2003)$WPRVSKHULFPRGHOLQJGDWDDVVLPLODWLRQDQGSUHGLFWDELOLW\. New York. Cambridge
University Press.
Kurniawan, R., et al.(2014)3HQJJXQDDQ6NHPD.RQYHNWLI0RGHO&XDFD:UI%HWWV0LOOHU-DQMLF.DLQ
)ULWVFK'DQ*UHOOG(QVHPEOH6WXGL.DVXV6XUDED\D'DQ-DNDUWD. Jurnal meteorologi dan
JHRÀVLND
/RUHQF$&$QDO\VLVPHWKRGVIRUQXPHULFDOZHDWKHUSUHGLFWLRQ4-50HWHRURO6RF112, 1177–1194.
Rajeevan, M., Kesarkar, A., Thampi, S.B., Rao, T.N., Radhakrishna, B. and Rajasekhar, M.(2010)
6HQVLWLYLW\RI:5)FORXGPLFURSK\VLFVWRVLPXODWLRQVRIDVHYHUHWKXQGHUVWRUPHYHQWRYHU6RXWKHDVW ,QGLD. In$QQDOHVJHRSK\VLFDHDWPRVSKHUHVK\GURVSKHUHVDQGVSDFHVFLHQFHV
Sahu, D.K., Dash, S.K., Bhan, S.C.(2014) ,PSDFWRI6XUIDFHREVHUYDWLRQVRQVLPXODWLRQRIUDLQIDOORYHU
1&5'HOKLXVLQJUHJLRQDOEDFNJURXQGHUURUVWDWLVWLFLQ:5)'9$5PRGHO. Meteorol Atmos Phys.125:17-42.
Skamarock, W.C., Klemp, J.B., Dudhia, J., Gill, D.O., Barker, D.M., Wang, W. and Powers,
J.G.(2005) $ GHVFULSWLRQ RI WKH DGYDQFHG UHVHDUFK :5) YHUVLRQ 1R 1&$571
STR). National Center For Atmospheric Research Boulder Co Mesoscale and Microscale Meteorology Div.
Stauffer, D.R., Seaman, N.L.,and Binkowski, F. S.(1991)8VHRIIRXUGLPHQVLRQDOGDWDDVVLPLODWLRQLQ
DOLPLWHGDUHDPHVRVFDOHPRGHO3DUW,,(IIHFWVRIGDWDDVVLPLODWLRQZLWKLQWKHSODQHWDU\ERXQGDU\ OD\HU.Mon. Wea. Rev., 119, 734–754.
Talagrand, O.(1997)$VVLPLODWLRQRIREVHUYDWLRQDQLQWURGXFWLRQ. J. Met.Soc. Japan Special Issue 75,
Thompson, G., Rasmussen, R.M. & Manning, K.(2004)([SOLFLW)RUHFDVWVRI:LQWHU3UHFLSLWDWLRQ8VLQJ
DQ,PSURYHG%XON0LFURSK\VLFV6FKHPH3DUW,'HVFULSWLRQDQG6HQVLWLYLW\$QDO\VLV. Monthly Weather Review, 132(2), 519–542.
Yang, S.-C. et al., (2009)&RPSDULVRQRI/RFDO(QVHPEOH7UDQVIRUP.DOPDQ)LOWHU'9$5DQG'9$5