Association of Determinant Factors on Bio-psychosocial
with Quality of Life in Elderly
Roh Hastuti Prasetyaningsih1), Dono Indarto 2), Muhammad Akhyar 3) 1) School of Health Polytechnics Surakarta
2) Faculty of Medicine, Universitas Sebelas Maret
3)Faculty of Teaching and Educational Sciences, Universitas Sebelas Maret
ABSTRACT
Background: Indonesia is developing countries with phenomenon raises a variety of issues that require resolution for elderly. The government guarantees social welfare that includes the quality of life of the elderly, such as quality of life of the elderly is influenced by biological, psychological and social. This study was aimed to determine the determinant factors onbio-psychosocial with quality of life in elderly.
Subjects and Method: This was observational analytic study using control. This was conducted in Laweyan and Banjarsari, Surakarta. A total of 141 subjects were consisted of 47 cases and 94 controlswere selected busing fixed exposure sampling. The independent variable was a chronic disease, the activity daily living (ADL) independence, social interaction, family support, residence, family income, depression and coping mechanism.The dependent variables were quality of life. The data was collected with a questionnaire and analyzed using path analysis.
Results: The result showed that respondents with a good quality of life were in the control group (40.4%). Income is directly related to the quality of life of elderly (b= 0.93; 95% CI <0.01 to 1.86; p= 0.048). The residence was indirectly associated to elderly quality of life with depression, and better residence decreased depression (b= -1.34; 95% CI= -2.08 to -0.61; p<0.001), increasing the quality of life of the elderly (b= -1.01; 95% CI= -1.78 to -0.23; p= 0.010). Family support is not related directly with the quality of life of the elderly through residence and depression. The better family support had the better residence (b= 1.30; 95% CI=-0.35 to 2.26; p= 0.007) depression decreased (b= -1.34; 95% CI= -2.08 to -0.61; p= 0.001) so, improves quality of life elderly (b=-1.01; 95% CI=-1.78 to -0.23; p= 0.010). Depression is directly related to the quality of life of the elderly (b= -1.01; 95% CI= -1.78 to -0.23; p= 0.010).
Conclusion: Depression, education and income has a direct relationship with the quality of life of the elderly. Residence with the quality of life of the elderly has an indirect relationship through the depression. Family support is not related directly with the quality of life of the elderly through the shelter and depression.
Key words: bio-psychosocial, quality of life, elderly, Surakarta
Correspondence:
Roh hastuti Prasetyaningsih.Health Polytechnics, Poltekkes Surakarta, Central Java
INTRODUCTION
Human aging is a natural process which is characterized by progressive degeneration functions in organ systems (Naumova et al., 2013). Long-lived individuals have life stages starting from birth, adulthood, reproduction, old age, and
death. Old age is the end of humans’ life stages (Padila 2013)
countries grow higher than that in the developed countries (UN, 2015). The elder-ly population in Indonesia in 2014 reached 20.24 million people or it was equivalent to 8.03% of the total national population. As of 2020, the elderly population in Indo-nesia is estimated to reach 11.44% or it is about 28.8 millions (Indonesian Ministry of Health, 2013). The highest percentage of the elderly population in Indonesia is found in Yogyakarta, which is 14.04% of the total population; it is followed with Central Java (11.16%), and East Java (11.14%) (BPS Nasional, 2015). According to Surakarta Statistic Bureau, the elderly population in the city in 2014 reached 50,747 (9.95%) of 510,747 total population.
The growing number of elderly people in the population structure becomes one of the indicators of the global and national human development success. Increase in the elderly population escalates life expect-ancy (Indonesian Ministry of Health, 2013).
Indonesia’s life expectancy projection is
slightly higher than the global life expect-ancy. Indonesian population’s life expect -ancy in 2010-2015 was predicted to reach 71.6 years, whereas the average global life expectancy was about 70.5 years (UN, 2015). The life expectancy in Surakarta was the highest in Central Java province, i.e. 2.72 years, and it exceeded the province’s average life expectancy, i.e. 71.71 years (Surakarta Statistic Bureau, 2014).
The aging process occurs because of the interactions among biological, psycho-logical, and social aspects. Biologically, the
elderly people’s health degenerates both
naturally or due to illness. As individuals grow old, their physiological functions decrease due to degenerative process so that many non-infectious diseases occur at old age.
Degenerative problems compromise immune systems so that elderly people are
easily contracted with infectious diseases (Henderson et al., 2006). Chronic diseases that elderly people frequently have include hypertension, diabetes melitus, arthritis, stroke, lung diseases, heart diseases, cancer, and renal conditions ( Dewi, 2015). These health conditions hinder the elderly people to do activites of daily living (ADL) so that they require assistance to maintain their quality of life. Chronic diseases in the elderly people will deteriorate their quality of life, particularly their phyisical health (Stanley and Beare, 2012). Besides impact-individuals take to solve their problems. In order to be adaptable, everybody responds to physiological needs, positive self-con-cept, and maintain self-integrity. The ways that the elderly people take to overcome their grievance are unique; every old people have their own ways (Suparyanto, 2013). Psyhcological conditions of the elderly people, including irritability, crankiness, loneliness, feeling unworthy, anxiety, and depression really need supports from families (Sari, 2013).
family system (Papalia et al., 2009). Changes in roles and jobs cause financial loss which affect daily needs fulfillment. The current phenomenon where employ-ment opportunities are decreasing mini-mizes income so that the elderly people live under the poverty line. Soaring prices of land and properties force families to live in small houses; children are no longer able to accomodate the elderly people so that they do not have a place to reside. The govern-ment assists the elderly people who are in great need and not having a place to stay by sending them to nursing homes which have been built by following the standard of decent quality of life.
The dependency ratio in Surakarta is 41%; it means that every 100 families of people at productive age support 41 non-labour force families. The city’s old-age dependency ratio is 10% because 16.46% of its population is retirees (Surakarta Statis-tic Bureau, 2014).
The elderly population in the developing countries, such as Indonesia nneds to be considered in the implemen-tation of the aging population empower-ment so that the elder people are regarded as resources. The government’s concern to the elderly people in Indonesia is extremely insuffcient to develop a system that ensures social welfare which covers the elderly people’s quality of life. With good quality of life, the elderly people are expected to stay healthy, productice and indepedent so that they do not burden families and the
govern-ment, and they still become the nation’s
empowered assets (National Comission of Old-Age, 2010).
This study aimed to anaylize the correlation of determinant factors on bio-psychosocial and quality of life of the elderly people in Surakarta.
SUBJECTS AND METHOD This study was an observational analysis with case control approach. This study was conducted in Laweyan and Banjarsari sub district, Surakarta, Central Java, from November 18 to December 7, 2016. A sample of 141 elderly was selected by fixed exposure sampling. The ratio between the case group and control group was 1:2. The case group consisted of 47 elderly people who lived in nursing homes and the sibjects of the control group were 94 elderly people who lived at home. Data were collected using questionnaires and they were analyzed using paths analysis through Stata 13 program.
RESULTS
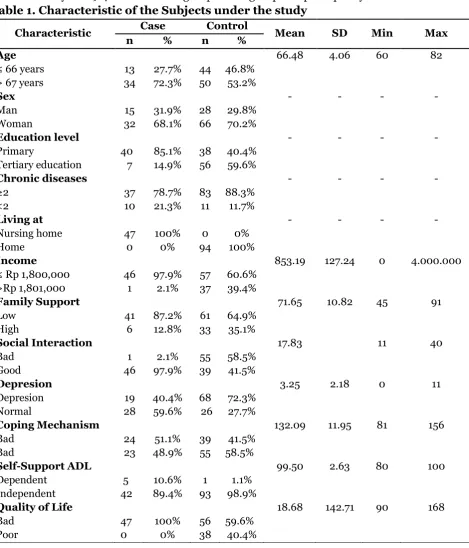
1. The study subject characteristics Table 1 showed that the number of the subjects the study whose age was ≥67 years old in the case group was larger (72.3%) than those in the control group (53.2%). As for sex variable, women outnumbered men, and the number of the female subjects was higher (70.2%) in the control group than that in the case group (68.1%)
The majority of the subjects under the study completed primary education, whereas most subjects in the control group were highly educated. The subjects both in the case group (78.7%) and the control group (88.3%) had two chronic diseases. Income of the subjects in the case group (97.9%) and those in the control group (60.6%) was ≤Rp1,800,000.
The case group (51.1%) had bad coping mechanism and some of the control group (58.5%) had good coping mecha-nism. As many as 89.4% of the case group
and 98.9% of the control group showed ADL independence. As many as 100% of the case group and 59.6% of the control group had poor quality of life.
Table 1. Characteristic of the Subjects under the study
Characteristic Case Control Mean SD Min Max
n % n %
Age 66.48 4.06 60 82
≤ 66 years 13 27.7% 44 46.8% > 67 years 34 72.3% 50 53.2%
Sex - - - -
Man 15 31.9% 28 29.8%
Woman 32 68.1% 66 70.2%
Education level - - - -
Primary 40 85.1% 38 40.4%
Tertiary education 7 14.9% 56 59.6%
Chronic diseases - - - -
≥2 37 78.7% 83 88.3%
<2 10 21.3% 11 11.7%
Living at - - - -
Nursing home 47 100% 0 0%
Home 0 0% 94 100%
Income 853.19 127.24 0 4.000.000
≤ Rp 1,800,000 46 97.9% 57 60.6% >Rp 1,801,000 1 2.1% 37 39.4%
Family Support 71.65 10.82 45 91
Low 41 87.2% 61 64.9%
High 6 12.8% 33 35.1%
Social Interaction 17.83 11 40
Bad 1 2.1% 55 58.5%
Good 46 97.9% 39 41.5%
Depresion 3.25 2.18 0 11
Depresion 19 40.4% 68 72.3%
Normal 28 59.6% 26 27.7%
Coping Mechanism 132.09 11.95 81 156
Bad 24 51.1% 39 41.5%
Bad 23 48.9% 55 58.5%
Self-Support ADL 99.50 2.63 80 100
Dependent 5 10.6% 1 1.1%
Independent 42 89.4% 93 98.9%
Quality of Life 18.68 142.71 90 168
Bad 47 100% 56 59.6%
Poor 0 0% 38 40.4%
2.Bivariate Analysis
Variables in this study were chronic diseases, independence in ADL, income,
Tabel 2. Bivariat Analysis
Independent Variables r p
Chronic diseases -0.05 0.521
Independence in ADL 0.20 0.018
Income -0.05 0.001
Place for living 0.52 < 0.001
Social Interaction -0.42 < 0.001
Family support 0.35 < 0.001
Coping machanism 0.04 0.628
Depression -0.36 < 0.001
3.Path Analysis
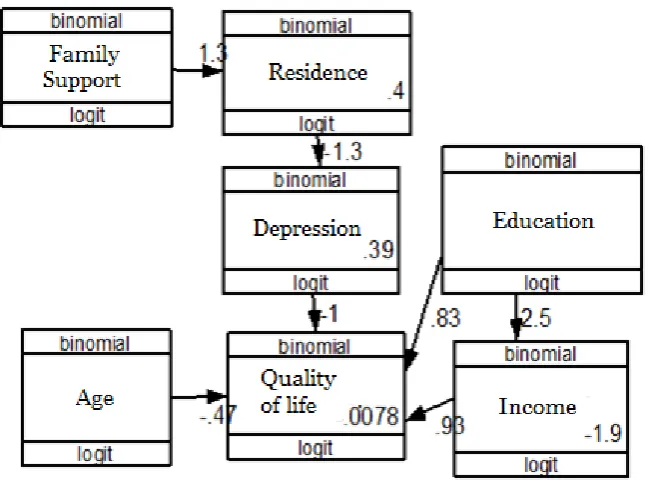
The result showed that respondents with a good quality of life were in the control group (40.4%). Income is directly related to the quality of life of elderly (b= 0.93; 95% CI <0.01 to 1.86; p= 0.048). The residence was indirectly associated to elderly quality of life with depression, and better residence decreased depression (b= 1.34; 95% CI= -2.08 to -0.61; p<0.001), increasing the quality of life of the elderly (b= -1.01; 95% CI= -1.78 to -0.23; = 0.010).
Family support is not related directly with the quality of life of the elderly through residence and depression. The better family support had the better residence (b= 1.30; 95% CI= -0.35 to 2.26; p= 0.007) depression decreased (b= -1.34; 95% CI= -2.08 to -0.61; p= 0.001) so, im-proves quality of life elderly (b= -1.01; 95% CI= -1.78 to -0.23; p= 0.010). Depression is directly related to the quality of life of the elderly (b= -1.01; 95% CI= -1.78 to -0.23; p= 0.010).
Table 3. Path Analysis Results
Independent
Variables Dependent variables b
95% CI
p Lower
limit
Upper limit Direct effect
Quality of life Depression -1.01 -1.78 -0.23 0.010
Quality of life Education level 0.82 -0.01 1.66 0.053
Quality of life Age -0.47 -1.28 0.33 0.249
Quality of life Income 0.93 0.01 1.86 0.048
Indirect effect
Income Education 2.47 1.63 3.30 <0.001
Depression Residence -1.34 -2.08 2.16 <0.001
Residence Family support 1.30 0.35 2.26 0.007
Log Likelihood= -326.52 2.47
AIC= 675.04 -1.34
BIC= 707.48
DISCUSSION
1. Correlation between the income and the quality of life
The path analysis results showed direct correlation between the elderly people’s income and quality of life. This positive and significant relationship between income and quality of life means that the increase of income is followed by the quality of life improvement. Income is the amount of money that individuals earn every month. The income is an indicator of prosperity that individuals have achieved so that it becomes a dominant factor that influences
the people’s decisions to meet their needs.
According to Azis et al., (2010), about 70% of the people who work in informal sector do not have regular income which is expected to be able to fulfill their needs. This is associated with the low education. The low education results in the low income. The low wages cause poverty that creates situations in which the health and housing quality is low; ultimately, they result in low quality of life.
Based on the study by Kosim et al., (2015), the income has tangible effects to the quality of life. An increase t0 the income affects the needs fulfillment, and it ultimately impacts the quality of life.
Farzianpour (2012) emphasizes that education and income are the most important factors of the quality of life. Therefore, it is concluded that there is a direct correlation between the elderly people’s income and quality of life.
2. Correlation between the place for living and the quality of life of the elderly people
This stuy analysis indicated indirect correlation between the place for living and the elderly people’s quality of life through depression. It means that the better a place for living is, the depression level is lower,
and the elderly people’s quality of life is increasing. This finding is similar to the study by Rohmah et al (2012) which states that the quality of life of the senior citizens who live in a nursing home is lower than those living at home.
problems; the physical problem includes chronic diseases, and the psychological issues include stress, depression, loneli-ness, and suicide attempt. These incidences affect the elderly’s quality of life.
A study by Rohmah et al.,(2012) explains that the majority of the senior citizens living in nursing homes are depressed because they lack of activities. Depression at old age brings serious impacts to the social and physical life which impair the elderly people’s quality of life mation availability, transportation, and access to hgealth services. The situation is different for the elderly people who live in the nursing homes; they have limited access to the various factors that are able to improve their environment quality, in the aspect of information, transportation, and the creation of clean and healthy environ-ment (Setyoadi and Erna,2010).
According to a study by Kosim et al., (2015) place for living condition have tangible effects to quality of life. A good place for living influences the quality of life significantly. The study findings show that a house with good ventilation, clean drink-ing water source indirectly creates comfort-able and healthy situation, which eventually bring implications to the quality of life.
Based on this study, it can be concluded that place for living has direct and indirect correlation with the elderly people’s quality of life. In other words, this study is in line with the aforementioned studies.
3. Correlation between the family support and the elderly people’s quality of life
The analysis found indirect correlation between the family support and the elderly people’s quality of life through place for living and depression. The better a family support is, the place for living is also better, the depression level decreases, and the elderly people’s quality of life increases. Studies by Yuliati et al., (2015) and Soosova (2016) show that high family support improves the elderly people’s quality of life. Family support is a support that family provides for the elderly people; it is truly needed by the elderly people in their rest of life so that they feel being noticed and appreciated. Similarly, Maryam (2008), states that family is the main support system for the elderly people to maintain their health.
The quality of life is affected by social aspect and environment closely relates to the environment where the elderly live. The elderly people, in general, live with family, but not few of them live in nursing homes. Nursing home is one of places that accomo-date or care for the elderly people. Nursing
home is one of the government’s assistance
to old citizens. In many countries, sending the elderly people to nursing homes is a life-style, but as families with eastern culture who still have strong traditions and culture, we are obliged to maintain, keep, and take-care of our parents. The best place for the elderly people to spend their old age is close to the family. Nurshing homes should become the last option when the elderly people are not able to take care of themselves (Putri et al., 2014).
4.Correlation between the depress-ion and quality of life
The analysis showed direct correlation between the depression and the quality of life. When the exposure to depression increases, the quality of life decreases.
According to the pyschosocial theory by Erickson in 1968, elderly people are at the stage of integrity on which they have succesfully adjusted with different types of success and failur in their life (Setyoadi and Erna, 2010). Psychological changes that appear among the elderly people include changes in social function, changes in roles following their development tasks, changes in depression level, and changes in emotional stability (Putri et al., 2014).
A study by Kasuma (2015) finds a significant correlation between the depress-ion level and the elderly people’s quality of life. The senior citizens with mild depress-ion have good quality of life, whereas the elderly people with severe depression have poor quality of life. In other words, good quality of life reduces the depression level among the elderly. This is supported by Kathiravellu’s study (2015) that demon-trates meaningful correlation between the depression status and the elderly people’s quality of life. The elderly people who do not suffer from depression are likely to have higher quality of life.
Therefore, it can be concluded depression direcly correlates to the elderly people’s quality of life. This study has limitation on its possibility of information bias. The instruments used were question-naires and some respondents required assistants in filling in them so that the information given depending on the answers from the assistants.
The studied subjects who belonged to the control group were the elderly people
Depreession, education, and income have direct correlation with the elderly people’s quality of life. Place for living has indirect correlation with depression. Family supports have indirect correlation with the elderly people’s quality of life through place for living and depression.
REFERENCE
Azis IJ, Lydia MN, Arianto AP, Budy PR. (2010). Pembangunan berkelanjutan. Jakarta: Kepustakaan Populer Gra-media.
Badan Pusat Statistik Nasional. (2015). Profil statistik kesehatan. Jakarta: Badan Pusat Statistik.
Badan Pusat Statistik Kota Surakarta. (2014). Data Kependudukan. Sura-karta: BPSKota Surakarta.
Dewi SR. (2015). Buku ajar keperawatan gerontik. Yogyakarta: Deepublish. Farzianpour F, Mohammad A, Sayyed MH,
Bakhtiar P, Shadi H. (2012). Evalua-tion of Quality of life the elderly popu-lation covered by healthcare center of marivan and the influencing demo-graphic and background factor. Irani-an Red Cresent Medical Journal. 14(11): 695-696.
Henderson A, Buchwald D, Manson SM (2006). Relationship of Medication Use to Health-Related Quality of Life Among a Group of Older American. J appl gerontol. 20(10): 1-15.
Kemenkes RI (2013).Gambaran Kesehatan Lanjut Usia. Buletin Jendela Data dan Informasi. X(1). Jakarta.
_____ (2013). Penyakit terbanyak pada lansia. Jakarta: Kemenkes RI.
Komisi Nasional Lanjut Usia (2010). Profil penduduklanjut usia2009. Jakarta: Komisi NasionalLanjut Usia.
Kosim N, Nanik I, Siti K (2015). Faktor yang mempengaruhi kualitas hidup penduduk di Desa Sentul Kecamatan Smber Suko Kabupaten Lumajang. Artikel Ilmiah Mahasiswa. Jember: UNEJ.
Maryam RS (2008). Mengenal Usia Lanjut dan Perawatannya. Jakarta: Salemba Medika.
Naumova E, Ivanova M, Pawelec G, Constantinescu I, Boqunia KK, Lange A, Oquz F, Ozdilli K, Franceschi C, Caruso C, Mishra M, Middleton D. (2013). Immunogenetics of aging. International journal immunogenet. 40(1): 77-81.
Padila (2013). Buku ajar keperawatan gerontik. Yogyakarta: Nuha Medika. Papalia, Diane E, Olds SW, Feldman RD,
Gross D (2009). Human Development (Tenth edition). Boston: Mc Graw Hill.
PBB (2015). World Population Ageing 2015. New York: Department ofEconomics and Social Affairs.
Putri ST, Fitriana LA, Ningrum A, Sulastri A (2014). Studi Komparatif: Kualitas
Hidup Lansia yang Tinggal Bersama Keluarga dan Panti. Tesis. Jakarta: Program Studi keperawatan FPOK Universitas Pendidikan Indonesia. Rohmah AI, Purwaningsih, Bariyah K
(2012). Kualitas Hidup Lanjut Usia. Jurnal keperawatan. 120-132.
Sari KN (2013). Status gizi, penyakit kronis, dan konsumsi obat terhadap kualitas hidup dimensi kesehatan fisik lansia. Semarang: Universitas Diponegoro. Setyoadi N, Ermawati (2010). Perbedaan
Tingkat Kualitas Hidup pada Lansia Wanita di Komunitas dan Panti. Diakses melalui http://ejournal.umm. ac.id/index.php/keperawatan/article/ viewFile/621/641_umm_sciencetific_ journal.pdf pada 2 Desember 2016. Suardiman, Partini S (2011). Psikologi
Lan-jut Usia. Yogyakarta: Gadjah Mada University Press.
Suparyanto (2013). Sekilas tentang meka-nisme koping. http://drsuparyanto.-blogspot.co.id/2013/04/sekilastentan g-mekanisme-koping.html. Diakses 19 september 2016.
Yulianti RD (2014). Hubungan dukungan keluarga dengan kualitas hidup lansia di Desa Pogungrejo Purworejo. Tesis. Yogyakarta: STIKES Aisyiyah.