sustainaBility oF sustainaBle PalM oil:
a MarKet integration analysis
Diana chalil
*)1*) Fakultas Pertanian, Universitas Sumatera Utara Jl. Prof. A.Sofyan No.3, Kampus USU, Medan 20155
aBstract
Crude Palm Oil (CPO) is the biggest consumed vegetable oil in the world. The increase in
CPO production raises concern on the environmental impact even outside the producing
countries. As a response to this matter, the EU has made a requirement to only import certified CPO (CSPO). India and China, the two biggest importers in the world, are less restrictive to the environmental issues, and their demands are more influenced by CPO price levels. These countries are the main export markets for Indonesia and Malaysia, the two biggest CPO exporters in the world. This research using monthly price data from the Netherlands, Germany, Italy, EU28, India, China, Indonesia and Malaysia. Market integrations are tested with Cointegration Test, Vector Error Correction Model and Seemingly Unrelated Regression. The results show that these markets are integrated, but European countries are unlikely to lead the price movement. Therefore, the concern on sustainable certification from the European countries still slowly spreads to other main importers, resulting in low absorption of CSPO.
Keywords: market integration; sustainable palm oil; seemingly unrelated regression; vector
error correction model
aBstraK
Crude Palm Oil (CPO) adalah vegetable oil yang paling banyak dikonsumsi di dunia. Peningkatan produksi CPO menimbulkan kekhawatiran tentang dampaknya terhadap lingkungan. Sebagai respon, Uni Eropa telah membuat persyaratan hanya akan mengimpor CPO bersertifikat (CSPO). India dan China, dua importir terbesar di dunia tidak terlalu memperhatikan isu-isu lingkungan, dimana permintaan CPO mereka lebih dipengaruhi oleh tingkat harga. Negara-negara ini merupakan pasar ekspor utama bagi Indonesia dan Malaysia, dua eksportir CPO terbesar di dunia. Penelitian ini menggunakan data harga bulanan dari Belanda, Jerman, Italia, EU28, India, Cina, Indonesia dan Malaysia. Penelitian ini menguji integrasi pasar dengan menggunakan Uji Kointegrasi, Vector Error Correction Model dan Seemingly Unrelated Regression. Hasil penelitian menunjukkan bahwa pasar ini terintegrasi, tetapi negara-negara Eropa bukan sebagai leader dalam pergerakan harga. Oleh karena itu, perhatian negara-negara Eropa tentang sawit berkelanjutan masih menyebar secara lambat ke negara-negara importir utama lainnya, sehingga penyerapan CSPO masih rendah.
Kata kunci: integrasi pasar, CPO, seemingly unrelated regression, vector Error correction
model
introDuction
CPO is one of the important commodities in the international trade. However, its enormous growth raises fears about the impact on environment quality and sustainability in the long term. CPO is required by a large number of countries, as it becomes raw materials for various products with competitive prices. Addressing this issue, RSPO offers sustainable management through a number of principles and criteria so that these two interests can be balanced. Producers who have fulfilled these principles and criteria will obtain RSPO certification. Since its introduction in 2004, 331 palm oil mills and 64 growers producing 13.18 tons CSPO have been certified. Although not bound, many RSPO consumer members, especially those from European countries have committed to only import CSPO. RSPO certification becomes a demand shock and influences volume imports in European market.
Therefore, although RSPO certification needs extra costs and work, companies with European countries as their main export destination are more likely to obtain the certificates than those with other export market destinations (Anderson SW et al. 1999). European countries demand mostly in palm stearin form which is widely used in food products with RSPO label on their packages. However, palm stearin represents only 20% of the palm oil world import volume (SPOTT, 2016).
A number of big palm oil companies from Indonesia and Malaysia have obtained RSPO certification, a lot of Small companies and Smallholders have not been certified. This could not be ignored because Smallholders’ total palm oil areas are more than 40% of the total palm oil areas (Palm Oil Research, 2015). For most Smallholders the certification costs are high and some of the principles and criteria are still quite complicated (Stanton and Burkink, 2008; Parrish et al. 2005; Hoebink et al. 2014; Nelson et al. 2010). However, the compensation is still unclear and there are no CSPO premium price references. Currently, CSPO price is determined through deals, and from 2011 to 2014 the premium price declined, remaining approximately US $ 1,97 per metric ton and there is a difference between the prices of CSPO and conventional-CPO (RSPO, 2015). This can be a disincentive to produce CSPO, especially for main CPO producers from Indonesia and Malaysia.
European countries are not the main export market destinations for main CPO producers and exporters. In 2015, these countries’ exports and production were accounted for 86% and 91% in the world respectively. Indonesia exports 48,43% of its total production to India, while Malaysia exports 16,41% to China. India is the biggest palm oil importer and consumer in the world with 20,5% and 15% share, respectively, and China is the third importer and fourth consumer with 12,5% and 9,7% share, respectively (USDA, 2015). In India and China, price is still a more important factor than environmental issues. Their consumers are not willing to pay more for cooking oil that use CSPO as its raw material. Physically CSPO and CPO are not different and produce the same quality of end product. Therefore, India and China consumers consider CSPO and CPO as homogeneous product. Higher CSPO price leads to a low demand the India present market. The government, likewise, has little incentive to absorb surplus costs. Currently, India and China tend to enforce less restrictive import requirements. When Indonesia and Malaysia decrease their export tax on processed CPO, Refined Bleached and Deodorized (RBD) olein, India significantly increased their import (Hucal, 2015; Arora et al. 2014; Ningsih, 2016). Indonesia is also recorded as the second largest palm oil consumer, with 13% share of the total world consumption (USDA, 2015). In 2015 Indonesia has also issued a policy to increase the percentage of biofuel palm oil content in Indonesia, from 15% to 20%, which is equivalent to an increase in palm oil consumption by 3-4 million tons/ year. However, Indonesian consumers are also unlikely to pay a higher price for CSPO. Without support from India, China and Indonesia, sustainable palm oil will slowly progress. Since 2009 CSPO uptake has only reached 48,64% of its total production (RSPO, 2015). However, if European markets are integrated with Indian, Chinese or Indonesian markets, demand shocks in one market will be transmitted to other markets.
Section 3 describes the methods. Section 4 analyzes the estimation results, and Section 5 concludes and presents a number of suggestions and policy implications.
Market integration is defined as the relationship between markets, which is indicated by the price transmission from a market to another, either horizontally or vertically, and their price share stable long run price equilibrium. The attainment of such equilibrium can be reached if either trade flows occur between spatially separated of a homogeneous commodity or if information flows. Without transmission of information, differentiated commodity might be treated as homogeneous. For example, without labels, organic commodities could be treated as conventional ones but not vice versa, thus such a substitutability is considered asymmetric (Wurriehausen, 2012). A similar condition occurs in the palm oil market, in which CSPO and CPO are not physically different. CSPO can be grouped into 3, namely segregated, mass balance and book and claim types. Among them, segregated palm oil is the only group that fully separates CSPO and conventional CPO. Therefore, mass balance and book and claim are often sold as conventional CPO.
In integrated markets each market employs information from the other when forcing its own price expectations, either in a uni directional or bi directional causality. A number of studies have been conducted in agricultural commodities in the domestic market (Wani et al. 2015; Carew et al. 2012; Hossain, and Verbeke, 2010; Zhou, ZY et al. 2000; Edet et al. 2014), international market (Rosa et al. 2014; Jones and Kwiecinsk, 2010) or connection of both markets (Fossati et al. 2007). In previous studies, the transmission is determined by their co-movement through the Cointegration Test. The short run price movement can drift apart or adjusts and converge towards an equilibrium, in which speed of adjustment is measured through the Error Correction Model (Rapsomanikis et al. 2006). The direction of causality is measured by Granger Causality and used to determine the leader and follower role of each market (Arshad and Hameed, 2014). However, Granger Causality test is designed to handle pairs of variables and may be misleading when true relationship involves more variables, hence similar Vector Autoregressive (VAR). Model with full information method such as Seemingly Unrelated Regression (SUR) can be used to overcome the problem (Roy et al.1994).
The integration degree could be influenced by stock availability, contracts and government interventions. Stocks and contracts are often used to stabilize the agricultural product prices in future palm oil markets, such as in Malaysia and Rotterdam (Rahman et al. 2012). Rotterdam, which is located in the Netherlands, is an important port for importing palm oil to European countries. Biofuel plants of large companies such as Nestle and Abengoa, as well as vegetable oil refineries from Cargill Refined Oils Europe, Lodgers Croklaan IOI Edible Oils and Wilmar are located in the port of Rotterdam (Port of Rotterdam, 2015). European countries cannot produce CPO, but have other edible oils such as soybean, rapeseed and sunflower as a substitution. However, CPO is still the main imported edible oil to European countries. In 2009–2010, palm oil was recorded to be 60% of the total imported edible oil to European countries and 36% of the palm oil was imported through the Rotterdam port (Ridder et al. 2014; Gerasimchuck and Koh, 2013). Bursa Malaysia Derivative Exchange uses two main ports in Malaysia, namely the port of Klang and Pasir Gudang. Similarly, a number of major companies such as Cargill refinery, Sime Darby, Felda IFFCO International Mewah Group, and Shell are located at these ports.
MethoDs
This study uses monthly CPO price data from 2011 to 2014, which covering 5 importing countries, namely China, India, Germany, The Netherlands, Italy, a group of importing countries EU28, and 2 main exporting countries, Indonesia and Malaysia. There is a lack of complete monthly China price data, therefore this study uses China Hongkong SAR as a proxy. Hongkong price appears to be higher than China, but the movement is similar. This justifies the usage of Hongkong price as the proxy because the focus of this study is to analyze the price co-movement.
The CPO price data of the European countries used in the study were calculated from the data import value and volume of imports. Certified and non-certified palm oil price data are not separated in European countries. However, Germany has committed to use only CSPO from 2014, while the Netherland from 2015 (RSPO, 2015). Certified CPO prices have a greater range than those not certified because they include three types of certification, namely segregation, mass balanced, book and claim. Not all traded physically. Partly through virtual transactions Green Palm, with premium pricing through direct negotiations between buyers and sellers. Therefore, CSPO price could be listed only a conventional CPO price (Ningsih, 2015). In 2009-2014, an average 14,5% of total CPO production was recorded as CSPO physical uptakes, while 30% uptakes were recorded through the Green Palm program (RSPO, 2014).
A number of previous studies suggested relationship among various vegetable oils. However, Arianto et
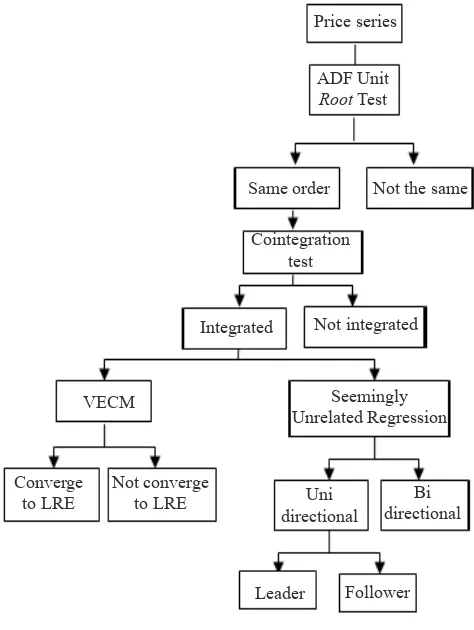
al. (2010) shows that the price of palm oil in the short run was not influenced by other vegetable oil prices, while in the long run was only slightly influenced by soya and rapeseed prices. Therefore, estimating CPO prices without including other vegetable oil prices could be justified. The nominal price is converted to the real value by using CPI from each country. The data were collected from Oil World, The Malaysian Palm Oil Board (MPOB), UN Comtrade, Eurostat, and US Department of Labor and they were analyzed with Cointegration Test, VECM, Granger Causality and SUR with the following estimation steps. Figure 1 shows that the first estimation step is the stationarity Augmented Dickey Fuller test (Dicky and Fuller, 1970) for all series by using the following equation.
Yt is the price series from each country in question, ρ is the test coefficient and m is the lag length chosen from ADF test. The null hypothesis is Yt has a unit root or non-stationer. The aim is to avoid spurious regression, such as series with the same trend that can have a significant coefficient although not related to one another. The test starts by using price series in level data. If the test cannot reject the null hypothesis, the data is considered with null order I(0). Otherwise the test continues with the different data until they reject rejects the null hypothesis to determine the price series order. Price series with different orders show that they are not related one to another, which means there is no market integration between the countries in question. If the series have the same order, then they are further tested with Johansen Cointegration Test (1995) to examine whether the relationship between the series is stationary. The cointegrating equation can be written as:
Figure 1. Estimation steps Price series
ADF Unit Root Test
Same order Not the same
Cointegration test
Integrated Not integrated
VECM
Converge to LRE
Not converge to LRE
Seemingly Unrelated Regression
Uni directional
Bi directional
Zt is a (nx1) vector of jointly determined non stationary I(1) endogenous price series, and ∆Zt=Zt-Zt-1. The
number of cointegrating equation among the price series in Zt is given by the rank of the π matrix. The existence of cointegrating equation shows market integration between the countries in question. The integration is reflected through the short run movement between the series, which could drift apart or adjust towards an equilibrium in the long run (Eagle and Granger, 1987). The significance of the short run dynamic, speed of adjustment and convergence of the long run equilibrium are estimated with the VECM that can be written as:
εit is the residual series such that εit= Yit-1-αi-βiYjt-1, and γi shows the speed of adjustment. Short-run dynamics from the non-stationer series are shown by θ_i, which will be adjusted towards the Long Run Equilibrium if γi<0. The more negative γi the faster the series converge
to the Long Run Equilibrium. With more than a single independent variable, the causality direction and leader follower role are tested with the SUR.
Yit is a vector of the ith Country, Yjt is a matrix of the jth countries, i and εit are a vector of coefficients and residuals of the model. This test was conducted with 2 scenarios, which includes 3 separated European countries, and included EU28 as a group of the European contries. The direction and role of each Country are determined with similar idea in Granger Causality, such as follows.
Yit and Yjt are two price series, each defined with zero mean and unit variances, n is the lag considered, and øi and øj are coefficients of the model. The definition of Granger Causality implies that Yjt causes Yit when øj is significantly different from zero. Likewise Yit causes Yjt when øi is significantly different from zero. If one of the two coefficients is insignificant, then the causal relationship between the two series is a uni-dimensional relationship. Series with the significant coefficient is the leader, otherwise the follower. However, if both coefficients are significant, then the series have a bi-dimensional relationship, while if both are insignificant, there are no relations between them.
results
cPo Price Movement
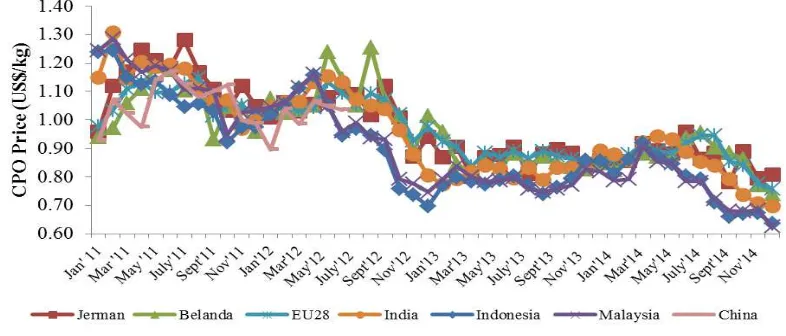
Figure 2 shows a declining price movement in importer and exporter countries in 2011–2014 monthly CPO prices. In general CPO prices in exporting countries are lower than those in the importing countries. Between the exporting countries, the price in Malaysia is higher than that Indonesia. CPO price movements in both exporter countries are similar, with the lowest price around September and highest price in the months of February-March. In addition among importing countries, India appears to be the leader. An increase (decrease) in India price is followed by an increase (decrease) in other importing countries in the following months.
cointegration test and Vector error correction Model
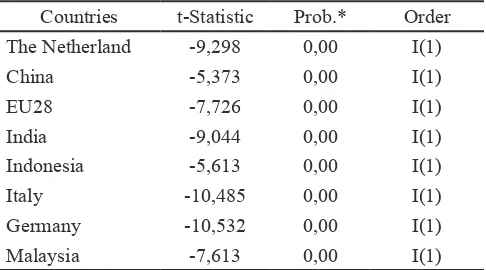
The unit root test results on the price series show that the whole series is stationary in the first difference. Since all the series have the same order I(1), then the analysis can proceed to the cointegration test (Table 1).
Table 1. The unit root test result for various countries price series
Countries t-Statistic Prob.* Order
The Netherland -9,298 0,00 I(1)
China -5,373 0,00 I(1)
EU28 -7,726 0,00 I(1)
India -9,044 0,00 I(1)
Indonesia -5,613 0,00 I(1)
Italy -10,485 0,00 I(1)
Germany -10,532 0,00 I(1)
Malaysia -7,613 0,00 I(1)
*shows the significance at 10%
Trace and Maximum Eigenvalue in the cointegration test results for the importing country group and for the mixed of importing and exporting country group contain cointegration equations (Table 2 and Table 3). The addition of exporting country in each sub group increases the number of cointegrating equations, indicating market integration between Indonesia or Malaysia and other importing countries. Therefore, Indonesia and Malaysia are also included in both the VECM and SUR. The number of cointegrating equations shows that in comparison with China, CPO price in India is likely more integrated with those of other countries. Table 2 and Table 3 also show that none of Group I and Group III that separate the European countries have full integrations. For example, Group I in Table 2 only has 2 cointegrating equations, while the
maximum integration is 3. However, this test is unable to indicate the integrated or unintegrated countries in a group. Unless the group only contain 1 dependent and independent series such as that in Group II and Group IV in Table 2 or full integration in the same groups in Table 3, which shows both India and China price are cointegrated with EU 28. Because of the cointegration, the estimation could be continued to VECM to explore the indicated integrations.
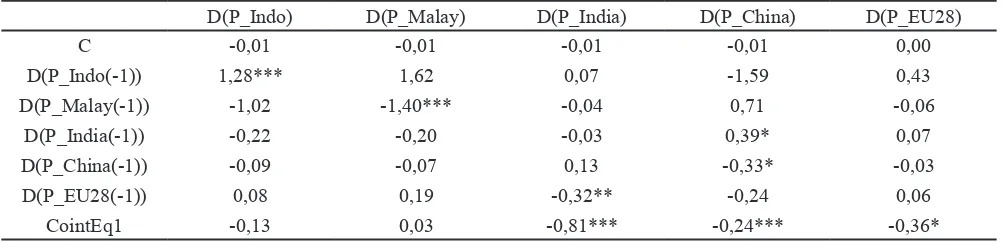
Similar with the cointegration test, the VECM also consists of 2 scenarios that separate the 3 European countries (scenario 1) and join them in EU28 (scenario 2). Table 4 and Table 5 show that in both scenarios, Indonesia and Malaysia CPO prices do not converge to the long run equilibrium (LRE), while those of India, China, and the European countries do. In scenario 1, the speed of adjustment to the equilibrium for these countries varies from less than 2 months to more than a year. The coefficient of price changes in India is –0,83, which means that each month the deviation of the CPO price from the long run equilibrium will be corrected 83%, which means India only needs 1,2 month to fully adjust to the LRE. However, the changes in CPO price in China will only be corrected 7% per month, thus requiring 14 months to reach the equilibrium. Surprisingly, The Netherlands, in which Rotterdam port is located needs 10 months of adjustment, while Germany and Italy only need 3,7 months and 3,2 months, respectively. In scenario 2 the speed of adjustment of China and European countries significantly increase, from 14 months to 4,2 months and from the range in between 3,2 months to 10 months to 2,8 months. This indicates that these markets are integrated, but need time to fully adjust and reach equilibrium. Such a condition might stem from RSPO certification non-tariff barrier or lack of information about the certification.
Table 2. Cointegration test results among importing countries Null
hypothesis
Trace (Vtrace) Max eigenvalue (Xmax)
I II III IV I II III IV
r = 0 78,2* 27,10* 64,04* 21,71* 40,83* 25,00* 37,30* 21,69*
r = 1 37,3* 2,10 26,75 0,02 25,00* 2,10 19,59 0,02
r = 2 12,4 7,16 9,04 6,73
r = 3 3,3 0,43 3,31 0,43
Description:
*, **, and *** show the significance at α = 10%. α = 5% and α = 1%, respectively
r : number of cointegrating equation
I : India = f(The Netherlands, Italy, Germany) II : India = f(EU28)
Table 3. Cointegration test results among importing and exporting countries Null
hypothesis
Trace (Vtrace) Max eigenvalue (Xmax)
I II III IV I II III IV
r = 0 162,98* 98,36* 146,62* 82,54* 65,66* 53,76* 53,36* 43,91*
r = 1 97,33* 44,60* 93,27* 38,63* 47,62* 28,44* 42,79* 21,21*
r = 2 49,71* 16,16* 50,47* 17,42* 27,46 15,92* 27,75* 16,81*
r = 3 22,25 0,24 22,72 0,60 16,56 0,24 16,76 0,60
r = 4 5,69 5,96 5,12 5,02
r = 5 0,57 0,94 0,57 0,94
Description:
*, **, and *** show the significance at α = 10%. α = 5% and α = 1%, respectively
r : number of cointegrating equation
I : Indonesia = f (The Netherlands, China, India, Italy, Germany)
II : Indonesia = f (China, India, EU28)
III : Malaysia = f(The Netherlands, China, India, Italy, Germany)
IV : Malaysia = f(China, India, EU28)
Table 4. VECM results in scenario I
COUNTRIES D
(P_Indo)
D (P_Malay)
D (P_India)
D (P_China)
D (P_The Ntherlands)
D (P_Germany)
D (P_Italy)
C -0,01 -0,01 -0,01 -0,01 0,00 0,00 0,00
D(P_Indo(-1)) 1,43*** 1,76*** -0,40 -1,80** 1,11 0,23 0,90
D(P_Malay(-1)) -1,22*** -1,51*** 0,44* 0,90* -0,31 0,14 -0,17
D(P_India(-1)) -0,19 -0,21 0,00 0,36 -0,06 0,12 -0,39
D(P_China(-1)) -0,14 -0,07 0,17* -0,49** 0,34 -0,31** 0,19
D(P_The Netherlands(-1)) -0,06 0,04 0,11 0,02 -0,18 0,29 0,22
D(P_Germany(-1)) 0,12 0,09 -0,21** 0,08 0,00 -0,32** 0,22
D(P_Italiy(-1)) 0,08 0,10 -0,08 -0,26 0,31 0,00 -0,19
CointEq1 -0,12 0,10 -0,83*** -0,07*** -0,10** -0,27* -0,31*
Description: *, **, and *** show the significance at α = 10%. α = 5% and α = 1%, respectively
Table 5. VECM results in scenario II
D(P_Indo) D(P_Malay) D(P_India) D(P_China) D(P_EU28)
C -0,01 -0,01 -0,01 -0,01 0,00
D(P_Indo(-1)) 1,28*** 1,62 0,07 -1,59 0,43
D(P_Malay(-1)) -1,02 -1,40*** -0,04 0,71 -0,06
D(P_India(-1)) -0,22 -0,20 -0,03 0,39* 0,07
D(P_China(-1)) -0,09 -0,07 0,13 -0,33* -0,03
D(P_EU28(-1)) 0,08 0,19 -0,32** -0,24 0,06
CointEq1 -0,13 0,03 -0,81*** -0,24*** -0,36*
Description: *, **, and *** show the significance at α = 10%. α = 5% and α = 1%, respectively
seemingly unrelated regression
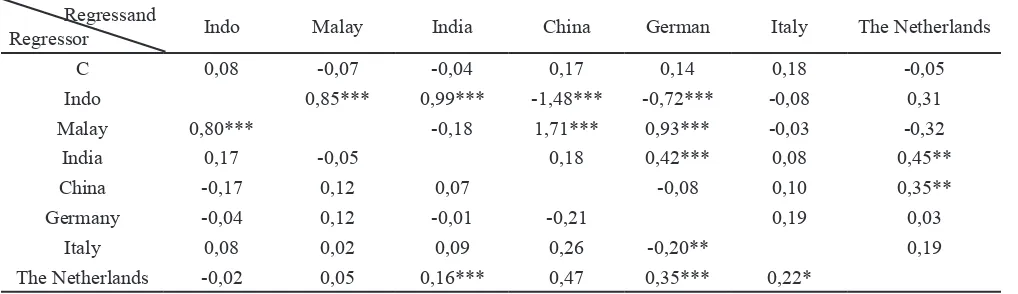
Similar with the cointegration test and VECM, SUR also consists of 2 scenarios that separate the 3 European countries (scenario 1) and join them in EU28 (scenario 2). Table 6 shows that in scenario 1 CPO price in India influence those in Netherland and Germany and vice
prices in India and in China have a bi directional causality with those in EU28. In other words, European countries are unlikely to lead the CPO price of India or China, because individual European markets are much Smaller than those in India or China. Moreover, CSPO trade is also much Smaller than the conventional CPO.
Table 6 and Table 7 show that both Indonesia and Malaysia have a unidirectional causality with China and Germany, in which Indonesia and Malaysia appear as the leader and China or Germany as the follower. As described previously, China imports most of its CPO domestic consumption from Malaysia, and a significant part from Indonesia. Surprisingly, the SUR estimation results show no significant relation neither between Indonesia and The Netherlands, nor Malaysia and The Netherlands, while Indonesia and Malaysia have a bi directional causality. This indicates that CPO prices of Indonesia and Malaysia are more likely influenced
by the exchange price of Malaysia rather than that of Rotterdam. Most CPO markets in the world use Rotterdam market price and Malaysia Palm Oil Futures as the reference price. Rotterdam market is more of current physical sales market while the Malaysian market is more of futures market. However, Table 7 shows that as a group EU28 significantly influences Indonesia, but not vice versa. In other words, EU28 CPO price is the leader for Indonesia. The negative coefficient sign shows that an increase in EU28 price leads to a decrease in Indonesian price. This might partly relate to the European consumer behavior which in fact does not concern green products (TNS, 2013). The increase in (the certified) palm oil price will lead to a decrease in the consumer demand, which in turn decrease the European Country import and palm oil price in their supplier countries such as Indonesia and Malaysia.
Table 6. SUR Estimation results in scenario I Regressand
Regressor Indo Malay India China German Italy The Netherlands
C 0,08 -0,07 -0,04 0,17 0,14 0,18 -0,05
Indo 0,85*** 0,99*** -1,48*** -0,72*** -0,08 0,31
Malay 0,80*** -0,18 1,71*** 0,93*** -0,03 -0,32
India 0,17 -0,05 0,18 0,42*** 0,08 0,45**
China -0,17 0,12 0,07 -0,08 0,10 0,35**
Germany -0,04 0,12 -0,01 -0,21 0,19 0,03
Italy 0,08 0,02 0,09 0,26 -0,20** 0,19
The Netherlands -0,02 0,05 0,16*** 0,47 0,35*** 0,22*
Description: *, **, and *** show the significance at α = 10%. α = 5% and α = 1%, respectively
Table 7. SUR Estimation Results in Scenario II Regressand
Regressor
Indonesia Malaysia India China EU28
C 0,11 -0,06 -0,04 0,12 0,07
Indonesia 0,83 0,91*** -1,23*** 0,05
Malaysia 0,78*** -0,20 1,22*** 0,00
India 0,25 0,09 -0,05 0,43***
China -0,08 0,21 0,04 0,27***
EU28 -0,22* -0,06 0,37*** 1,06***
Managerial implications
Indonesia can improve efficiency by increasing productivity or decreasing production and marketing costs. Due to the use of low quality seeds and fertilizer that do not comply with the recommended amount and composition, a number of Smallholders’ oil palm plantations in Indonesia still have low productivity. Many of the Smallholders’ oil palm trees have passed the economical age but have not been replanting because they do not have the capital. Also, a number of oil palm plantations have not been integrated with the processing and marketing agents, thus the marketing chain becomes lengthy and marketing costs become high. To improve such conditions, the government could facilitate partnerships between the palm oil smallholders and oil companies and other related agents in the palm oil agribusiness system. This includes the improvement of mills, refineries, transportation and port infrastructures and lowering production and marketing costs.
A previous (WWF, 2013) shows that one of the sustainable RSPO certification is expensive. The costs include transaction and compliance costs that do not directly increase CPO producers’ production and income, especially those of the Smallholders (Chalil and Barus, 2013). This partly leads Indonesia and Malaysia to propose an alternative certification, such as Indonesia Sustainable Palm Oil (ISPO) and Malaysia Sustainable Palm Oil (MSPO). Both certificates could overcome the RSPO certification problems if their benefit could compensate their costs. The benefit could increase if CPO importers and consumers accept the certificate and increase the price or quantity demand, while the cost could decrease if the principle and criteria of the certificates are less complicated and less heavily focused on provisions of documents.
conclusions anD recoMMenDations
conclusions
The estimation results show market integration among some European countries, India, China, Indonesia and Malaysia, and price changes are transmitted among these markets. However, apart from EU28 and Indonesia, none of the European countries, individually or in the group of EU28 leads the CPO price in India, China, Indonesia or Malaysia. In fact, India and China
are main CPO importers, while Indonesia and Malaysia are main exporters. India imports most of the CPO from Indonesia, while China imports them from Malaysia. Both use almost all of their CPO for domestic edible oil consumption. Both India and China consumers are likely highly price sensitive, hence a Small increase in the CPO price can significantly decrease their demand. Indian government even subsidizes the distribution, so that the oil can be sold at an affordable price. India itself is a producer of some vegetable oils and even started to develop oil palm plantations. Palm oil appears to be the main oil with 77% share of the total vegetable oil consumption in India. Because of the competitive price, ninety percent of the edible oil in India is sold in loss rather than branded form which means no premium is available to be paid as the "branded sustainable palm oil". Companies in India have started to obtain RSPO certificates in 2012, but until 2014 their CSPO consumption was still very low (WWF, 2013; Arora et al. 2014). Similarly, Indonesia also uses most of the CPO for edible oil and most of the end consumers would use the certified product only if the prices are the same or lower than those of their current uncertified product (Daemeter, 2015). This partly explains the slow improvement in RSPO certified CPO (CSPO) absorption and the decrease in CSPO premium price. In fact, sustainable palm oil products are more demanded by European countries, but not transmitted to other main palm oil importers such as India and China. Without the participation of the two countries, the sustainability of sustainable palm oil is questionable.
recommendations
Since European countries are not the main export destinations of Indonesia, it should proportionally respond to their demands, including the RSPO certification. The reason is it requires a considerable amount of money with a large amount of effort, but the uptake and premium price are still low. Indonesia should improve efficiencies and provide competitive selling prices to meet demands from India and China.
reFerences
Anderson SW, Daly JD, Johnson MF. 1999. Why firms seek ISO certification: regulatory compliance or competitive advantage?. Production and
org/10.1111/j.1937-5956.1999.tb00059.x. Arianto ME, Daryanto A, Arifin B, Nuryartono N. 2010.
Analisis harga minyak sawit, tinjauan kointegrasi harga minyak nabati dan minyak bumi. Jurnal
Manajemen dan Agribisnis 7(1):1–15.
Arora B et al. 2014. Responsible business practices in the Indian palm oil sector. Centre for Responsible Business.https://www.isealalliance.org/sites/ default/files/Responsible-Business-Practices- in-the-Indian-Palm-Oil-Sector-CRB-Feb-2014-PDF.pdf.[1 March 2016].
Arshad FM, Hameed AAA. 2014. Price transmission in selected Malaysia fruit market. American Journal
of Applied Science 11(3):347-355. http://dx.doi.
org/10.3844/ajassp.2014.347.355.
Atmadja S, Verdot L. 2012. A review of the state of research. policies and strategies in addressing leakage from Reducing Emissions from Deforestation and Forest Degradation (REDD+). Mitigation and Adaptation Strategies for Global
Change 17:311–336. http://dx.doi.org/10.1007/
s11027-011-9328-4.
Carew et al. 2012. Market integration and relationship between farm-level prices: evidence from cherry markets In BC, Washington and California. Journal of International Agricultural Trade And Development 8(1):1556–8520.
Chalil D, Barus R. 2013. Smallholders’ willingness to pay for RSPO certification [Research Report]. Directorate General of Higher Education. Daemeter. 2015. Seeing Palm Oil through Indonesian
Consumers’ Eyes: Baseline Study on Consumers’ Perception. Bogor: RSPO and Daemeter.
Dickey, D.A. and W.A. Fuller. 1979. Distribution of the estimation for autoregressive time series with a unit root. Journal of the American Statistical
Association 74(366): 427–431.
Edet GE, Akpan SB, Patrick IV. 2014. Assessment of price transmission and market integration of pawpaw and leafy telfairia in AkwaIbom State. Nigeria. American Journal of experimental
Agriculture 4(11):1367–1384. http://dx.doi.
org/10.9734/AJEA/2014/10839.
Engle RF, Granger CWJ. 1987. Co-Integration and error correction: representation, estimation and testing. econometrica 55(2): 251–276.
Fossati, S, F. Lorenzo and C.M. Rodriguez. 2007. Regional and international market integration of a small open economy. Journal of Applied
economics X(1):77–98.
Gerasimchuck I, Koh PY. 2013. The EU biofuel
policy and palm oil: cutting subsidies or cutting rainforest? research report. The International Institute for Sustainable Development. www. iisd.org/gsi. [3 September 2015].
Gon J. 2005. Forest certification costs and global forest product markets and trade: a general equilibrium analysis. Canadian Journal of Forest Research
35(7):1731–1743.http://dx.doi.org/10.1139/x05-100.
Hoebink P et al. 2014. The impact of coffee certification on smallholder farmers in Kenya. Uganda and Ethiopia [Research Paper]. Centre for International Development Issues Nijmegen (CIDIN).
Hucal S. 2015. Without India, you can forget about achieving a sustainable palm oil sector. http://www. theguardian.com/sustainable-business/2015/ a u g / 1 0 / i n d i a p a l m o i l s u s t a i n a b i l i t y -deforestation-unilever-greenpeace. [1 November 2015].
Jones D, Kwiecinsk A. 2010. Policy responses in emerging economies to international agricultural commodity price surges. OECD Food. Agriculture and Fisheries Working Papers. No. 34.
Hossain MI, Verbeke W. 2010. Evaluation of rice markets integration in Bangladesh. The Lahore Journal of Economics 15(2):77–96. agricultural trade of developing countries. OECD trade policy Papers. No. 142. http:// dx.doi.org/10.1787/5k4c9kwfdx8r-en.
Naylor RN et al. 2007. The ripple effect: biofuels. food security and the environment. environment 49:31– 43.http://dx.doi.org/10.3200/ENVT.49.9.30-43. Nelson et al. 2010. Participatory organic certification in
Mexico: an alternative approach to maintaining the integrity of the organic label. Agric Hum
Values 27:227–237. http://dx.doi.org/10.1007/
org/statistics.html. [5 December 2015]
Parrish BD, Luzadis VA, Bentley WR. 2005. What Tanzania’s Coffee Farmers Can Teach the World: A Performance-Based Look at the Fair Trade– Free Trade Debate. Sustainable Development 13:177–189. http://dx.doi.org/10.1002/sd.276. Port of Rotterdam. 2015. Rotterdam Your World Class
Agriport: All round Service for Food, Feed and Fuel. https://www.portofrotterdam.com/ sites/default/files/Rotterdam-your-world-class-agriport.pdf [5 December 2015].
Rahman A et al. 2012. The price discovery of the Malaysian crude palm oil futures markets. Journal of Applied Finance & Banking 2(4):25– 47.
Rapsomanikis G et al. 2006. Market Integration and Price Transmission in Selected Food and Cash Crops Markets of Developing Countries: Review and Applications. In: FAO and edward
Elgar (eds.). Agriculture Commodity Market and Trade: New Approaches to Analyzing Market Structure and Instability. UK:Cheltenham. Ridder M et al. 2014. Impact on Sustainable Security of
Supply of Agri-Food Imports for the Netherlands. Research Report. The Hague Centre for Strategic Studies and TNO.
Rosa F et al. 2014. Agricultural and oil commodities: price transmission and market integration between US and Italy. Bio-based and Applied
economics 3(2):93–117.
Roy A, Hanssens DM, Raju JS. 1994. Competitive pricing by a price leader. Management Science 40(7):809–82.http://dx.doi.org/10.1287/ mnsc.40.7.809.
RSPO. 2014. Impact repot 2014. http://www.rspo.
org/consumers/debate/blog/rspo-impact-report-2014 [5 December 2015].
RSPO. 2015. A shared vision 100% sustainable palm oil in Europe, A snapshotof national initiatives. http://www.rspo.org/consumers/debate/blog/ rspo-impact-report-2014 [5 December 2015]. SPOTT. 2016. Sustainable supply chain for refineries.
http:www//www.sustainablepalmoil.org/ refineries-manufactureres/refineries/sustainable-supply-chains/ [5 December 2015].
Stanton JV, Burkink TJ. 2008. Improving Small farmer participation in export marketing channels: perceptions of US fresh produce importers. Supply Chain Management: An International Journal 13(3): 199–210. http://dx.doi. org/10.1108/13598540810871244.
TNS Political and Social. 2013. Attitudes of europeans
towards Building the Single Market for Green Products. European Commision.
USDA. 2015. Oilseeds: world markets and trade. http:// apps.fas.usda.gov/psdonline/circulars/oilseeds. pdf.[5 December 2015].
Wani MH et al. 2015. Market integration and price forecasting of apple in India. Indian Journal of
Agricultural economy 70(2):169–181.
Wurriehausen N et al. 2012. Market integration of conventional and organic wheat in Germany [Discussion Paper]. Gottingen: Department fur Agrarokonomieund Rurale Entwicklung, Universitat Gottingen.
WWF. 2013. Palm oil market and sustainability in India. WWF Report. http://awsassets.panda. org/downloads/palmoilmarketsustainability_ india_2013.pdf [5 December 2015].