of Brain Tissue Affected by Ischemic Stroke
Farida Grinberg
1,3*
., Ezequiel Farrher
1., Luisa Ciobanu
2., Franc¸oise Geffroy
2, Denis Le Bihan
2,
N. Jon Shah
1,31Institute of Neuroscience and Medicine - 4, Forschungszentrum Juelich GmbH, Juelich, Germany,2NeuroSpin, Commissariat a` l’e´nergie atomique et aux e´nergies alternatives (CEA Saclay), Gif-sur-Yvette, France,3Department of Neurology, Faculty of Medicine, JARA, RWTH Aachen University, Aachen, Germany
Abstract
Recent diffusion MRI studies of stroke in humans and animals have shown that the quantitative parameters characterising
the degree of non-Gaussianity of the diffusion process are much more sensitive to ischemic changes than the
apparent
diffusion coefficient
(ADC) considered so far as the ‘‘gold standard’’. The observed changes exceeded that of the ADC by a
remarkable factor of 2 to 3. These studies were based on the novel non-Gaussian methods, such as diffusion kurtosis
imaging (DKI) and log-normal distribution function imaging (LNDFI). As shown in our previous work investigating the
animal stroke model, a combined analysis using two methods, DKI and LNDFI provides valuable complimentary information.
In the present work, we report the application of three non-Gaussian diffusion models to quantify the deviations from the
Gaussian behaviour in stroke induced by transient middle cerebral artery occlusion in rat brains: the gamma-distribution
function (GDF), the stretched exponential model (SEM), and the biexponential model. The main goal was to compare the
sensitivity of various non-Gaussian metrics to ischemic changes and to investigate if a combined application of several
models will provide added value in the assessment of stroke. We have shown that two models, GDF and SEM, exhibit a
better performance than the conventional method and allow for a significantly enhanced visualization of lesions.
Furthermore, we showed that valuable information regarding spatial properties of stroke lesions can be obtained. In
particular, we observed a stratified cortex structure in the lesions that were well visible in the maps of the GDF and SEM
metrics, but poorly distinguishable in the ADC-maps. Our results provided evidence that cortical layers tend to be differently
affected by ischemic processes.
Citation:Grinberg F, Farrher E, Ciobanu L, Geffroy F, Le Bihan D, et al. (2014) Non-Gaussian Diffusion Imaging for Enhanced Contrast of Brain Tissue Affected by Ischemic Stroke. PLoS ONE 9(2): e89225. doi:10.1371/journal.pone.0089225
Editor:Noam Harel, University of Minnesota, United States of America
ReceivedOctober 25, 2013;AcceptedJanuary 16, 2014;PublishedFebruary 27, 2014
Copyright:ß2014 Grinberg et al. This is an open-access article distributed under the terms of the Creative Commons Attribution License, which permits unrestricted use, distribution, and reproduction in any medium, provided the original author and source are credited.
Funding:The authors have no support or funding to report.
Competing Interests:The authors have declared that no competing interests exist.
* E-mail: [email protected]
.These authors contributed equally to the work.
Introduction
Diffusion magnetic resonance imaging (MRI) is known as an
important tool in early diagnostics and assessment of stroke [1,2].
Usually, the
apparent diffusion coefficient
(ADC) exhibits a strong
reduction within the first half an hour after the onset of infarction
and allows for a visualisation of the ischemic lesion prior to
manifestation by other conventional MRI modalities. Diffusion
changes are associated with a failure of the sodium/potassium
pump, giving rise to an inter-compartmental water shift and cell
swelling (cytotoxic oedema). In spite of the high clinical relevance
and intensive studies, the biophysical mechanisms of the observed
ADC reduction are not yet well understood [3]. They are most
frequently ascribed to the combined effects of restricting more
water in swollen cells and an increased tortuosity of the
extracellular space. Additional mechanisms may include changes
in membrane permeability [4], amount of bound water [5],
destruction of intracellular organelles [6] and cytoplasmic
stream-ing [7]. More recent studies suggest focal enlargements of cellular
projections (the so-called neurite beading) [8–10] as an essential
mechanism of decreasing the diffusion coefficient.
In recent years, non-Gaussian diffusion methods permitting the
analysis of the DW signal over a larger range of
b
-values have
gained an increasing importance in brain research. During the last
one and a half decades several approaches, such as diffusion
kurtosis imaging (DKI) [17,18], biexponential diffusion tensor
analysis (BEDTA) [13,14,19–21], the statistical model by
Ya-blonskiy [22], the stretched-exponential model (SEM) [12,23] or
its modifications to describe anomalous diffusion [24–28], have
been suggested to account for deviations from the Gaussian model.
Although a link with tissue microscopic features is not
straightfor-ward, all these approaches permit the quantification of the degree
of non-monoexponentiality of the DW signal based on different
assumptions [29,30]. Some approaches, such as DKI, are
empirical in their nature and aim to describe the attenuation of
the MRI signal using a set of phenomenological parameters. Other
models use geometric schemes [31–33], such as a set of oriented
cylinders describing axonal formations in white matter (WM), or a
set of macroscopically disordered cylinders as an approximate of
neuronal processes in gray matter (GM). In particular, DKI is a
model-free extension of conventional diffusion MRI (in particular,
diffusion tensor imaging, DTI), making use of a higher order
quadratic term in the Taylor series expansion of the natural
logarithm of the DW signal. BEDTA represents the simplest
realization of the frequency distribution of the ADCs given by a
discrete sum of two exponentials. It assumes the existence of two
water pools with different ADCs. These pools can be attributed,
for example, to different compartments (intracellular, ICS, and
extracellular, ECS, space) [32], or to free and bound water [5].
The statistical model [22] extends a discrete number of pools to a
continuous distribution of ADCs. In this way it accounts for the
complexity and heterogeneity of the tissue microstructure that
imposes motional restrictions and hindrances on various length
scales and models different local diffusion environments for
diffusion of different spin ensembles. Further models specify
axonal sizes and densities as a source of the ADC distribution and
support the experimental protocols for their determination
[34,35].
These models provide a more accurate approximation of the
DW signal than conventional diffusion MRI in the moderate to
high
b
-value ranges [36] and enrich the information on the brain
tissue microstructure [37,38]. Nevertheless, regarding their
appli-cations to the study of diseases, non-Gaussian approaches are still
at an early stage since the related progress remained rather slow,
mainly, due to technical problems. In the early implementations,
the impediment to clinical adoption was primarily due to a severe
decrease in the signal-to-noise ratio with increasing
b
-values,
leading to a prolongation of the acquisition time above the clinical
requirements. In recent years, however, more and more
applica-tions have been reported to provide enhanced information on
microstructural properties of healthy and pathological tissues. A
real breakthrough was achieved with DKI in recent years as it has
been demonstrated to provide promising biomarkers in healthy
aging [39,40], stroke [9,10,41–43] and in neurodegenerative
diseases, such as Parkinson’s [44], Huntington’s [45], and
Alzheimer’s diseases [46]. Besides, DKI has been demonstrated
to be helpful in glioma grading [47,48]. Promising applications of
the SEM have been reported by Bennett et al. to investigate brain
tumours [49], and also BEDTA has been shown to provide
interesting results in the study of tumours [49,50].
Regarding stroke, an enhancement of DKI metrics in ischemic
lesions was observed by Jensen et al. [10] in humans and a similar
enhancement was reported in the animal stroke model by
Grinberg et al. [41]. Interestingly, the amount of change in DKI
parameters reported in these two works was very similar in spite of
the differences in the substrate tissues carrying the lesions, that is,
WM in the human brain [10] and GM in the rat brain [41]. In
both tissue types, the ADC has changed by 30–40%, typical for
stroke, whereas the mean kurtosis (MK) changed up to 100–150%
within the first 24 hours after symptom onset. A larger absolute
percent change in kurtosis metrics in comparison to the ADC was
also reported by Hui et al. [9] for a large group of stroke patients
(retrospective study of 44 patients) who underwent investigations
within the first 2 weeks after the onset. Based on a WM model that
describes the microstructure in terms of extra- and intra-axonal
environments, the observed changes in diffusion metrics were
attributed to a significant drop in the intra-axonal diffusion
microenvironment as a dominating factor, consistent with a
proposed mechanism of axonal beading [8].
In our previous work [41], the DKI study of the animal stroke
model was complemented by the investigation of another
non-Gaussian model called log-normal distribution function imaging
(LNDFI). It is based on the statistical approach and describes the
diffusion behaviour in terms of the log-normal distribution
function of ADCs. It was shown to provide a good signal
description of the DW signal down to 4% of the initial non-DW
value. Previous results have demonstrated that the peak diffusivity,
D
LD, and the scale parameter,
s
LD, of the LNDFI model exhibit
an enhanced sensitivity to ischemic lesions, i.e.
,
60% change in
s
LDand
,
50% in
D
LD.
These findings raised our interest in the following question:
what are the advantages of other non-Gaussian models suggested
in the literature and how they will perform in the assessment of
stroke in comparison to each other? In this work we provide a
characterisation of the ischemic lesions in animals by three
non-Gaussian models: a) SEM, b) the statistical model based on the
gamma distribution function (GDF), and c) BEDTA. Our goal was
to investigate the applicability and sensitivity of the quantitative
metrics in these models as biomarkers of stroke-induced
micro-structural changes in animals. We compared the performance of
these models with previously investigated DKI and LNDFI. We
hypothesized that simultaneous application of several models can
provide added value in the assessment of stroke.
Theoretical Background
Monoexponential and kurtosis models
In isotropic non-confined media, diffusion is described by the
Gaussian propagator. The conjunct normalised DW signal (i.e. the
signal intensity divided by its value in absence of
diffusion-weighting gradients),
S
(
b
), is given by a monoexponential function
[51]
S
(
b
)
~
exp(
{
bDm
),
ð
1
Þ
gradients. Using the measurements of the DW signal in at least 6
gradient directions DTI describes the diffusion behaviour in terms
of scalar metrics such as mean diffusivity (MD) or fractional
anisotropy (FA) [52]. In complex media, the measured metrics will
depend not only upon the genuine features of the underlying
microstructure itself but also on the experimental parameters such
as sequence timings. To keep these factors in mind, the diffusion
coefficient evaluated from the pulsed field gradient MRI
experiments in brain tissue is conventionally referred to as the
ADC [15].
DKI accounts for deviations from the pattern of Gaussian
diffusion by including a second-order term in the Taylor
expansion of the natural logarithm of the DW signal. The DW
signal then can be written as [17]
S
(
b
)
&
exp(
{
bD
Kz
1
6
b
2
D
2K
K
)
ð
2
Þ
where
D
Kand
K
denote the apparent diffusivity and the apparent
kurtosis for an individual gradient direction, respectively.
D
Kdetermines the initial slope of the signal attenuation curve
{
lim
b?0L
S b
ð Þ
L
b
~
D
K,
ð
3
Þ
and coincides with the ADC evaluated for the same gradient
direction under the assumption of monoexponential
approxima-tion in the low
b
-value range. MK can be evaluated as the
arithmetic average of
K
along various gradient directions [37].
Due to the truncation of higher order terms, applicability of DKI
is limited to a moderate range of
b
-values,
b
ƒ
3
=
D
KK
.
Statistical model
Generally, heterogeneous systems give rise to more than one
single diffusion coefficient. Assuming a continuous distribution of
diffusion coefficients,
P
(
D
), the DW signal can be written as
follows
S b
ð Þ
~
ð
P D
ð Þ
exp
ð
{
bD
Þ
dD
ð
4
Þ
with the initial slope of the attenuation curve yielding the mean
diffusivity,
S
D
T
, of the distribution
{
lim
A comparison with the monoexponential model shows that
S
D
T
will be close to
D
mevaluated via Eq. (1) in the range of very low
b
-values. It should be noted that a similar differentiation between the
intrinsic and reduced diffusion coefficients as in the case of
monoexponential function applies for distributed diffusivities. As
an example, the diffusivity distributions in polymer solutions are
most frequently due to a distribution of macromolecular sizes. In
that case, the measured distribution refers to intrinsic diffusivities
and allows one to deduce information on polymer polydispersity
[53,54]. In contrast, the statistical model of diffusion in biological
tissue [22] attributes the distribution to a large number of spin
packets each characterised by its individual reduced (or apparent)
diffusivity. The reason for the distribution is that, because of
restrictions and hindrances in a disordered media, various spin
packets tend to explore somewhat different local environments
during the observation time. In general, the individual spin packets
are due to heterogeneity of the environment and do not necessarily
require an existence of separated physical compartments in the
tissue. The distribution of reduced diffusivities due to motional
barriers, giving rise to non-monoexponential signal attenuations,
can originate also from the same compartment as was
demon-strated, for example, by Monte Carlo simulations [55] and
phantom studies [56] for diffusion in the interstitial space between
oriented cylindrical objects.
According to Eq. (4), the distribution function
P
(
D
) can be
found from the experimental data via inverse Laplace transform.
However, the latter represents a well-known, ill-conditioned
mathematical problem and leads to unstable computational
solutions [57]. Therefore, for practical purposes, it is more
convenient to assume an explicit form of
P
(
D
) and to fit it to the
experimental values. In general, many functional forms may
provide satisfactory fits to the experimental data points. The
choice of such a function is usually done empirically since the
related theories usually do not provide predictions for the specific
shape of the distribution. The principal requirement is that the
distribution function does not contain unphysical negative
diffusivities and is thus asymmetric. Examples are the truncated
normal distribution function [22] and the log-normal distribution
function [58].
In the past, the log-normal distribution function was applied in
the study of polymer diffusion [53] and, more recently, it has been
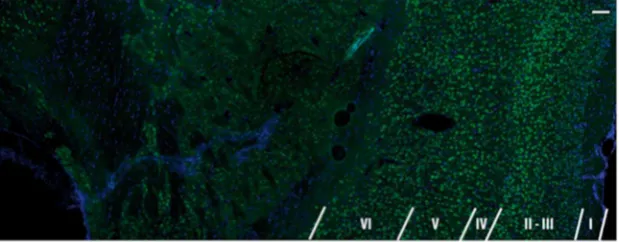
Figure 1. Photomicrograph showing the cortical lamination pattern in a normal rat brain.Superimposed photomicrograph of NeuN (antibody against neuronal nuclei), green, and DAPI (49,69-diamidino-2-phenylindole), blue, staining demonstrating the cortical lamination. Scale bar 100mm.
used with the animal stroke model [41]. Being positive-definite it
does not require an artificial cut off for negative diffusivity values.
However, the disadvantage of this function is that, in combination
with Eq. (4), it does not yield an analytically tractable integral and
therefore requires time consuming numerical solutions. As an
alternative, the gamma distribution function,
P
G
(
D
) has been
suggested recently and applied in the study of polymer diffusion
[54]:
P
Gð
D
,
k
,
h
Þ
~
D
k{1exp
ð
{
D
=
h
Þ
C
ð Þ
k
h
k,
ð
6
Þ
where
C
is the gamma function,
h
is the scale parameter of the
same dimensionality as the diffusivity, and
k
is the shape
parameter. Replacing
P
(
D
) in Eq. (4) by
P
G
(
D
), Eq. (6), gives
the following expression for the DW signal attenuation [54]:
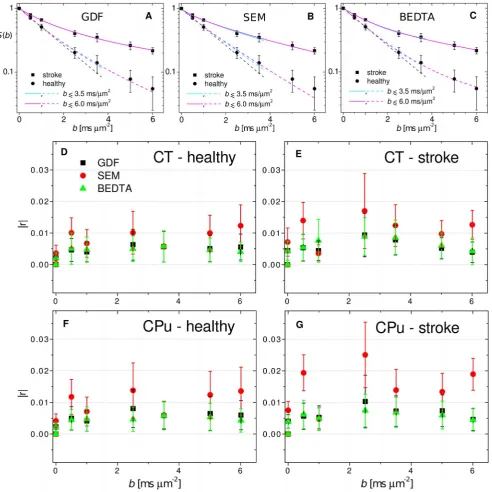
Figure 2. Experimental DW signal, fits and residuals.Diffusion-weighted signal as a function ofb-value for two selected voxels in the ischemic and healthy regions. The fits (A, B, C) are shown for the gamma-distribution function (A), the stretched-exponential model (B), and the biexponential diffusion tensor analysis (C) for two fitting ranges. Absolute residuals (D–G) as a function ofb. The bars indicate standard deviations around the means.S b
ð Þ
~
ð
1z
bh
Þ
{k:
ð7Þ
The free parameters,
h
and
k
, can be expressed through the mean
diffusion coefficient and standard deviation,
s
G, as [54]:
h
~
s
2G
S
D
T,
ð8Þ
k
~S
D
T
2s
2G
:
ð9Þ
In application to polydisperse polymers, Ro¨ding et al. [54] have
shown that both functions, log-normal distribution function and
GDF, provide strongly correlated estimates. However, the
computational speed for GDF was much faster than for the
log-normal distribution function making it a preferable choice in
studies of macromolecular polydispersity.
Biexponential model
The biexponential model represents a simple realisation of the
distribution function with only two mode contributions
Table 1.
The values of fit parameters for GDF (
h
,
s
), SEM
(DDC,
a
SE), and BEDTA (ADC
f, ADC
s, and
f
f) in two fitting
ranges; the values of
SADCT
GDand
s
GDcorrespond to fit
parameters of GDF.
b= 3.5 msmm22 b= 6.0 msmm22
model parameter healthy stroke healthy stroke
GDF SADCTGD 0.7160.02 0.5260.03 0.7260.02 0.5160.02 sGD 0.3060.05 0.4960.06 0.3560.04 0.4760.04
h 0.1360.04 0.4660.12 0.1760.04 0.4360.08
k 5.6061.89 1.1360.30 4.2360.99 1.1860.22
SEM DDC 0.6360.01 0.3260.01 0.6260.02 0.3160.01
aSE 0.9260.03 0.7860.04 0.8960.03 0.7460.03 BEDTA ADCf 0.7460.01 0.6660.19 0.7760.05 0.8960.15 ADCs 0.0160.49 0.0160.19 0.1560.01 0.1560.03
ff 0.9360.14 0.7260.26 0.8860.08 0.4660.09
The experimental curves together with their fits are shown in Figure 2. All diffusivity values are in ms21mm2.
doi:10.1371/journal.pone.0089225.t001
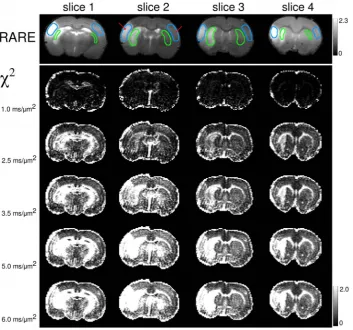
Figure 3. Dependence of thex2-maps on the fitting range.Anatomical RARE (Rapid Acquisition with Refocused Echoes) images (upper panel)
andx2-maps (lower panel) for variousb-values and four slices in animal 1. The errors increase throughout the image with increasingb. In lesions and
white matter regions the increase is especially strong, leading to a more clear contrast at largerb. The regions-of-interest used for averaging of the measured parameters are shown in RARE images in cyan and green. Red arrows indicate the locations of the voxels used in Figure 2.
S b
ð Þ~
f
fexp
ð
{
bD
fÞz
ð
1{
f
fÞexp
ð
{
bD
sÞ,
ð10Þ
where
D
fand
D
sare the (apparent) diffusivities of the fast and slow
attenuation components, and
f
fand
f
s:1{
f
fare the relative
fractions of the fast and slow components, respectively. The
biexponential function has been frequently evoked in the frame of
‘‘two-compartment’’ models [32,59] for water in the extra-cellular
and intra-cellular spaces, respectively. An alternative
interpreta-tion attributes the biexponential behaviour of the diffusion signal
to the presence of ‘‘bound’’ and ‘‘free’’ water pools [5] that may
exist within the same compartment. Statistically uniform but
disordered media can also exhibit quasi-biexponential behaviour
which then reflects the presence of distinct disorder length scales
rather than the presence of separate compartments or pools [60].
Under certain circumstances, in the short time limit, a
quasi-biexponential behaviour can be caused by the so-called ‘‘edge
enhancement effects’’ due to restricting boundaries within the
same compartment [61,62]. In general, interpretation of the fast
and slow diffusion processes in the brain tissue remains elusive [15]
and requires caution in its application. Nevertheless, the
biexponential function remains a useful model, especially in
WM, as it captures significant features of the diffusion behaviour.
BEDTA allows one to evaluate a single parameter,
a
BEDTA
,
quantifying the degree of non-monoexponentiality and sensitive to
the presence of a slow diffusion fraction [14]:
a
BEDTA~
ffiffiffiffiffiffiffiffiffiffiffiffiffiffiffiffiffiffiffiffiffiffiffiffiffiffiffiffiffiffiffiffiffiffiffiffiffiffiffiffiffiffiffiffiffiffiffiffiffiffiffiffiffiffiffiffiffiffiffiffiffiffiffiffiffiffiffiffiffiffiffiffi
f
fð
D
f{
S
D
T
Þ
2z(1{
f
f)
ð
D
s{
S
D
T
Þ
2q
S
D
T
,
ð11Þ
where
S
D
T
:
f
fD
fz
ð
1{
f
fÞ
D
s.
a
BEDTA= 0 corresponds to a
monoexponential decay, which implies that either
D
f=
D
s=
D
mor one of the component fractions is equal to 0 or to 1. In the
opposite
limit
of
the
strongest
non-monoexponentiality,
a
BEDTA= 1, both fractions are equal to each other (f
f~0
:
5
) and
one of the diffusivities is negligibly small (for instance,
D
s= 0
m
m
2ms
21).
Stretched-exponential model
The stretched-exponential function is well known with regard to
the global time relaxation behaviour of a disordered system that
can be described by a superposition of independently relaxing
exponential modes [63]. Bennett et al. [12] adapted this model to
characterize heterogeneity of the DW signal as follows
S
(
b
)~
S
0exp
{
ð
b
|
DDC
Þ
aSE
f
g,
ð12Þ
where DDC is the distributed diffusion coefficient, and
a
SE
is the
stretching exponent characterising deviations from the
mono-exponential
behaviour
(the
so-called
heterogeneity
index,
0
#
a
SE#1). For the Gaussian model,
a
SE
= 1. Note that the initial
slope of the function does not provide the mean diffusivity, since
the first derivative of Eq. (12) exhibits a singularity at
b
= 0.
Obviously, the characteristic parameter of this model, DDC, does
not coincide with the mean diffusivity except for
a
SE
= 1.
The stretched exponential function also arises in the context of a
continuous time random walk model [64]. This model gives rise to
anomalous diffusion behaviour by assuming that either jump
lengths or time steps obey the power law distribution. In the
anomalous and fractal model approaches [23,25,28], lower
a
SEvalues indicate increasing disorder of the microenvironment in
which the molecules diffuse.
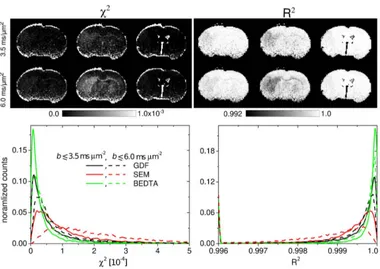
Figure 4. Estimates of the goodness-of-fits.x2- and R2-maps and the corresponding histograms in ranges 1 and 2.
Materials and Methods
Animals
Transient middle cerebral artery occlusion (MCAO) was
induced [65] in three animals (300 g, Sprague-Dawley male rats)
for the stroke experiments. The rats underwent a 90 min transient
occlusion and were imaged 24 hours after reperfusion. The
animals were anaesthetised with isoflurane (2%) administered in
a mixture of air/oxygen through a nose cone and maintained at
constant temperature (37uC) using a feedback-controlled air
heating system (MR-compatible small animal heating system, SA
Instruments, Inc., NY). The diffusion weighted acquisitions were
respiration triggered. All experiments complied with French
legislation and guidelines for animal research. The animal protocol
was approved by the Comite´ d’EThique en Expe´rimentation
Animale Commissariat a` l’Energie Atomique et aux e´nergies
alternatives Direction des Sciences du Vivant Ile de France
(CETEA CEA DSV IdF).
Immunohistochemistry and fluorescence microscopy
Brains were perfused with a saline solution and, after complete
blood removal, with 4% paraformaldehyde, and extracted. They
were kept in paraformaldehyde for 2 h for tissue fixation, in 15%
sucrose solution for 12 h and in 30% sucrose solution for 24 h for
cryoprotection. 10
m
m thick tissue slices were sectioned using a
cryostat (Microm HM 560, Thermo Scientific, Courtaboeuf
Cedex, France). Fluorescence microscopy was performed on an
Axio Observer Z1 microscope (Carl Zeiss MicroImaging, Jena,
Germany). One slice was treated with an antibody against
neuronal nuclei (NeuN, Millipore, MAB377X, alexa 488
conju-gated) and with 4
9
,6
9
-diamidino-2-phenylindole (DAPI) staining in
order to highlight the different cell densities within the cortex.
Figure 1 demonstrates NeuN/DAPI labeled photomicrograph
showing the cortical lamination. Scale bar = 100
m
m.
MRI experiments
MRI experiments were performed on a 7T system (Bruker,
PharmaScan) equipped with magnetic field gradients with
maximum strength of 760 mT/m and a home-built RF surface
coil (2.5 cm diameter). Rapid Acquisition with Refocused Echoes
(RARE) T
2-weighted images were acquired to localize the lesions
(TR = 5530 ms, effective TE = 76 ms, FOV = 3
6
3 cm
2, matrix
size = 128
6
128, slice thickness = 1 mm, NEX = 2). Four-segment
DW SE EPI images were acquired with the following acquisition
parameters: TR/TE = 3000/30 ms, FOV = 3
6
3 cm
2, matrix size
128
6
128, in-plane voxel size 234
6
234
m
m
2, slice thickness 1 mm,
number of slices 4, slice gap 0.2 mm, diffusion field gradient
duration
d
= 5 ms, NEX = 4, and interpulse spacing between the
gradient pulses
D
= 17 ms. The number of gradient directions was
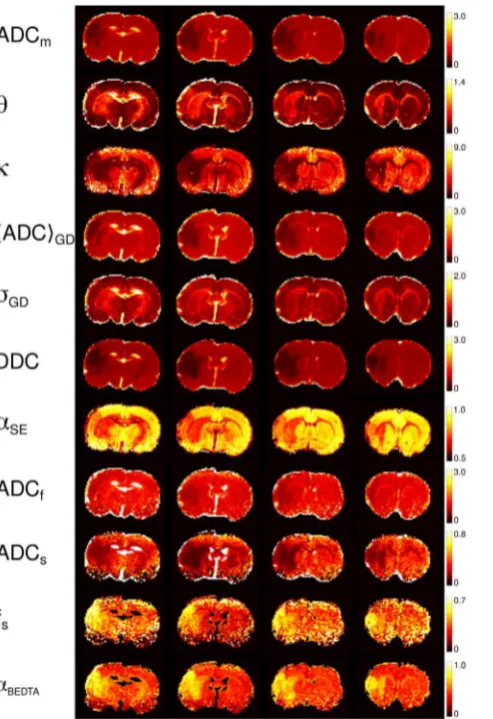
Figure 5. Parameter maps (animal 1).The maps of the investigatedmodel parameters of the four slices in animal 1. The numbers on the scale bars that refer to ADCm,h,SADCTGD, DDC, ADCf, and ADCs, are in units ms21
mm2.
doi:10.1371/journal.pone.0089225.g005
Figure 6. Zoomed regions.Zoomed regions of the maps shown in Figure 5 for selected parameters best representing the layered structure in the lesions (left, slice 1) and WM tracts (right, slice 3).
20 (we omit a specification of the unit vectors since this
investigation is focused mainly on the orientationally averaged
parameters). The following five
b
-values were used for all animals:
0, 0.5, 1, 2.5, 3,5
m
m
22ms. Two more
b
-values at 5 and
6
m
m
22ms were added to the measurement protocol of animal 1
in order to produce a stronger attenuation and check its influence
on the fitting procedure. In the following, the fitting ranges with
b
#
3.5
m
m
22ms and
b
#
6
m
m
22ms will be denoted as range 1
and range 2, respectively.
Data analysis
Bias in the DW images due to the background noise was
corrected using the power-images method [66,67]. Computation
of parameter maps was performed with in-house Matlab scripts
(Matlab, The MathWorks, Natick, MA, USA). The normalized
DW signal intensities,
S
(
b
), were fitted on a voxel-by-voxel basis
using the functions described above, Eqs. (1, 2, 7, 10, 12), with the
help of the nonlinear least-squares Nelder-Mead algorithm in the
range of
b
-values indicated above, except for the monoexponential
fits which were performed for
b
#
1
m
m
22ms. An upper boundary
constraint (
#
3
m
m
2ms
21) was set according to the diffusivity of
free water at 37
u
C.
The fits of the investigated models were compared for two
b
-value ranges (range 1 and range 2). The fit quality was quantified
via evaluation of
x
2- and R
2-maps according to:
x
2~
1
where
yi
is the normalised signal amplitude of the
i
-th
experimental point,
S
(
b
i) is value of the fitting function,g
~
N
{
n
with
n
being the number of free parameters and
N
being the number of experimental points,
y
y
is the mean of the
normalized signal amplitude. The mean absolute residuals were
evaluated for each
b
-value as
S
j j
r
T
i~
S
j
y
i{
S b
ð Þ
ij
T
, where the
average is taken over all voxels in a region of interest (ROI) in all
slices and all animals.
x
2-maps were evaluated also for the
monoexponential fits for different
b
-value ranges in order to
visualize the deviations for increasing
b
.
The anisotropy of the DW signal in all ROIs was practically
negligible since the ischemic lesions studied were located only in
GM. Therefore, to enhance the SNR, the non-Gaussian models
were fitted to the mean experimental curves averaged over all
gradient directions. In the following, to appreciate the ‘‘apparent’’
nature of the evaluated diffusivities, we shall denote them as ADCs
with subscripts indicating the model (‘‘m’’ for monoexponential,
‘‘K’’ for DKI, ‘‘GD’’ for GDM, ‘‘LD’’ for LNDFI. Subscripts ‘‘f’’
and ‘‘s’’ will denote fast and slow diffusivities in BEDTA. The
maps were constructed for DDC and
a
SE(SEM),
h
and
k
(GDF),
and ADC
f, ADC
s, and
fs
(BEDTA). In addition, we evaluated
SADCT
GDand
s
GDwith Eqs. (8, 9) in order to enable a
comparison with typical parameters such as the mean ADC and
standard deviation. The histograms of the investigated parameters
were taken over all slices for animal 1. The average values of
different metrics were evaluated for two ROIs located in the
ischemic lesions, and compared with the corresponding values in
healthy counterparts. The ROIs were placed in the cerebral cortex
(CT) and caudate putamen (CPu). The relative changes of the
parameters in lesions compared to the healthy counterparts were
evaluated, in per cent, as the ratio of the difference between the
average values of a given parameter in the ischemic and healthy
ROIs with respect to the average value in the healthy ROI. The
averages were taken over all slices and animals (12 slices in total).
Further details regarding the MR experiments and data processing
are described elsewhere [41].
Results
Typical diffusion attenuation curves for two representative
voxels located in healthy and affected regions are shown in
Figures 2a–2c, together with their fits using GDF, SEM and
BEDTA, respectively. Fit parameters are listed in Table 1. The
monoexponential function is shown as a black dashed line for the
healthy voxel as an example. Clear deviations from the
monoexponential
behaviour
occur
for
b
.
1
m
m
22ms.
In
Figure 3,
x
2-maps of the monoexponential fits visualise how these
deviations increase with increasing
b
-value. The maps are shown
for 4 different slices in animal 1. At
b
= 1
m
m
22ms, the
x
2-maps
look rather homogeneous but exhibit increasing contrast between
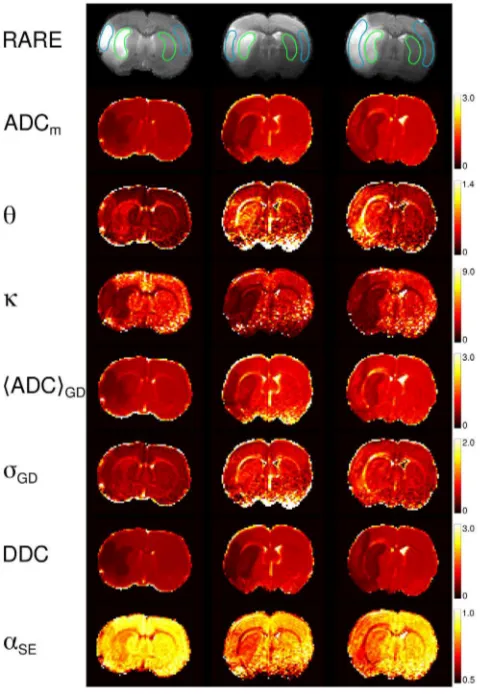
Figure 7. Parameter maps (all animals).Anatomical RARE ((RapidAcquisition with Refocused Echoes)) images and maps of ADCm,h,k, SADCTGD,sGD, DDC,aSEfor one selected slice best representing the
ischemic lesion in each of the three animals. All diffusivities are in units ms21
mm2. The regions-of-interest used for averaging of the measured
GM and WM (see the ‘‘brightening’’ of WM tracts such as the
corpus callosum) in accordance with similar findings in human
brain [68]. Moreover, stroke lesions cannot be recognised in
x
2-maps for
b
#
1
mm
22ms (see anatomic RARE-maps for their
locations) but become strikingly enhanced for larger
b
. Thus, the
x
2-maps provide a clear evidence for that the degree of
non-Gaussianity is higher in stroke lesions than in healthy tissue.
The fit values (see Table 1) were similar for both ranges of
b
-values with the exception of ADC
sin BEDTA. The overall fit
quality by all three models was good in both fitting ranges as
demonstrated in Figure 4 by the corresponding
x
2- and R
2-maps
and their histograms averaged over all slices in animal 1, as an
example, as well as in Figures 2d–2g by the analysis of the mean
absolute residuals as a function of
b
-value. In both ranges, the
x
2-and R
2-maps look similar to each other for all three models
demonstrating a satisfactory homogeneity across most parts of
images with rather low values for
x
2, and values close to 1 for R
2.
Somewhat increased lesion-to-tissue and WM-GM contrasts can
be recognised for SEM in range 2 (when comparing to range 1 and
to other models), indicating larger errors. A more detailed
statistical analysis is represented by the values of
S
j j
r
T
evaluated
separately for the four ROIs studied (CT healthy, CT lesion, CPu
healthy, CPu lesion) and averaged over all slices in animal 1. The
mean residuals exhibited no tendency for systematically increasing
errors with increasing
b
-values, indicating robustness of the fits
regarding the range. At any
b
-values, the values of
S
j j
r
T
did not
exceed approximately
6
0.02 for GDF and BEDTA, and
6
0.04
for SEM. SEM shows, in general, larger errors than GDF and
BEDTA. However, based on the analysis of the residuals and of
standard deviations of the fitted values, both the GDF and SEM
models provided satisfactory fits. For BEDTA, a satisfactory
reliability of the fitted parameters was found only in the range 2,
whereas the standard deviations of the fitted parameters in range 1
were too high, see Table 1. This is because, in range 1, the DW
signal was dominated by the fast component, and the slow
component could not be reliably estimated. Therefore, we omitted
the results of the statistical analysis for BEDTA in range 1 from
further consideration.
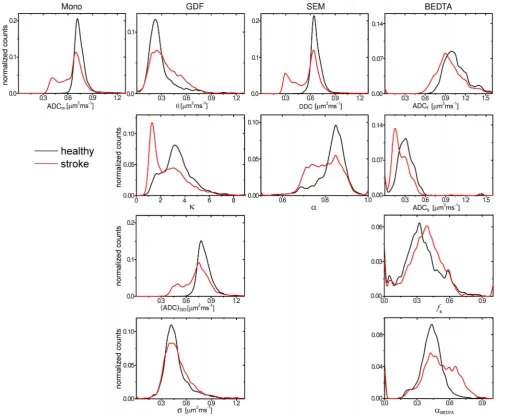
Figure 8. Histograms of parameter metrics.Histograms of parameter metrics of the investigated models evaluated separately for affected and contralateral hemispheres taken over all slices (animal 1).
Figure 5 shows the maps of ADC
m,
h
,
k
,
S
ADC
T
GD,
s
GD,
DDC,
a
SE, ADC
f, ADC
s,
f
s, and
a
BEDTAfor animal 1, all of them
providing a clear contrast for two of the ischemic lesions. These
maps refer to the fitting range 2. The values of ADC
m,
k
,
S
ADC
T
GD, DDC and
a
SE, ADC
s, and
f
sand
a
BEDTAwere
strongly decreased in the ischemic regions, whereas
h
and
s
GDwere significantly enhanced. The t-tests performed on these values,
comparing healthy against affected ROIs, showed that the changes
in all above parameters were significant (p
,
0.001).
The contrasts provided by the various model parameters exhibit
essential differences. When comparing them to the conventional
ADC
m-map, the most similar contrast was produced by
S
ADC
T
GD. This is not surprising since ADC
m, evaluated in the
low
b
-value range must be rather close to the mean diffusivity
represented by
S
ADC
T
GD, see Eq. (5). This finding confirms the
robustness of the GDF model: the values of
S
ADC
T
GDwere
directly evaluated from the fitted values of
h
and
k
using the large
range of
b
-values, up to 6
mm
22ms, where the signal was reduced
by a factor 5 to 10. The DDC-maps provided a somewhat greater
contrast than the ADC
m-maps. Considering BEDTA, we may
state that the corresponding parameter maps were much noisier
than the maps of the other models. Nevertheless, the
BEDTA-maps provided useful information showing that, in stroke, ADC
sdecreases more than ADC
f, and that
f
sincreases. This emphasises
that the dominant changes in diffusion are associated with the slow
diffusion component.
a
BEDTA-maps produced much more clear
visualization of the lesions than each of the three fitting parameters
taken separately.
In several maps of non-Gaussian quantities,
h
,
k
,
a
SEand
a
BEDTA, an apparent stratified laminar structure of the cortex can
be observed in the lesions whereas it is difficult to be recognised in
the ADC
m-maps. This is demonstrated in detail by the zoomed
areas of the selected parameters in Figure 6, left column. The
laminar structure is best visualised in the
a
SE-map. Interestingly, it
is apparent only in the stroke-affected tissue providing evidence for
differences in the ischemic response by different cortical layers. In
general, the non-Gaussian parameters tended to capture
micro-structural features in more detail than the diffusivity maps: see
Table 2.
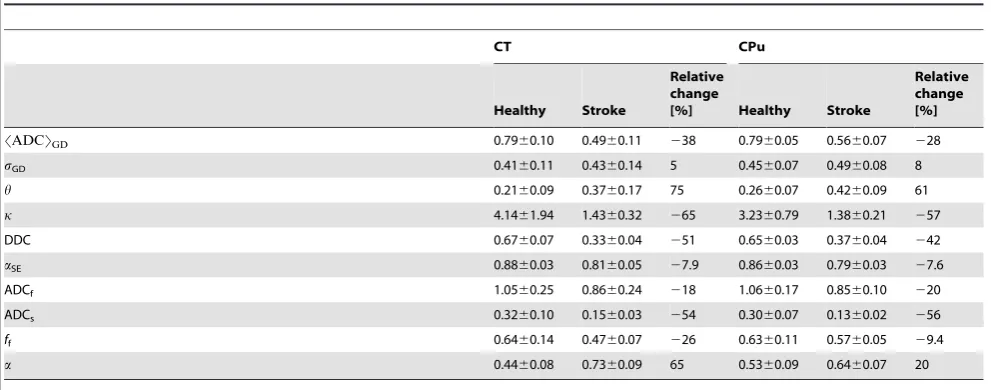
Relative changes of the model parameters evaluated in two lesions, CT and CPu, averaged for 4 slices in animal 1.
CT CPu
Healthy Stroke
Relative change
[%] Healthy Stroke
Relative change [%]
SADCTGD 0.7960.10 0.4960.11 238 0.7960.05 0.5660.07 228
sGD 0.4160.11 0.4360.14 5 0.4560.07 0.4960.08 8
h 0.2160.09 0.3760.17 75 0.2660.07 0.4260.09 61
k 4.1461.94 1.4360.32 265 3.2360.79 1.3860.21 257
DDC 0.6760.07 0.3360.04 251 0.6560.03 0.3760.04 242
aSE 0.8860.03 0.8160.05 27.9 0.8660.03 0.7960.03 27.6
ADCf 1.0560.25 0.8660.24 218 1.0660.17 0.8560.10 220
ADCs 0.3260.10 0.1560.03 254 0.3060.07 0.1360.02 256
ff 0.6460.14 0.4760.07 226 0.6360.11 0.5760.05 29.4
a 0.4460.08 0.7360.09 65 0.5360.09 0.6460.07 20
All diffusivity values are in ms21
mm2. doi:10.1371/journal.pone.0089225.t002
Figure 9. Overview of the average parameter changes.Relative changes in per cent of the values of the investigated model parameters averaged over all slices in each animal and over all three animals; error bars indicate the standard deviations. For a better overview, we included here the data for DKI (Dmand MK) and LNDFI (DLDandsLD) investigated in the previous work [41].
WM tracts that appear much brighter in
h
-,
k
-, and
a
SE-maps thanin the ADCm-maps in Figures 5 and 6 (zoomed areas, right panel).
These effects remained when fitting the data over the smaller
range of
b
-values,
b
#
3.5
m
m
22ms, as demonstrated in Figure 7
for one selected slice in each of the animals. Here also the
structural details were more favourably visualised in the
h
-,
k
- ,
s
GD- anda
SE-maps rather than in the ADCm-,
S
ADC
T
GD- or
DDC-maps.
The observed contrasts were accompanied by significant shifts
of the parameter histograms shown in Figure 8. The histograms of
diffusivities, ADCm,
S
ADC
T
GDand DDC, exhibit similar shifts of
their substantial parts towards significantly smaller values. The
histograms of non-Gaussianity metrics,
k
and
a
SE, were alsoshifted towards smaller values with a clear peak-like feature in the
k
-histogram compared to a shoulder-like spread in
a
SE. Shiftstowards higher values were observed in the histograms of
h
and
f
s.Table 2 summarises the average values of various metrics as well
as their relative changes in the affected versus healthy regions (all
parameters refer to animal 1, range 2). When comparing two
models, GDF and SEM, the largest changes were observed for
h
in
GDF (75% in CT and 61% in CPu) followed by
k
(
2
65% in CT
and
2
57% in CPu). The changes of
S
ADC
T
GD(
2
38% in CT
and
2
28% in CPu) were similar to that of ADCm
(
2
42% in CT
and
2
32% in CPu). SEM exhibited larger changes of DDC
(
2
51% in CT and
2
42% in CPu) than ADCm. However, the
relative changes in
a
SE(about 8%) were low compared to other
metrics. BEDTA parameters exhibited a larger decrease of ADCs
(
2
54% in CT and
2
56% in CPu) relative to both ADCf
(
2
18% in
CT and
2
20% in CPu) and ADCm.
Figure 9 summarises the relative parameter changes in GDF
and SEM averaged over all slices measured for all three animals
(four slices in each). For a better visual comparison of the new
(GDF and SEM) and old (DKI and LNDFI) models, the data is
complimented by the relative changes observed for parameters
ADCK, MK, ADCLD, and
s
LDinvestigated in the previous work
[41]. Most of the parameters tend to show somewhat larger
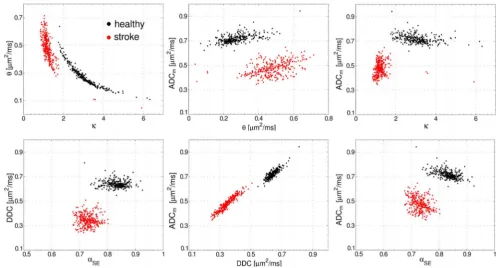
Figure 10. Scatter plots.Scatter plots for different combinations of parameters:hvs.k(gamma-distribution function, GDF) DDC vs.aSE(stretched
exponential model, SEM), and ADCmvs. each of the GDF and SEM parameters. The Pearson’s,r, and Spearman’s,r, correlation coefficients are shown in Table 3.
doi:10.1371/journal.pone.0089225.g010
Table 3.
The Pearson’s,
r
, and Spearman’s,
r
, correlation coefficients for the data shown in Figure 10.
GDF SEM
hvs.k ADCmvs.h ADCmvs.k DDC vs.aSE ADCmvs. DDC ADCmvs.aSE
r healthy 20.89 0.58 20.40 20.09 0.88 20.54
stroke 20.70 0.47 0.26 20.04 0.95 20.33
r healthy 20.99 0.56 20.44 20.06 0.83 20.53
stroke 20.71 0.46 0.25 20.08 0.95 20.34
changes in CT than in CPu. All data refer to range 1. It should be
noted that the larger range would be inapplicable for DKI. On the
contrary, BEDTA requires a larger range of
b
-values and,
therefore, is not included in this overview. Figure 9 shows that
both non-Gaussian models, GDF and SEM, are more sensitive to
lesions than conventional diffusion MRI. Amongst the two models,
GDF and SEM, better sensitivity was provided by GDF: the
parameters
h
and
k
exhibited relative changes of
,
75% and
,2
60%, respectively, versus
2
(40–46)% for DDC and
,
9% in
a
SE. However, a comparison between four models (GDF, SEM,
DKI and LNDF) has shown that DKI provides the largest
sensitivity followed by GDF, LNDF and SEM.
Figure 10 demonstrates the scatter plots for the model
parameters,
h
and
k
, and DDC versus
a
SE, as well as between
ADC
mand
h
,
k
, DDC or
a
SE, for ROIs in lesions and
contralateral tissue. The data refer to animal 1 and all slices.
One can clearly see that the scatter plots allow one to separate the
voxels belonging to the affected and healthy tissue with practically
no overlap. The corresponding Pearson’s,
r
, and Spearman’s,
r
,
correlation coefficients are represented in Table 3 for
complete-ness. However, more detailed analysis of these coefficients was
outside the focus of this paper.
Discussions and Conclusion
Development of non-Gaussian diffusion imaging is emerging as
a novel tool providing clinically useful information on brain tissue.
Related to stroke, investigation of non-Gaussian models has a very
short history represented by a few papers published during the last
couple of years [9,10,41–43]. These works have shown promising
potentials in using those models for stroke assessment. In the
present work we examined three additional non-Gaussian
approaches, SEM, GDF and BEDTA. The two former models
have not been previously applied to stroke. Moreover, while GDF
was used to characterise the distribution of axon diameters [34]
and of macromolecular diffusivities in polymers [54], it has not
been used to model the diffusion response in the brain tissue. We
compared the results with the conventional monoexponential
model and two previously investigated models, DKI and LNDFI,
using the same data sets. To date, few reports exist in which
several non-Gaussian models are compared on the same data sets
of
in vivo
[36,69] or
in vitro
[70] experiments. The emphasis of
those studies was put more on the methodological issues such as
goodness-of-fit, influence of noise, or model ranking. While we also
made an estimations of the fit quality, our main interest was
focused on the comparison of the performance of the
non-Gaussian metrics as biomarkers of the pathological state. Given
the effect of ischemic events on the tissue microstructure and
diffusion properties, the animal stroke model is well suited for a
comparison of various methods. Similar to DKI and LNDFI, the
GDF and SEM models demand a minimum of 3
b
-values so that,
with no extra time for measurements, all parameters of these 4
models can be obtained in post-processing based on the same data.
We assume that our comparative investigation should contribute
to further development and improvement of diagnostic tools in
stroke.
Ideally, one would like to fit the experimental curves over the
largest
b
-value range possible, to yield maximal attenuation of the
signal from its initial value. However, various factors limit the
usable
b
-value range, with noise being the most typical problem at
high
b
-values. An applicability of each model is, in turn, another
important issue. As well-known examples, DTI is limited to the
low
b
-values range (
b
#
1
m
m
22ms), whereas DKI can be applied
to more extended but also limited (
b
ƒ3
=
(
D
|
MK
)) range. The
applicability of DKI in our work corresponds to the range 1. If the
applicability range is limited, more caution is required when
comparing results obtained by different research groups since the
evaluated metrics and their variation may significantly depend on
the selected range of
b
. Although a detailed analysis of the
b
-value
dependence of fitting parameters was beyond the scope of this
work, we checked the applicability of the investigated models in
two fitting ranges, moderate and extended. GDF and SEM, to
their advantage, occurred to be relatively robust with respect to
the selected range of
b
-values. The same applies also to LNDFI
studied in the previous work [41]. BEDTA, on the other hand, was
applicable only in range 2. In comparison to the other investigated
models, BEDTA is less robust as it contains one more fitting
parameter (3, if signal intensities are normalised), and is more
vulnerable to low signal-to-noise ratio [36,68]. Therefore, it is less
beneficial for stroke analysis as it demands more scanning time.
Nevertheless, application of BEDTA allowed us to receive
additional useful information as it directly showed that the
dominant contribution to the reduction of the mean diffusivity is
due to the slow diffusion component and includes both the
decrease of ADC
sand increase of
fs
. An increase of
fs
in ischemic
human brain was reported also in Ref. [71], although the authors
observed an increase rather than a decrease of ADC
s. In ouabain
induced cell swelling in a perfused rat hippocampal slice, Buckley
et al. [72] also observed an increase of
fs
, however, not
accompanied with any significant changes in the values of ADC
fand ADC
s. Based on observations related to biexponential
behaviour, Le Bihan et al. [5,15] emphasized the dominant role
of membranes, bound water and the residence times near tissue
boundaries affecting the diffusion behaviour in stroke.
Several parameters map studied in this work were able to
provide a better visual contrast than the conventional ADC
mmap
and exhibited larger relative changes in ischemic versus healthy
tissues. The smallest change was detected for
a
SEin SEM. In
contrast, the DDC of this model provided a somewhat larger
change than ADC
m. Analogously, smaller sensitivity of the
stretched exponent,
a
SE, in comparison to other non-Gaussian
parameters, was observed also as a function of fibre density, which
modulates the tortuosity of the interstitial space, in the physical
diffusion fibre phantoms [73]. A cancer study using SEM has
shown that, in tumours,
a
SEhad similar values to that in WM but
much lower values than the typical tumours in GM [49]. In
general, based on the amount of the average change over all slices
and animals, the parameters of the four models (GDF, SEM, DKI,
and LNDFI), see Figure 9, demonstrate that the largest changes
were observed in MK, followed by
h
,
k
,
s
LD, DDC, ADC
LD,
ADC
K, ADC
m, and, finally, by
a
SEM. The non-Gaussianity
metrics (with the exception of
a
SE) provided a spectacular gain
in contrast relative to the ‘‘gold standard’’, ADC
m.
More detailed information can be gathered from the analysis of
the histograms and scatter plots. The histograms of various
parameters exhibited significant differences in their shapes that
can explain the different sensitivities to stroke of the mean values.
In particular, the histogram of DDC exhibits a splitting into two
distinguished peaks similar to that of ADC
m(attributed to the
healthy and affected areas). In contrast, the histogram of
a
SEshows
a continuous broadening towards the lower values. Although the
associated change of the mean is not very large, we see that a
significant part of the histogram does not overlap with that of the
healthy counterpart. This can explain an observed high laminar
contrast in lesions produced by
a
SE-maps although the sensitivity
of the mean value was low.
simultaneous changes may be more informative. We demonstrated
that ischemic lesions tend to be well separated from the healthy
tissues using the correlation plots. We expect this kind analysis to
be helpful in diagnostics, as it should allow one to increase the
certainty and reliability of the pathological state assessment. The
scatter plots may also be valuable for post-stroke monitoring of the
patients as, with time after onset, the diffusivity values begin to
normalise and do not provide clear characteristics for the tissue
state. The same approach can be useful regarding other
pathologies, especially if they are related to GM. This is because
DTI metrics important in WM, such as FA and axial or radial
diffusivities, are not predicative in GM due to its isotropy.
Non-Gaussianity parameters, in contrast, are thought to quantify the
complexity of the tissue microstructure rather than its anisotropy.
An interesting finding of this work is the appearance of laminar
cortical structures in stroke lesions. The genuine differences in
cortical layer microstructure are well-known from histology, as
shown in Figure 1. However, observation of cortical layers with
MRI is a challenging task [74–76] and requires special efforts,
such as using manganese-enhanced methods [75]. In healthy
regions, no clear laminar contrast was observed but became
distinguishable in the lesions represented via
a
SE- ,
h
- and
k
-maps.
Retrospectively, the laminar structure can also be recognised in
s
LD-maps of LNDFI shown in Figures 2 and 4 of the previous
work [41]. However, it is hardly visible in the diffusivity maps. Our
finding allows us to propose that the cascade of ischemic processes
tends to non-uniformly affect the cortical layers differentiating by
their cyto- and myeloarchitecture [74]. Based on diffusion studies,
such phenomenon has not been reported before. However, a
significant difference between cortical layers in the time profile of
eosinophilic neurons in the post-ischemic cortex was reported by
Sun et al. [77]. Furthermore, the layered structure as a response to
stroke was observed in MRI images one week after MCAO [78].
Sbarbati et al. [78] observed three layers and interpreted their
origin due to enlargement of the pial space in the external layer,
degenerating nervous tissue accompanied by a massive
accumu-lation of macrophages in the middle layer, and by the presence of
edematous nerve tissue without a marked accumulation of
macrophages in the deepest layer. In our study, in difference, a
stratified structure was observed only 24 hours after stroke.
Selective vulnerability of cortical layers to ischemia can also be
due to higher metabolic demand and denser concentration of
receptors for excitatory amino acids [79]. In this context, it should
be noted that the larger parameter changes observed in CT (GM)
than in CPu (mixture of GM and WM) might also be due to
microstructural differences in these anatomical regions and
different susceptibility of GM and WM to ischemic injury.
However, elucidation of the underlying mechanisms requires a
special focus in a dedicated future work, and was beyond the scope
of this paper.
Understanding of how ischemic processes are related with the
fine microstructural features could greatly improve our knowledge
of the biophysical mechanisms of the ischemic damage [80]. These
mechanisms have not been understood in detail so far and remain
a subject of debate. Swollen cells, increased tortuosity of the ECS,
changes in membrane permeability, increases in the amount of
bound water and, proposed more recently, neurite beading may all
come into play [81]. In this context, non-Gaussian metrics provide
complementary data to infer valuable microstructural information
for comparison with existing models of stroke. Useful models
should be able to explain not only the average decrease of the
mean diffusivity by about 40% but also a simultaneous large
increase of deviations from the Gaussian model as quantified
above. For example, increasing tortuosity of the ECS alone is not
likely to be sufficient to explain the amount of the observed
changes. This consideration is based on a comparison of our
results with those obtained for anisotropic fibre phantoms [73],
where the tortuosity was modulated by the fibre density. It was
shown that changing fibre density from 0.45 to 0.7 (close packing
density) is accompanied by a three-fold decrease of the diffusivity
whereas kurtosis and
s
LDhave increased by rather moderate 50%.
Qualitatively, our results would be compatible with the model of
cell swelling accompanied by neurite beading already suggested to
explain observed increases in kurtosis in human stroke [9,10]. This
model would non-uniformly increase the contribution of slow
diffusion fractions by more restricted environments both in the
ICS and ECS. Also increases in the amount of bound water or a
reduction in the membrane permeability could lead to an increase
in the slow diffusion fraction. More work is required to understand
the complex cascade of pathological processes in stroke that
change an environmental landscape for diffusing water molecules.
Among others, one needs to perform the studies with a large group
of animals in order to reduce inter-subject variability and enhance
a statistical significance. However, with further theoretical and
experimental developments, these biophysical changes can be
expected to be better quantified with non-Gaussianity metrics.
In conclusion, we have shown that non-Gaussian metrics are
useful in the elucidation of stroke and provide potentially valuable
information. This refers, in particular, to enhanced contrast of the
lesions and its quantification with respect to healthy tissue and to
the fine microstructure differences within the lesions, such as the
observation of cortical laminar structures. Two-dimensional
scatter plots allow one to delineate affected tissue with better
reliability.
Acknowledgments
F. Grinberg thanks Dr. D. S. Grebenkov and Dr. I. I. Maximov for valuable discussions and Dr. M. S. Poole for careful proofreading of the manuscript.
Author Contributions
Conceived and designed the experiments: F. Grinberg LC EF. Performed the experiments: LC F. Geffroy. Analyzed the data: F. Grinberg EF LC F. Geffroy DLB NJS. Contributed reagents/materials/analysis tools: F. Grinberg EF LC F. Geffroy DLB NJS. Wrote the manuscript: F. Grinberg. Discussion Of the results: F. Grinberg EF LC DLB NJS. Revision of the manuscript: F. Grinberg EF LC DLB NJS.
References
1. Moseley ME, Cohen Y, Mintorovitch J, Chileuitt L, Shimizu H, et al. (1990) Early detection of regional cerebral ischemia in cats: comparison of diffusion-and T2-weighted MRI diffusion-and spectroscopy. Magn Reson Med 14: 330–346. 2. Sotak CH (2002) The role of diffusion tensor imaging in the evaluation of
ischemic brain injury - a review. NMR Biomed 15: 561–569.
3. Schaefer PW, Copen WA, Lev MH, Gonzalez RG (2006) Diffusion-weighted imaging in acute stroke. Magn Reson Imaging Clin N Am 14: 141–168. 4. Latt J, Nilsson M, van Westen D, Wirestam R, Stahlberg F, et al. (2009)
Diffusion-weighted MRI measurements on stroke patients reveal
water-exchange mechanisms in sub-acute ischaemic lesions. NMR Biomed 22: 619– 628.
5. Le Bihan D (2007) The ‘wet mind’: water and functional neuroimaging. Phys Med Biol 52: R57–90.
6. van Pul C, Jennekens W, Nicolay K, Kopinga K, Wijn PF (2005) Ischemia-induced ADC changes are larger than osmotically-Ischemia-induced ADC changes in a neonatal rat hippocampus model. Magn Reson Med 53: 348–355.