MIXED LIFE CYCLE-COST BENEFIT WEB BASED-DECISION TOOL
FOR LIGHTING LOAD RETROFITTING AND MANAGEMENT
Yusak Tanoto, Emmy Hosea and Murtiyanto Santoso
Department of Electrical Engineering, Petra Christian University, Jalan Siwalankerto Surabaya, Indonesia
E-Mail: [email protected]
ABSTRACT
This paper presents a prototype of web based interactive application that has been developed as a decision tool in lighting retrofitting and its loading management. The main purpose of the application is to support Lighting-Demand Side Management program. Life cycle cost method and cost-benefit analysis are both used as financial basis to obtain the best option among selected alternatives, which has the least life cycle cost and the highest net present value that reflect cost-benefit analysis result. An interactive daily lighting loading curve that can be constructed based on several scenarios of lighting utilization is available. This web application, of which accessible online and offline, is developed using Hyper Text Markup Language 5, Cascading Style Sheets, and JavaScript programming.
Keywords: lighting-demand side management, interactive, web application, load management.
1. INTRODUCTION
The growth of electricity energy utilization in developing countries had been increased significantly in a decade despite of national or global economic challenge. In Indonesia, the 2012 power generation installed capacity is increased for 12.41% compared to that in 2011. Meanwhile, electricity consumption for all customer categories were 173, 990 GWh in 2012, or it had risen for 10.13% compared to that achieved in 2011 [1]. Increasing electricity consumption is good in one way but in other way it may create potential problem due to energy security constraint and resource scarcity. Therefore, careful energy policy and planning should be taken into account. Demand Side Management (DSM) [2] has been proven in sort of balancing the demand growth with resources saving. Important thing is to involve study on all related aspect comprehensively before conducting DSM programs.
A multimedia web based application has been developed to support the proposed assessment framework of residential lighting DSM, particularly in the economic analysis aspect. It is based on the Life Cycle Cost (LCC) and Cost-Benefit (CB) method [3]. As per authors’ best knowledge, such web application with the focus on lighting retrofitting and loading management based on mixed LCC-CB method is not available. This paper is focused on the description of the developed prototype web based application in lighting retrofitting and is organized as follows: overview of the application in terms of the main financial formula and its features are presented in the following section followed by some immediate notes in working with the tool. The case study along with result analysis is presented subsequenty followed by conclusion.
2. OVERVIEW OF LIGHTING RETROFITTING WEB APPLICATION
The Lighting Retrofitting Web Application (hereafter called “the tool”) is developed based on Life Cycle Cost (LCC) method and Cost-Benefit Analysis (CBA). LCC has been used extensively in determining overall cost of various project in engineering area,
particularly in those involving the presence of materials. Such cost take into account not only purchasing cost but also any other costs incurred during the life of the material involving in the project [4]. In the context of the developed tool, LCC consists of initial cost, i.e., purchasing cost (PC); re-purchasing cost (RPC); electricity energy cost (EC); installation cost (IC); and salvage value (SV). Equation (1) gives the complete formula used to determine LCC during the project lifetime:
LCCt = PC0 + RPCt + ICt +SVt (1)
PC incurred one time only whereas RPC incurred whenever a new lamp is purchased to replace the latest one due to the rated lamp lifetime. IC is required whenever a different type of lamp is considered to replace the existing lamp. EC for each lamp is calculated based on the yearly operating hours, the rated wattage, and the electricity tariff per kWh. SV gives the material value at the end of project lifetime. Among available options, the selected option should be that having the highest LCC value.
CBA is essentially utilized in this tool to calculate the economic efficiency of the proposed project [5]. We used Net Present Value (NPV) to represent benefit minus cost approach. To calculate present value of each year project’s financial condition, the assumed interest rate that referred as discount rate is applied. Hence, the calculation will take into account the discount factor applied in each year. The present value of any investment, yearly savings and all incurred cost in any specified time in the future is stated as:
PV=S X (1+IR/100)-N (2)
PV is present value of S in n year; S is value of cash flow in n year; IR is interest rate; and n is number of year. Similarly, the discount factor (DF) is based on an assumed discount rate (i.e., interest rate) and can be determined by:
Therefore, PV is the product of a particular cash flow and the discount factor. The tool also consider factor affecting analysis, of which inflation. Because of inflation, the real value of cash flow decreases with time along the project life time. The inflation factor is defined in the same expression as discount factor. Later on in the implementation, the tool will calculate the real interest rate as the discount rate minus inflation rate. In addition, to evaluate financial viability of the project, the Profitability Index (PI) is used. All considered options can be compared each other using PI to see which option give the highest PI. The Higher the PI, the more attractive the option. PI can be defined as:
PI = NPV / PC (4)
Section 3 and 4 of this paper gives the implementation of such influence and it is given in the NPV Table corresponding to each alternative option. Features provided in the developed tool are devided into several menu as described below:
Application cover: Lighting Retrofitting Web Application (Based on Cost Benefit and Life Cycle Cost Analysis) is the name given to the tool. As the improvements is still needed in terms of any potential bug correction and easiness of use, the tool version is defined as Version 1 Beta. Nevertheless, the developed tool is completely in function and it is ready to be utilized. Figure-1 shows the tool screenshot.
The energy head loss includesfriction losses and contraction or expansion losses. The equation for the energy head loss is as follows:
Figure-1. Lighting retrofitting web applications cover screenshot.
As the tool has been developed on the web basis, the application will run either online or offline under a web browser provided all features accessible. Main explanations about the tool in terms of the purpose, method used, features, and other merits are described in the “Introduction” section page. Main advantages offered by the tool are that user can utilized both CBA and LCC mechanism in a time to obtain the best option for lighting replacement, comparing NPV, LCC, and also PI of several considered options in terms of lighting types along with their lifespan and other characteristics, among others. The
broad guideline of how to use the tool are given in the “Instruction” section page in which user can find it easy to follow with the step-by-step style guideline provided on it. Tools menu: The tool consists of three main parts: firstly, introductory part, which are called “Cover”, “Introduction”, and “Instruction”, secondly, the main sections that comprise of sections namely “Existing”, “Parameter Setting”, “Retrofit Options and Analysis”, “Interactive Daily Lighting Curve”, and thirdly is the “Printing Page”. Screenshot for menu available in the tool is shown in Figure-2.
Figure-2. Screenshot for available menu in the tool.
Parameter Setting contains some financial data required by the application, i.e., project lifetime, discount rate, and inflation rate. Project lifetime is stated in years, while discount rate and inflation rate are in percent. Figure-2 is described in terms of its function as follows.
Existing: This section contains existing installed lighting type information along with its supporting data. User fill data such as: Lamp type (available option are: Incandescent lamp, Tubular lamp or T-type fluorescent lamp, compact fluorescent lamp, light emmiting diode lamp, and other lamp types); Brand; Model; Wattage; Lumen; Number of Days Operation (in hours); Electricity price (in Rupiah/kWh); Lifespan (in hours); Purchase Cost (in Rupiah); and Salvage Value (in Rupiah).
These information are required by the application as it is serve as a baseline or existing condition in lighting utilization. Hereinafter, the annual energy cost and saving are calculated for each alternative option towards existing specification.
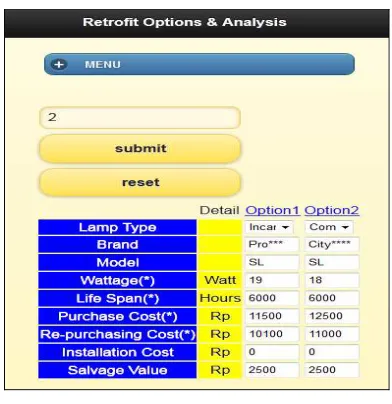
Retrofit options and analysis: In this section, user can obtain NPV, LCC, and PI for any alternative option in terms of lamp type to replace the existing one. Number of option can be typed, thus detail information regarding to each proposed lamp should be specified in the Table provided within the page, like lamp type, brand, model, wattage, lifespan, purchase cost, re-purchasing cost, installation cost, and salvage value (if any). Figure-4 shows screenshot for the section.
Figure-4. Screenshot for required data to be filled in “retrofit options and analysis” section.
Figure-5. Screenshot for “retrofit options and analysis” section results.
Figure-5 shows the tool results which consists of each option’s LCC, Purchase cost, Annual Energy Cost (AEC, in Rupiah), Annual Energy Consumption (AEC, in
kWh), Annual Energy Saving (AES, in kWh), Annual Energy Saving (AES, in Rupiah), NPV, and PI. Once user finish with filling specifications, the NPV and LCC chart will be appeared and the best option for the project will be informed in terms of the option number along with its LCC, NPV, and PI value.
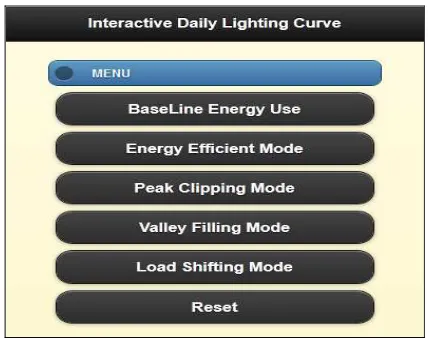
Interactive daily lighting curve: This section is related to daily lighting utilization. An interactive daily lighting loading curve can be constructed based on several scenarios of lighting utilization. User can add whatever lighting utilized along with its wattage, location, and operating hours during 24 hrs to generate the daily lighting loading curve and it is defined as Baseline Energy Use curve. The tool has several scenarios to allow user modify their loading curve.
Figure-6. Screenshot for “interactive daily lighting curve” section.
Lastly, a printing page menu contains further selection for printing the tool results, such as: existing lamp Table, option Table, graph, all lighting curve graphs and Table, and each option’s NPV is available within the tool.
3. WORKING WITH THE TOOL
Before user begins to work with the tool, it is suggested that they read the tool introduction and instruction although it will be fine if even user skip the first two section of this tool, which are introduction and instruction, and proceed forward, since the tool was designed in such a way to give easiness of use. In this version (Version 1.0 Beta), user should be awared to some notes related to the tool utilization as follows.
The project lifetime is limited upto 30 years. This is to accomodate the common duration for energy project that usually lasting for 20 to 30 years and all financial measures should be predetermined, otherwise the CBA will not correctly calculated.
comparison function between options particularly if user want to analyse options in terms of its financial performance for the same lumen. Similarly with that in “Retrofit Options and Analysis” section. In addition, value of re-purchasing cost should be entered as it is necessary to replace the proposed lamp due to its limited lifespan as well whereas installation cost is not compulsory when the same type of lighting comes in replacement. However, when different type of lighting is proposed, user need to consider the cost incurred to install the new one, which has different fixture.
Lamp’s lifespan should be entered in hours to accomodate product information as commonly given in the product package. Therefore, the entered value will be automaticly converted into year to allow cash flow calculation.
The alternatives option is limited upto 20 alternatives with only 1 option eventually selected as the best option. However, the NPV table for all alternatives is accessible to be printed.
In working with lighting curve construction, the Baseline Energy Use mode is required to be accessed first, otherwise other four mode, act as scenarios mode, could not be working properly. Brief guideline is available on the Instruction section and shortly described in earlier section of this paper.
4. CASE STUDY AND DISCUSSIONS
The tool has been tested several times and the results is quite satisfied. Although user can include up to 20 options of various lamp types, only 2 options of lamp types is presented in this paper for the illustration purpose and for simplicity of the paper. The project is considered using 10 years life time with 8% discount rate and 5% inflation rate. Electricity cost is taken Rp. 900/kWh. To work with this case, required data are firstly entered into the “Existing” section of the tool as seen in Figure-7.
Figure-7. Screenshot of required data entered in the case study.
An existing 23 Watt CFL is considered in a test, which is taken from one of the questionnaire result obtained during the survey period. The survey itself was conducted prior to the tool development and completion. The existing daily operating hours is said 5 hours for 360 days in a year. The purcahse cost is Rp. 34, 000 with lamp lifespan written in the lamp package is 8,800 hrs. As stated in the survey result, the respondent of which using this lamp type was willing to replace the existing lamp with a CFL having lower wattage, i.e., 18-19 Watt due to the energy efficiency and requirement consideration.
Figure-8. Screenshot of required data entered as alternatives.
Both options specification are entered in the “Retrofit Options and Analysis” section as seen in Figure-8. The first alternative wattage is 19 Watt whereas the second one is 18 Watt with the purchasing cost of Rp. 11, 500 and Rp. 12, 500, respectively. Both alternatives have the same lamp life span according to what written in the lamp package. Re-purchasing cost for both alternatives is taken 88% below the purchasing cost. No installation cost required due to the same type of lamp is proposed in each option and a salvage value of Rp. 2, 500 is considered for both lamps. From all information that is filled in “Retrofit Options and Analysis” menu, the tool was able to calculate each lamp’s LCC and other relevant parameters.
Figure-10 presents the NPV for option 1. Real discount factor 3 means the predefined discount rate, which is 8% reduced by inflation rate, which is 5%.
Figure-9. Screenshot of analysis results.
Figure-10. Screenshot of NPV table for option 1.
Another interesting finding is that in the case of lighting retrofitting, the best option, i.e., option 1 in this paper, is not necessarily having the highest saving. As shown in Figure-9, the annual energy saving of option 1 is calculated higher than that in option 2, but still option 1 came up as the best option. The tool performance has been tested as well for larger options involving in the analysis with various specification. The tool performance is quite satisfactory and it was found that all features are well functioned. Eventually, the tool section like “Interactive Daily Lighting Curve” can be alternatively used for the overall household appliances or even for the larger building as in principle it provides the same function.
As has been scheduled in the research activity plan, the developed tool will be shortly disseminated into the concerning party, i.e., Perusahaan Listrik Negara (Indonesian National Electricity Enterprise) in order to
elaborate the benefit of the developed application and its background assessment framework in preparing and assessing the Lighting-Demand Side Management activity. Besides, the tool is currently under final preparation to be used as one of multimedia resources in undergraduate learning activity under the Energy Management System coursework.
5. CONCLUSIONS
Utilization of multimedia based resources for lighting retrofitting and loading management is discussed in this paper. A web based application is therefore developed to assist stakeholder involving in the Demand Side Management program, particularly in the program to promote mass utilization of energy efficient lighting. The tool has been developed using two famous method to evaluate financial viability of the project and has well been tested. Since the version discussed in this paper is the first time release, further improvement and enhancement has been already thought.
ACKNOWLEDGEMENT
This paper and the corresponding web based application are produced based on the Research Contract No. 07/SP2H/PDS TRL/LPPM-UKP/III/2013. The authors therefore would like to thank Ditlitabmas DIKTI, Ministry of Education and Culture of The Republic of Indonesia for providing the research fund through the decentralized research scheme.
REFERENCES
[1] PT. Perusahaan Listrik Negara (Persero). 2012. Statistic PLN 2012. Corporate Secretary: PT. Perusahaan Listrik Negara (Persero), Jakarta, Indonesia.
[2] C.W. Gellings and J.H. Chamberlin. 1987. Demand Side Management: Concepts and Methods. 2nd Ed. Lilburn, GA: The Fairmont Press Inc.
[3] Y. Tanoto, M. Santoso and M. Hosea. 2013. Multi-Dimensional Assessment for Residential Lighting Demand Side Management: A Proposed Framework. Applied Mechanics and Materials. 284-287: 3612-3616.
[4] W. Sriamonkitkul, N. Tongsuk, R. Jareansuk, B.
Hongpeechar, S. Saengsuwan, P. Bhasaputra and W.
Pattaraprakorn. 2010. Life Cycle Cost of Lighting
System in Various Groups of End User in Thailand. The PEA-AIT International Conference on Energy and Sustainable Development (ESD 2010), Chiang Mai, Thailand, 2-4 June.