BACHELOR THESIS – ME141502
TECHNICAL STUDY OF BALLAST EFFECT
ON PITCHING RESPONSE OF PATAMARAN
LENNY RAHMAWATI 4213 100 033
Supervisor :
Irfan Syarif Arief, S.T., M.T. Ir. Hari Prastowo, M. Sc
MARINE ENGINEERING DEPARTMENT FACULTY OF MARINE TECHNOLOGY
INSTITUT TEKNOLOGI SEPULUH NOPEMBER SURABAYA
BACHELOR THESIS – ME141502
TECHNICAL STUDY OF BALLAST EFFECT
ON PITCHING RESPONSE OF PATAMARAN
LENNY RAHMAWATI 4213 100 033
Supervisor :
Irfan Syarif Arief, S.T., M.T. Ir. Hari Prastowo, M. Sc
MARINE ENGINEERING DEPARTMENT FACULTY OF MARINE TECHNOLOGY
INSTITUT TEKNOLOGI SEPULUH NOPEMBER SURABAYA
TUGAS AKHIR – ME141502
KAJIAN TEKNIK PENGARUH PERUBAHAN
BALLAST TERHADAP RESPON ANGGUKAN
PADA PATAMARAN
LENNY RAHMAWATI 4213 100 033
Dosen Pembimbing :
Irfan Syarif Arief, S.T., M.T. Ir. Hari Prastowo, M. Sc
JURUSAN TEKNIK SISTEM PERKAPALAN FAKULTAS TEKNOLOGI KELAUTAN
INSTITUT TEKNOLOGI SEPULUH NOPEMBER SURABAYA
v
DECLARATION OF HONOUR
I hereby who signed below declare that :
This final project has written and developed independently without any plagiarism act. All contents and ideas drawn directly from internal and external sources are indicated as such cited sources, literatures, and other profesional sources.
Name : Lenny Rahmawati
NRP : 4213 100 033
Final Project Title : Technical Study Of Ballast Effect On Pitching Response Of Patamaran
Department : Marine Engineering
If there is plagiarism act in the future, I will fully responsible and recieve the penalty given by ITS according to the regulation applied.
Surabaya, Januari 2017
vii
TECHNICAL STUDY OF BALLAST EFFECT ON PITCHING RESPONSE OF PATAMARAN
Name : Lenny Rahmawati
ID Number : 4213101033
Department : Marine Engineering
Supervisor : 1. Irfan Syarif Arief, S.T., M.T. 2. Ir. Hari Prastowo, M.Sc
ABSTRACT
Indonesia is a country with abundant natural resources including energy potential in it. Utilization of energy resources will greatly assist in the development of energy-based technologies. In this final project will be analyzed use in response ballast patamaran
by analyzing movem pitching that is one of the six kind of the
movement of a ship the ocean currents .In this analysis ,
needed data wind speed and tide in the nusa penida , bali or
bmkg .With additional ballast patamaran system in response
amplitude operator could get from moses shows that large
amplitude narrowed , so patamaran be quieter when exposed
currents especially in the movement of pitching.
ix
KAJIAN TEKNIK PENGARUH PERUBAHAN BALLAST TERHADAP RESPON ANGGUKAN PADA PATAMARAN
Nama : Lenny Rahmawati
NRP : 4213100033
Jurusan : Marine Engineering
Dosen Pembimbing : 1. Irfan Syarif Arief, S.T., M.T. 2. Ir. Hari Prastowo M.Sc ABSTRAK
Indonesia merupakan negara dengan sumber daya alam yang melimpah termasuk potensi energi di dalamnya. Pemanfaatan sumber daya energi tersebut akan sangat membantu dalam pengembangan teknologi berbasis energi. Tugas akhir ini akan melakukan analisa response penggunaan ballast pada patamaran dengan menganalisa gerakan pitching yang merupakan salah satu dari enam macam gerakan kapal akibat arus laut. Analisa ini, dibutuhkan data kecepatan angin dan gelombang laut di wilayah Nusa Penida, Bali yang didapatkan dari BMKG. Penambahan system ballast pada patamaran response amplitude operator yang bisa didapatkan dari moses menunjukkan bahwa besar amplitude mengecil, sehingga patamaran menjadi lebih tenang bila terkena arus terutama pada gerakan pitching.
xi
PREFACE
The author is grateful to The Almighty God, Allah SWT who has given His grace and blessing so the thesis entitled “Kajian Teknik Pengaruh Perubahan Ballast Terhadap Respon Anggukan Pada Patamaran”can be well finished.
This final project can be done well by author because the support from my family and colleague. Therefore, the author would like to thank to:
1. My father, Rahmad Harihadi and my mother, Sry Yuani and for all of my family who have given love, support, and prayers.
2. Mr. Irfan Syarif Arief, S.T., M.T. and Ir. Hari Prastowo, M. Sc as academic advisor who have been guiding and giving a lot of suggestion during my writing the final project.
3. All of my friends Baracuda'13 who have given many stories over the author completed education in the Department of Mechanical Systems shipyard FTK - ITS.
4. Special thanks to Angga, Mas Fandhika, Mas Pandhika, Jangka, Isti, Fitri, Mba Arin, Mas Syafi.
The author realizes that in the writing of this final project is still far from perfect. Therefore, any suggestions are very welcomed by the author for the improvement and advancement of this thesis. Hopefully, this final project report can be useful for the readers and reference to write next final project.
xiii
TABLE OF CONTENTS
APPROVAL SHEET ...
Error! Bookmark not defined.
DECLARATION OF HONOUR ... v
ABSTRACT ... vii
ABSTRAK ... ix
PREFACE ... xi
TABLE OF CONTENTS ... xiii
LIST OF FIGURES ... xv
CHAPTER 1 INTRODUCTION ... 1
1.1.
Background ... 1
1.2.
Statement of Problems ... 2
1.3.
Scope of Problems ... 2
1.4.
Research Objectives ... 2
1.5.
Research Benefits ... 3
CHAPTER 2 STUDY LITERATURE ... 5
2.1
Basic Theory ... 5
2.2
Sea Flow Definition ... 5
2.3. Understanding Ballast System ... 7
2.3.2. input parameters... 8
2.4. Ballast System Main Components ... 10
2.4.1. Ballast pumps ... 10
2.4.2. Ballast tanks ... 10
2.4.3. Pipe Ballast ... 11
2.4.4. Valve... 11
2.4.6 Seacheast ... 15
2.4.7. How it Works Ballast System ... 16
2.5. Ship Stability ...17
2.5.1. Types of vessel stability ... 17
2.5.2. Initial Stability ship ... 17
2.5.3. Stability Ship Equipment ... 21
CHAPTER 3 RESEARCH METHODS ...25
CHAPTER 4 DATA ANALYSIS AND DISCUSSION ....29
4.5. Data ...53
4.5.1. Draught Variation and Displacement Data ...54
4.6. Ballast Water Minimum Requirement on Several
Draught. ...56
4.7. Perbandingan Pitching pada setiap Draft ...72
4.8. Response untuk pitching pada setiap Sudut ...74
4.9. Calculation of Volume Displacement ...78
4.8.1 Calculation and Selection of Pumps ...78
CHAPTER 5 CONCLUSION ...85
4.1
Conclusion ...85
4.2
Recommendation ...86
REFERENCES...87
ATTACHMENT ...91
xv
LIST OF FIGURES
Figure 2.1 Elbow 90 ... 9
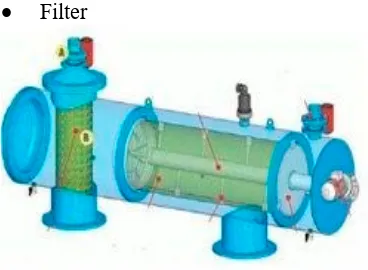
Figure 2.2 Filter ... 9
Figure 2.3 SDNRV ... 10
Figure 2.4 Gate Valve ... 10
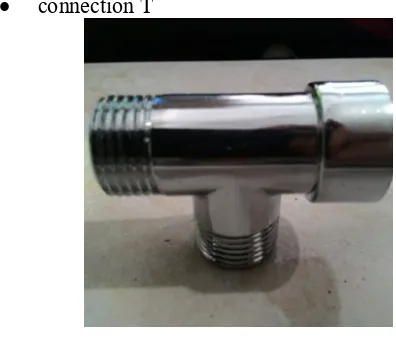
Figure 2.5 T Joint ... 11
Figure 2.6 Butterfly Valve ... 11
Figure 2.7 Outboard ... 12
Figure 2.8 Seachest ... 13
Figure 2.9 Ship Stability ... 17
Figure 2.10 Ship Stability Diagram ... 17
Figure 2.11 Translation and Rotation Movement of Ship ... 18
Figure 4.1.1 Power Plant Project Site of Ocean Waves on Nusa Penida Bali Island ... 18
Figure 4.1.2 Location of Platform Construction ... 19
Figure 4.1.3.1 Windrose Diagram ... 31
Figure 4.1.3.2 Windrose on PLTA Platform Location... 31
Figure 4.1.4 Current Rose on PLTA Location ... 40
Figure 4.1.6.1 Bathymetry Map on Toyokapeh Strait ... 45
Figure 4.1.6.2 Bathymetry Map on Toyokapeh Strait ... 46
Figure 4.2 Front View of PLTA Structure with scale 1:200 ... 49
Figure 4.3 Top View of PLTA Structure with scale 1:200 ... 49
Figure 4.4 Side View of PLTA Structure with scale 1:200 ... 50
Figure 4.5 Body Plan of PLTA Structure with scale 1:200 .. ...50
Figure 4.6 Sheer Plan of PLTA Structure with scale 1:200 ... 50
Figure 4.7 Half Breadth Plan of PLTA Structure with scale 1:200 ... Figure 4.8 Bulkhead of PLTA Structure with scale 1:200 ... 41
Figure 4.9 Midship View of PLTA Structure with scale 1:200 .. 42
Figure 4.10 Top View of Construction Profile with scale 1:200 42 Figure 4.11 Construction Profile Section of Midship with scale 1:200 ... 43
Figure 4.13 Construction Profile Section 7000mm from Midship with scale 1:200 ... 43 Figure 4.3.1 Top View of PLTA Structure Modelling with
Maxsurf ... 44 Figure 4.3.2 Side View of PLTA Structure Modelling with
Maxsurf ... 45 Figure 4.3.3 Isometric View of PLTA Structure Modelling with
Maxsurf ... 45 Figure 4.3.4 Isometric Result of Structure Modelling with
Software Moses ... 45 Figure 4.3.5 Top View Result of Structure Modelling with
Software Moses ... 46 Figure 4.3.6 Side View Result of Structure Modelling with
Software Moses ... 47 Figure 4.3.7 Front View Result of Structure Modelling with
Software Moses ... 47 Figure 4.4.1 RAO for Surge Motion on PLTA Structure Free
Floating ... 48 Figure 4.4.2 RAO for Sway Motion on PLTA Structure Free
Floating ... 48 Figure 4.4.3 RAO for Heavy Motion on PLTA Structure Free
Floating ... 49 Figure 4.4.4 RAO for Roll Motion on PLTA Structure Free
Floating ... 49 Figure 4.4.5 RAO for Pitch Motion on PLTA Structure Free
Floating ... 50 Figure 4.4.6 RAO for Yaw Motion on PLTA Structure Free
Floating ... 50 Figure 4.4.1.1 RAO for Surge Motion on PLTA Structure Free
Floating (0.75 m) ... 53 Figure 4.4.1.2 RAO for Sway Motion on PLTA Structure Free
Floating (0.75 m) ... 54 Figure 4.4.1.3 RAO for Heavy Motion on PLTA Structure Free
xvii
Figure 4.4.1.4 RAO for Roll Motion on PLTA Structure Free Floating (0.75 m) ... 55 Figure 4.4.1.5 RAO for Pitch Motion on PLTA Structure Free
Floating (0.75 m) ... 55 Figure 4.4.1.6 RAO for Yaw Motion on PLTA Structure Free
Floating (0.75 m) ... 56 Figure 4.4.2.1 RAO for Surge Motion on PLTA Structure Free
Floating (1.00 m) ... 56 Figure 4.4.2.2 RAO for Sway Motion on PLTA Structure Free
Floating (1.00 m) ... 57 Figure 4.4.2.3 RAO for Heavy Motion on PLTA Structure Free
Floating (1.00 m) ... 57 Figure 4.4.2.4 RAO for Roll Motion on PLTA Structure Free
Floating (1.00 m) ... 58 Figure 4.4.2.5 RAO for Pitch Motion on PLTA Structure Free
Floating (1.00 m) ... 58 Figure 4.4.2.6 RAO for Yaw Motion on PLTA Structure Free
Floating (1.00 m) ... 59 Figure 4.4.3.1 RAO for Surge Motion on PLTA Structure Free
Floating (1.25 m) ... 59 Figure 4.4.3.2 RAO for Sway Motion on PLTA Structure Free
Floating (1.25 m) ... 60 Figure 4.4.3.3 RAO for Heavy Motion on PLTA Structure Free
Floating (1.25 m) ... 60 Figure 4.4.3.4 RAO for Roll Motion on PLTA Structure Free
Floating (1.25 m) ... 61 Figure 4.4.3.5 RAO for Pitch Motion on PLTA Structure Free
Floating (1.25 m) ... 61 Figure 4.4.3.6 RAO for Yaw Motion on PLTA Structure Free
Floating (1.25 m) ... 62 Figure 4.4.4.1 RAO for Surge Motion on PLTA Structure Free
Floating (1.50 m) ... 62 Figure 4.4.4.2 RAO for Sway Motion on PLTA Structure Free
Figure 4.4.4.3 RAO for Heavy Motion on PLTA Structure Free Floating (1.50 m) ... 63 Figure 4.4.4.4 RAO for Roll Motion on PLTA Structure Free
Floating (1.50 m) ... 64 Figure 4.4.4.5 RAO for Pitch Motion on PLTA Structure Free
Floating (1.50 m) ... 64 Figure 4.4.4.6 RAO for Yaw Motion on PLTA Structure Free
Floating (1.50 m) ... 65 Figure 4.4.5.1 RAO for Surge Motion on PLTA Structure Free
Floating (1.75 m) ... 65 Figure 4.4.5.2 RAO for Sway Motion on PLTA Structure Free
Floating (1.75 m) ... 66 Figure 4.4.5.3 RAO for Heavy Motion on PLTA Structure Free
Floating (1.75 m) ... 66 Figure 4.4.5.4 RAO for Roll Motion on PLTA Structure Free
Floating (1.75 m) ... 67 Figure 4.4.5.5 RAO for Pitch Motion on PLTA Structure Free
Floating (1.75 m) ... 67 Figure 4.4.5.6 RAO for Yaw Motion on PLTA Structure Free
Floating (1.75 m) ... 68 Figure 4.5.1 Comparison RAO Chart for Pitch Motion for Each
Draft (0.75 m) ... 68 Figure 4.5.2 Comparison RAO Chart for Pitch Motion for Each
Draft (1.00 m) ... 69 Figure 4.5.3 Comparison RAO Chart for Pitch Motion for Each
Draft (1.25 m) ... 69 Figure 4.5.4 Comparison RAO Chart for Pitch Motion for Each
Draft (1.50 m) ... 70 Figure 4.5.5 Comparison RAO Chart for Pitch Motion for Each
Draft (1.75 m) ... 70 Figure 4.7.1 Comparison RAO Chart for Pitch Motion for Each
Angle (0 degree) ... 71 Figure 4.7.2 Comparison RAO Chart for Pitch Motion for Each
xix
Figure 4.7.3 Comparison RAO Chart for Pitch Motion for Each Angle (90 degree) ... 73 Figure 4.7.4 Comparison RAO Chart for Pitch Motion for Each
Angle (135 degree) ... 73 Figure 4.7.5 Comparison RAO Chart for Pitch Motion for Each
xxi
LIST OF TABLES
Table 4.1.2 PLTA Platform Coordinat ... 20 Table 4.1.3.2 Significant Wave Height ... 32 Table 4.1.4.1 Measurement Results of Tidal for 30 Days... 33 Table 4.1.4.2 Tidal Harmonic Constant Value ... 33 Table 4.1.5 Maximum Metocean Data Value ... 35 Table 4.2.6 Recapitulation of Main Hull PLTA Platform
Calculation ……… ... 37 Table 4.2.7 Recapitulation of Stager PLTA Platform
1
CHAPTER 1
INTRODUCTION
1.1.
Background
In the condition of the crisis energy like now, every country in the world given to find and utilizing the energy an alternative to maintain security the availability of energy source. One source of energy an alternative is by using tidal current power generation, or usually call pltal.
Technology development of tidal current power generation ( pltal ) is one form of activities ' energy resources to ensure the availability of energy .Besides , energy ocean currents as one of the new energy and renewable can be used for solving the problem of energy electricity islands in areas so it can support the business become manifest indonesia archipelago independent and forward.
Tidal current power generation is using the system structure platform turbine plt ocean currents with type patamaran. But type this platform still have several weaknesses among them is the absence of arrangement patamaran in terms of system ballast, while ocean currents always different condition if in pairs and after the sea in condition recede, offsetting patamaran need to avoid excessive on trim hull as a result of the movement of the ocean currents .
1.2.
Statement of Problems
According to the background of the study, this final project has the following statement of problems.
a) How the analysis RAO( Response Amplitude Operator) at Patamaran?
b) How the effective ballast system design at Patamaran? c) How ballast effect for pitching motion?
1.3.
Scope of Problems
According to the research problem, this final project has the following scopes.
a) The calculation just in pitching motion, not in six motion haul.
b) The analysis will only focused on the RAO (Response Amplitude Operator), not about stability of haul.
1.4.
Research Objectives
In accordance with the background of the study, this final project has these following objectives.
a) To analys RAO (Response Amplitude Operator) in patamaran with ballast and without ballast.
b) To design and to analyze the system ballast in Patamaran
3
1.5.
Research Benefits
This final project will be able to give these following benefits.
5
CHAPTER 2
STUDY LITERATURE
2.1
Basic Theory
Energy is a crucial issue for the world community, especially since the oil crisis in the world and ultimately minyakpun prices soared. Under these conditions, the current countries in the world are racing to find and utilize alternative energy sources to maintain the security of the availability of energy resources. as well as Indonesia. Source: Wikipedia 2015 The energy sector is one of the most important sector in Indonesia because it is the basis of all other development. There are many challenges associated with energy, and one of the things that concerned the government is how to extend the electricity grid, particularly by building the infrastructure of power supply to various areas.
The energy of the earth is extremely diverse. Energy is divided into two categories namely renewable energy and non-renewable energy. Renewable energy is not limited in number so that the energy is so nice to be utilized as a source of energy, particularly electricity generation. Ocean currents can be another option to produce energy that is renewable.
2.2
Sea Flow Definition
2.2.1 Factors that cause ocean currents
The currents in the ocean caused by two main factors, namely:
Internal factors, such as differences in density of sea water, horizontal pressure gradient and friction layer of water. External factors such as sun and moon
gravity is affected by the detainee seabed and the Coriolis force, the difference in air pressure, gravity, tectonic, and wind. 2.2.2. Types of Sea Flow
a. Based on the Process of:
Ekman Flows: Flows were affected by wind.
Termohaline Flow: Flow is affected by the density and gravitas.
Tidal current: The current that is influenced by the tide.
Geostrophic currents: currents that are affected by the pressure gradient and the horizontal corolis style.
Wind currents driven current: The current that is affected by the wind and movement patterns occur in the surface layer. b. Based Depth:
Surface currents: Occurs in a few hundred meters from the surface, moving the horizontal direction and is influenced by the distribution pattern of the wind. Flows in: There was deep in peraran
7
wind and brings the mass of water from the polar regions to the equator.
2.3. Understanding Ballast System
Ballastt system is a system used to maintain balance (stability) ship / floaters in case of trim or list (roll), especially during loading and unloading (for boats).In addition ballastt system is used to maintain the balance necessary to charge and discharge of seawater in the tanks ballastt, so as to maintain the center of gravity as low as possible and persevering aboard the vessel position is always under certain conditions. Process water ballastt divided into two ballastting (water filling ballastt) and deballastting (drainage ballastt). Ballastt system components such as the main pipe, branch pipes, valves and fittings, pumps, and tanks ballastt. Source: Wikipedia 2015
There are some calculations performed to obtain the appropriate ballast system, along with the size of the pipe and the pump needs to be used in the system of ballasts in this patamaran. Here are some calculations that cultures do.
2.3.1. Calculation Algorithms
Calculation of volume displacement Calculation of displacement
Calculation capacity ballast pump
Calculation of the diameter of the main ballast pipe
Calculation of ballast pump head
Calculation of installation in the engine room.
Calculation of total head losses
Calculation of pump power (Pw) and motor power (Pm)
2.3.2. input parameters
a. Calculation of volume displacement
Volume displacement can be calculated using the equation:
L x B x T x Cb where:
LWL = length of waterline patamaran B = width patamaran
T = draft patamaran Cb = coefisien block b. Calculation of displacement
▼ x p
Where:
▼ = volume of displacement
Ρ = density of seawater c. Calculation capacity ballast pump
Q = V / t
Where?
V = volume of displacement
9
d. Calculation of the diameter of the main ballast pipe
dH =
Where:
Q = capacity ballast pump v = velocity flow
e. Calculation of ballast pump head - calculation of installation
H = Hs + Hp + Hv + total Head-loss where:
hs = static pump head
hp = head pressure difference hv = head speed difference h1 = head in the suction pipe h2 = head in the discharge pipe v = viscosity
Rn = Reynolds number λ = frictional losses
Q = pump capacity η = pump efficiency
g. Calculation of motor power (Pm) Pw = pump power
η = pump efficiency
2.4. Ballast System Main Components
In a ballast system, there are several components into a system that can run well.Here are some of the ballast system components along with its usefulness.
2.4.1. Ballast pumps
The pump is a component that is used to move water out of the tank or tang ki.The pump used is a type of centrifugal pump with a debit considerations take precedence over headnya. Pump specification will be described in the next chapter. Selection of the pump itself has been mentioned steps.
2.4.2. Ballast tanks
11
2.4.3. Pipe Ballast
Pipe ballast is the entrance of seawater into the tank or out of the tank. For ballast pipe size is as follows:
in which:
D in = f (Q ballast, V stream)
Q = Vol ballast tanks total discharge time tank
Ballast tank volume = 10% - 15% Volume Displacement
Time of discharge = f (time loading and unloading)
V flow = 2 ~ 4 m / s2.4.4. Valve
Valves is a useful tool to disconnect, connect, and change direction gets another of the pipeline system and also to control the flow and pressure of the fluid.Valves are used in Bilga system include:
Elbow 90 valveFigure 2. 1 Elbow 90
Source: http://stocktonvalve.com
FilterFigure 3. 1 filter
13
SDNRVFigure 2. 3 SDNRV Source: http://stocktonvalve.com
Gate valve
connection TFigure 2. 5 Connection T
source: http://stocktonvalve.com
Butterfly valve15
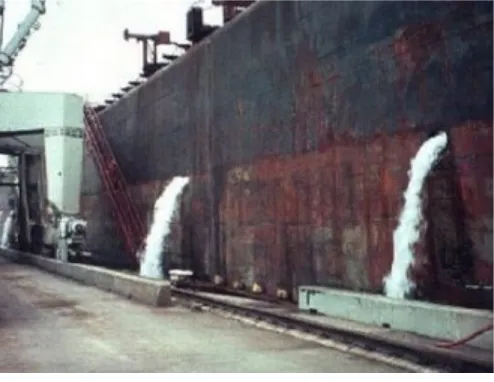
2.4.5. outboard
Outboard function is to remove the water that's already unused.This utboard laying o be above the waterline or WL and should be given a SDNRV type valve. ,Located outboard laying guess about 011 mm above the waterline mark.
Figure 2. 7 Outboard
source: http://www.academia.edu 2.4.6 Seacheast
Figure 2.8 Sea Chest source: http://www.academia.edu 2.4.7. How it Works Ballast System
17
2.5. Ship Stability
The stability of the ship is a vessel's ability to uprise again while the ship at the time floated, not tilted left or right, as well as at the time of sailing, caused by outside influences exerted on it by the time the ship diolengkan by waves or wind, can ship up again.
2.5.1. Types of vessel stability
The stability of the ship can be classified in two types, namely stability vessel stability Transverse and longitudinal stability of the ship.
Transverse stability of the vessel is a vessel's ability to uprise again while the ship slant in the transverse direction caused by external influences acting on it. Longitudinal stability of the ship is a vessel's ability
to uprise again while the ship slant in the longitudinal direction caused by external influences acting on it. 2.5.2. Initial Stability ship
Initial stability is the ability of a vessel to ship it back into its original upright position when the ship slant on small corners (= 60 degrees).In general, initial stability is limited to a discussion on the transverse stability alone. In discussing the initial stability of a ship, then points (crucial point in kapa stability l) determines the size of the initial stability values are:
2.5.2.1. The weight of the vessel (G)
Linggi Linggi front and rear keel kapal.Letak / notch gravity aboard a ship will remain if there is no increase, decrease, or shift the weight on board and will move its place when there are addition, subtraction or shift the weight of the vessel.
If there is additional weight, the center of gravity will move towards the ship / direction and parallel to the point of heavy weights are loaded.
If there is a reduction in weight, the center of gravity of the ship. will move towards the opposite and the center of gravity weight dismantled. If there is a weight shift, then the center of gravity
of a ship will move in the same direction and aligned with the center of gravity of the weight digeserkan.titik this is a point that greatly affects the stability of the ship.
19
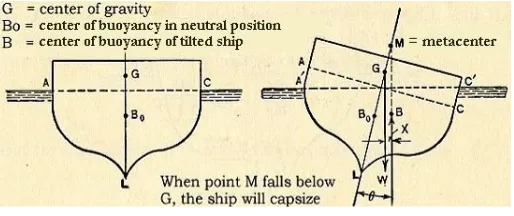
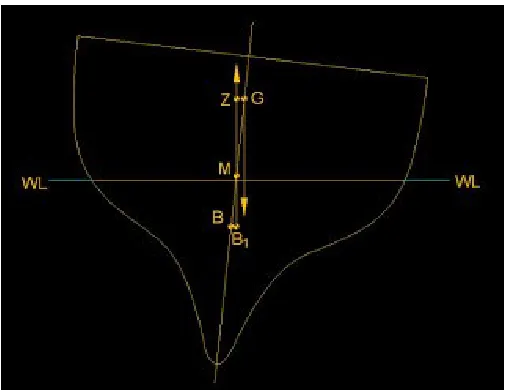
2.5.2.3. Metasentrum point (M)
The stability of the vessel is a vessel which is the point of the arc breaking point swing is the path traversed by a press point kapal.Titik Metasentrum a ship with a small slanting angles perpotomgam lies on the axis line and, toward the line of compression force as the ship slant upward.For angles smaller slanting position Metasentrum held constant, even if the actual kekududkan that point varies according to the direction and magnitude of slanting angle. Therefore, very small changes in the location, it is considered permanent.
Figure 2. 9 Stability notch ship titk weight of the vessel, the vessel floating point, and the point of the ship
metasentrum
source: https://vandiaz89.wordpress.com
a result of menyengetnya vessels will carry due to change-unlike the stability of the ship.
Figure 2. 10 Diagram stability of the ship
21
multiplied by the distance between the gravity ships and force upward pressure vessel stability.
2.5.3. Stability Ship Equipment
There are several devices atu tool in gunkan to keep the ship stbilitas namely fin hull, balancing tanks (ballast the ship), and the fin stabilizer.
Fin hull: fin keel or also known as Bilge keel serve to increase ship transverse friction making it more difficult to reverse and maintain the stability of the ship.Typically used in vessels with hull shape V. Balancing tank is a tank that serves to stabilize the
position of the ship with ballast water flowing from left to right the ship when the ship tilted left and sebalikanya when tilted to right. This tank serves to maintain the stability of the ship.
Fin stabilizer fins on the keel to adjust the position at the time the ship swerved so as to maintain the stability of the ship
Explanation of ballast and stability of the system as described above is a theory that is usually used in the field of shipping, patamaran here to do the same theory as well patamaran ships and ocean current power plant is a floating building.
2.6. RAO (Response Amplitde Operator)
In the field of ship design and other floating structures design, response amplitude operator (RAO) is statistically engineered, or sets of these statistics, which are used to determine the behavior of the possibility of the ship when operating at sea. Known by the acronym of RAO, response amplitude operators are usually obtained from the proposed model of ship design was tested in a model basin, or from special running CFD computer program.
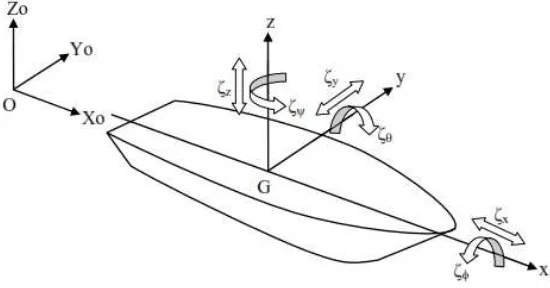
2.6.1 Ship Manouver Theory Causes Wave Excitation
1. Translational motion mode
- Surge, motion transversal direction of the x-axis
- S way, motion direction transverse axis y - Heave, motion transversal direction of the
axis z
2. Rotational motion mode
- Roll, rotational motion direction jest x - Pitch, the rotational direction of the y-axis
motion
- Yaw, rotational motion of the z-axis direction
Definition movement ship in en a m level freedom could be explained by figure 2.2. With using conversion axis hand right three movement translation in direction axis x, y and z, that is surge (Ζ 1), sway (Ζ 2) and heave (ζ 3), while for rotational movement to third axis is roll (Ζ 4), pitch(ζ 5) and yaw(ζ 6).
23
Figure 1. Transasi motion and rotation on a ship 2.7Use of Software maxsurf dongle and MOSES
important factors is to determine the characteristics of the floating structure movement due to environmental burdens that affect him.To know the characteristics of the movement of floating structures, we can use the help of software.One of the software that is often used is produced by Ultramarine MOSES Inc.
25
CHAPTER 3
RESEARCH METHODS
3.1.Metodology
To solve the problem in this research , the method used is approach computational fluid dynamics ( cfd ) .Software used is solid work .The following is a step in construction research carried out.
1.2
Identification The Formulation Problem
Determine beforehand problems will be the analysis consistent with the objectives of doing research.To further focuses on research purposes, hence in formulating identification this problem determined the problem.All written here still in the form of temporary allegation and necessary further study to get results maximum research is done before.
1.3
Literature Study
Literature study was performed by collecting various references to support this final project. The media that will used is :
a. Books; b. Journals;
c. Engineering Report; d. Thesis
1.4 The Collection of Data
The data can be obtained from sources or reference anything to do with the plane of duty end of this .These other sources among others of book , journal , articles , the internet or a piece of writing as duty the end .In this work also take data from meteorology and geophysics ( BMKG ) for data high ocean currents and the period ocean currents.
1.5 Modeling
At this stage, modeling will perform using mautocad to draw the ballast system at patamaran and using Autocad 3D plan for drawing 3D ballast system.
1.6 Running Simulation
After model made and determined variations limitation and that will be given , next phase is to test model .In this research methods used is with the approach of computational fluid dynamics ( CFD ) , then on the model of testing done in three stages pretax pocessor namely, solver post processor and .After three of the process is done, whether next results obtained could be accepted or not based on the data generated compared with the conditions should be .If the results can be accepted by, then the next process can be done .If the result is unacceptable, then the next process not be continued and steps should be taken is find and fix errors ranging from the manufacture of model.
1.7 Data Analysis
27
get answers from existing problems consistent with the objectives of doing research.
1.8 Conclusion & Reporting
1.9 METHODOLOGY FLOW CHART
29
CHAPTER 4
DATA ANALYSIS AND DISCUSSION
4. 1. Mooring System4.1.1. Determining of Location
Ballast system on pattamaran that located on Nusa Penida will be analyzed on this research. Nusa Penida located on Klungkung District on Bali Province. Klungkung area is one of the seceond smallest district after Denpasar City by the large of area are 315 km2 or 5,99% of the total area on Bali. Toyopakeh Strait located
besides on Nusa Penida, Nusa Peningan and Nusa Lembongan which have 6 km long and have 1,5 km wide of starit on East area, 700 meters on the middle and 1 km on Southwest. Morphology on Toyopakeh Strait are relatively steep. Detail of area are describing on picture (4.1.1.)
Picture 4.1.1. Current Power Plant Location Project on Toyopakeh Strait, Nusa Penida Island, Bali
have temperature on 14oC-31oC ranges. The types of coral reefs are
fringing reef that spread of Nusa Penida, Nusa Ceningan and Nusa Lembongan by 1.419 Ha area (CTC, 2010).
4.1.2. Determining Platform Installation Coordinat Position
By the current location on Google Earth, determination coordinates are on the table (4.1.2.) below.
4.1.2. Platform Coordinates Installation of Current Power Plant (PLTA) Project
Location South East
Platform PLTA 8o40`25.68”S 115o29`15.70”E
Picture 4.1.2. Platform Installation Location 4.1.3. Environmental Data
On ballast system analysis, external force are the main factor data as one of requirement that called Metaocean Data (Meteorology and Oceanography) are on list below.
a. The wind speed at a reference elevation b. The significant wave height
31
d. Current velocity at an elevation of reference e. The map bathymetric operating locations 4.1.3.1. The Wind Speed Data
Wind speed obtained from BMKG data as a value of wind speed in knots and direction are calculated every hour for 12 years, ie from 2004 to 2015. The position coordinate data collection is located in the waters of Nusa Penida in the strait Toyopakeh, ie 8 ° 63'79.70 "S and 115 ° 49'91.47" east of the north island of Nusa Penida, as well as 8 ° 72'84.30 "S and 115 ° 42'83.54 "BT's south island of Nusa Penida.
Based on wind speed data analysis, the conclusion are on below. a. The most dominant wind direction is northwest by the
frequency of occurrence of 40%
Picture 4.1.3.1. Windrose diagram of wind speed on Toyopakeh Starit on 2004-2005
Picture 4.1.3.2. Windrose on Platfor Location 4.1.3.2. The significant wave height
33
of the fetch on location point. After calculate the growth of wave, then the results are on table 4.1.3.2. below.
Table. 4.1.3.2. The significant wave height on wind direction Wind
Direction
The significant wave height (m)
The significant wave periode (s)
West 0.7 3.77
Northwest 1.08 4.85
East 1.45 5.93
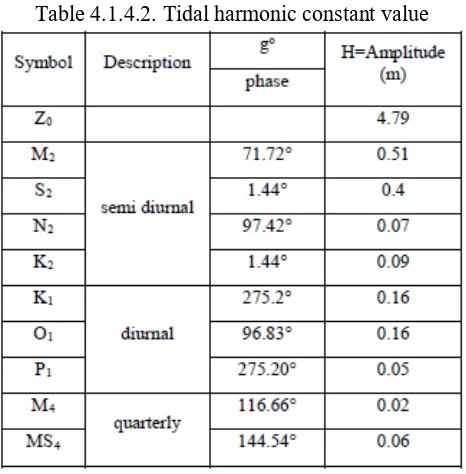
4.1.3.3. Tidal Data
Tidal data observed based on elevation calculation on water survace every 1 hour for 30 days. Tidal data results are on the table 4.1.4.1. below.
Table 4.1.4.1. Tidal data calculation for 30 days
Table 4.1.4.2. Tidal harmonic constant value
35
Table. 4.1.4.3. The results of the tides data The types of tides
Height Level Difference (Meters)
MSL (Mean Sea Level) 4,79 m (dari lwl)
HAT (High Astronomical Tide) 6,02 m (dari lwl) LAT (Low Astronomical Tide) 3,55 m (dari lwl) MHHWS (Mean Highest High Water
Spring)
5,69 m (dari lwl) MHHWN (Mean Highest High Water
Normal)
4,9 m (dari lwl)
MLLWN (Mean Lowest Low Water Normal)
4,67 m (dari lwl)
MLLWS (Mean Lowest Low Water Spring)
3,87 m (dari lwl)
4.1.3.4. Current Velocity Data
Current velocity observerved by measurement on two different points and conducted on August, 12nd until September 8th 2015.
a. Maximum current velocity is 2,4 m/s on 5.5 meters deep on two location.
b. Average current speed have ranges 0,2-0,7 m/s
Picture 4.1.3.3. current rose on platfor location 4.1.3.5. Environment Data on Maximum Condition
Based on measurements of metaocean data, maximum of significant wave height and wind speed, here are the conclusion rusults of environment on maximum condition.
Table 4.1.4.4. Maximum value of Metaocean data Significant
Wave Height Wind speed Current Water Depth
1.45 m 22 knot 2.4 m/s 30 m
4.1.3.6. The map bathymetric operating locations
37
anchor is placed. Here is a bathymetric map locations PLTAL operation, namely Strait Toyokapeh:
Picture 4.1.6.1. Bathymetric maps on Toyokapeh Strait
4.2. Structure Design 4.2.1. Structure Data
Main dimension of hull platform are on below. Length Between Perpendicular (LPP) = 20 m
Lebar (B) = 1,25 m
Depth (H) = 2 m
Draught (T) = 1,25 m
Coefficient Block (Cb) = 0,125
Main dimension of stager platform are on below. Length Between Perpendicular (LPP) = 8 m
Lebar (B) = 0,85 m
Depth (H) = 1,28 m
Draught (T) = 0,28 m
39
4.2.1.1. Structure Calculation Results
NO ITEM
MAIN HULL
17 6.00 mm
152.00 mm
18 6.50 mm
117.00 mm
19 6.50 mm
117.00 mm
20 6.50 mm
84.00 mm
21 6.50 mm
84.00 mm
22 6.50 mm
84.00 mm
23 7.00 mm
80.00 mm
24 6.50 mm
80.00 mm
25 6.50 mm
152.00 mm
26 7.00 mm
177.00 mm
27 6.50 mm
177.00 mm
28 6.50 mm
139.00 mm
29 8.00 mm
222.00 mm
30 6.50 mm
152.00 mm
31 6.50 mm
152.00 mm
32 7.00 mm
178.00 mm
33 6.50 mm
139.00 mm
34 6.50 mm
139.00 mm Bracket Superstructure
35 6.50 mm
80.00 mm
36 6.50 mm
139.00 mm
37 6.50 mm
152.00 mm
38 6.50 mm
84.00 mm
39 tebal sekat 6 mm 6.00 mm 6.00 mm
Penegar Sekat
40 Frame 8 4.77 cm3 5 cm3
41 Frame 16 9.54 cm3 10 cm3
42 Frame 24 9.54 cm3 10.0 cm3
43 Frame 32 4.77 cm3 5.0 cm3
0 ≤ x/L < 0.2 [ A ] 0,2 ≤ x/L < 0.7 [ M ] 0,7 ≤ x/L < 1 [ F ]
Bracket untuk web frame 2 dengan strong beam
Bracket untuk gading biasa 1 dengan gading biasa 2 Bracket untuk gading biasa 1 dengan balok deck
Bracket untuk deck dengan gading biasa 2
Bracket untuk gading biasa 1 balok geladak
Bracket untuk main deck dengan gading biasa main deck Bracket untuk gading biasa main deck dengan balok main deck
Bracket untuk web frame 1 dan web frame 2
Bracket untuk web frame 1 dengan strong beam
Bracket untuk web frame 2 dengan strong beam
Bracket untuk main deck dengan frame
Bracket untuk frame dengan balok main deck
Bracket untuk frame 1 dan frame 2 fore peak
Bracket untuk web frame 1 dan web frame 2
Bracket untuk frame 1 dan balok geladak
Bracket untuk web frame 1 dan balok geladak besar Bracket untuk web frame 1 dan balok geladak besar main deck Bracket untuk frame dan balok geladak main deck Bracket untuk web frame 1 dan web frame 2
Bracket untuk web frame 1 dan strong beam
Bracket untuk web frame 2 dan strong beam
Bracket untuk strong beam dengan web frame 1
l 50 x 5 I 65 X 6
l 60 x 8 l 60 x 8
41
Table 2.7. Calculation of stager platform PLTA
4.2.1.2 General arrangement of The Structure
Picture 2.8. Front View PLTA structure scale 1:200 NO ITEM
STAGER
Pelat lunas Lebar 838.80 mm 1000 mm 838.80 mm 1000 mm 838.80 mm 1000 mm Tebal 6.00 mm 6.0 mm 6.00 mm 6.0 mm 6.00 mm 6.0 mm 2 Pelat Alas 4.00 mm 4.0 mm 4.00 mm 4.0 mm 4.00 mm 4.0 mm Pelat Bilga 838.8 mm 1000 mm 838.8 mm 1000 mm 838.8 mm 1000 mm 4.00 mm 4.0 mm 4.00 mm 4.0 mm 4.00 mm 4.0 mm Pelat sisi 839 mm 1000 mm 839 mm 1000 mm 839 mm 839 mm 4.00 mm 4.0 mm 4.00 mm 4.0 mm 4.00 mm 4.0 mm Pelat lajur 839 mm 1000 mm 839 mm 1000 mm 839 mm 1000 mm 4.48 mm 5 mm 4.48 mm 5 mm 4.48 mm 5 mm 6 Pelat Geladak 5.00 mm 8.0 mm 5.00 mm 8 mm 5.00 mm 5.0 mm
Gading biasa 0.31 cm3 6.0
cm3 0.32
cm3 6.00
cm3 0.17
cm3 5.00
cm3
I 50 x 6 I 50 x 6 I 50 x 6 I 50 x 6 I 50 x 6 I 50 x 6
Gading Besar 6.11 cm3 9 cm3 6.13 cm3 9.00 cm3 6.11 cm3 9 cm3
I 65 x 6 I 65 x 6 I 65 x 6 I 65 x 6 I 65 x 6 I 65 x 6
Balok geladak Deck 0.03 cm3 6
cm3 0.02
cm3 6.00
cm3 0.02
cm3 6.00
cm3
I 50 x 6 I 50 x 6 I 50 x 6 I 50 x 6 I 50 x 6 I 50 x 6
Penumpu Tengah geladak 2.45 cm3 9 cm3 2.45 cm3 9 cm3 2.45 cm3 9 cm3
I 65 x 6 I 65 x 6 I 65 x 6 I 65 x 6 I 65 x 6 I 65 x 6
Center Girder 7.60 mm 8 mm 8.00 mm 8 mm 8.00 mm 8.00 mm 388.25 mm 400 mm 388.25 mm 400.00 mm 388.25 mm 400.00 mm Bracket untuk frame 1 dan balok geladak 4.00 mm
80.00 mm Penegar sekat 5.00
l 50 x 5
13 Wrang 6.00 mm 12 7 8 9 10 11 1 3 4 5
Picture 2.9. Top View PLTA Structure Scale 1:200
43
4.2.1.3 Platform Lines Plan
Picture 2.11. Body plan scale 1:200
Picture 2.12. Sheer Plan scale 1:200
4.2.1.4. Bulkhead Structure
Picture 2.14. Bulkhead PLTA structure scale 1:200 4.2.1.5 Midship Structure
45
4.2.1.6 Structure Profile Construction
Picture 2.16. Top View Construction Scale 1:200
Picture 2.18. Cutting Construction Profile 2000mm form centerline scale 1:200
47
4. 2. Hasil Permodelan dan Analisa Struktur Plta
4.2.1. Permodelan struktur dengan menggunakan Maxsurf dan Moses
PLTA Structure that has been planned in accordance with the original structure modeled using software maxsurf dongle. All the structural components such as the main hull, triger, blade, and others modeled in detail in maxsurf dongle. From this maxsurf dongle that can be achieved hydrostatic components of the structure and validated by the results of numerical analysis of whether it is appropriate or not. If the validation meets the model can be used for further analysis such as the analysis of stability until tension mooring analysis used.
Picture 4.3.2 Maxsurf Modelling on Platform Side View Structure
49
use the method of meshing (model di analyzed by finite element so that the model can be analyzed in high accuracy) or by the method of strip. Model retrieved the marker using the meshing method for more detailed results of which are modeled here hull structure.
Picture 4.3.5 Structure Model Results on Moses Software Isometri View
Picture 4.3.7 Moses Model Structure on Side View
Picture 4.3.8. Moses Model Structur Front View 4.4. Results Analysis The Movements of The Structure
By Moses Software, Response of Amplitude Operator for the platform are on below:
51
Picture 4.4.2. RAO for translation sway movements on structure of PLTA on free floating condition
Picture 4.4.4. RAO for rotational roll movements on structure of PLTA on free floating condition
53
Picture 4.4.6. RAO for rotational yaw movements on structure of PLTA on free floating condition
4.5. Data
Requirements data on this final project are on list below. 1. Displacement Volume of patamaran
4.5.1. Draught Variation and Displacement Data
Draft Amidships m 0.750 1.000 1.250 1.500 1.750
Displacement kg 31818 44562 58497 72672 88345
Heel deg 0.0 0.0 0.0 0.0 0.0
Draft at FP m 0.750 1.000 1.250 1.500 1.750
Draft at AP m 0.750 1.000 1.250 1.500 1.750
Draft at LCF m 0.750 1.000 1.250 1.500 1.750
Trim (+ve by stern) m 0.000 0.000 0.000 0.000 0.000
WL Length m 18.200 19.100 20.000 20.000 17.006
Beam max extents on WL m
13.699 14.450 14.450 14.450 10.650
Wetted Area m^2 97.526 129.014 156.725 192.498 310.453
Waterpl. Area m^2 44.571 54.205 54.430 59.245 21.280
Prismatic coeff. (Cp) 0.906 0.826 0.750 0.722 0.817
Block coeff. (Cb) 0.056 0.063 0.072 0.082 0.147
Max Sect. area coeff. (Cm)
0.183 0.191 0.155 0.174 0.783
Waterpl. area coeff. (Cwp)
0.179 0.196 0.188 0.205 0.117
LCB from zero pt. (+ve fwd) m
55
LCF from zero pt. (+ve fwd) m
0.000 0.000 0.000 -0.010 0.000
KB m 0.382 0.524 0.667 0.806 0.951
KG m 1.250 1.250 1.250 1.250 1.250
BMt m 10.044 16.775 12.793 11.113 2.156
BML m 35.622 27.470 21.297 17.449 1.654
GMt m 9.176 16.049 12.210 10.668 1.857
GML m 34.754 26.744 20.714 17.004 1.356
KMt m 10.426 17.299 13.460 11.918 3.107
KML m 36.004 27.994 21.964 18.254 2.606
Immersion (TPc) tonne/cm
0.457 0.556 0.558 0.607 0.218
MTc tonne.m 0.553 0.596 0.606 0.618 0.060
RM at 1deg = GMt.Disp.sin(1) kg.m 5095.54 7 12481.41 8 12465.42 3 13530.3 73 2863.123
Max deck inclination deg
0.0000 0.0000 0.0000 0.0000 0.0000
Trim angle (+ve by stern) deg
4.6. Ballast Water Minimum Requirement on Several Draught.
Draft (m) Air Ballast (kg)
0.75 12727
1.00 17825
1.25 23399
1.50 29069
1.75 35338
4.6.1 Draft 0.75 m
Analysis from moses software, RAO for the patamaran will show with this chart:
57
Picture 4.6.1.2. RAO for rotational sway movements on structure of PLTA on free floating condition
Picture 4.6.1.4. RAO for rotational roll movements on structure of PLTA on free floating condition
59
Picture 4.6.1.6. RAO for rotational yaw movements on structure of PLTA on free floating condition
4.6.2 Draft 1.00 m
Picture 4.6.2.1. RAO for rotational surge movements on structure of PLTA on free floating condition
61
Picture 4.6.2.3. RAO for rotational heave movements on structure of PLTA on free floating condition
Picture 4.6.2.5. RAO for rotational pitch movements on structure of PLTA on free floating condition
63
4.4.3 Draft 1.25
Picture 4.6.3.1. RAO for rotational surge movements on structure of PLTA on free floating condition
Picture 4.6.3.3. RAO for rotational Heave movements on structure of PLTA on free floating condition
65
Picture 4.6.3.5. RAO for rotational pitch movements on structure of PLTA on free floating condition
4.6.4 Draft 1.50 m
Picture 4.6.4.1. RAO for rotational surge movements on structure of PLTA on free floating condition
67
Picture 4.6.4.3. RAO for rotational heave movements on structure of PLTA on free floating condition
Picture 4.6.4.5. RAO for rotational pitch movements on structure of PLTA on free floating condition
69
4.6.5 Draft 1.75
Picture 4.6.5.1. RAO for rotational surge movements on structure of PLTA on free floating condition
Picture 4.6.5.3. RAO for rotational heave movements on structure of PLTA on free floating condition
71
Picture 4.6.5.5. RAO for rotational pitch movements on structure of PLTA on free floating condition
4.7. Perbandingan Pitching pada setiap Draft
Picture 4.7.1. RAO for rotational surge movements on structure of PLTA in 0.75 m
73
Picture 4.7.3. RAO for rotational surge movements on structure of PLTA in 1.25 m
Picture 4.7.5. RAO for rotational surge movements on structure of PLTA in 1.75 m
4.8. Response untuk pitching pada setiap Sudut
75
Dari grafik diatas dapat diketahui secara lebih spesifik bahwa pada sudut 0 derajat, dengan berbagai macam syarat air. Diketahui pada syarat 0.75 rao cenderung naik pada frekuensi yang telah ditentukan. Pada sarat air 1.00 m tepatnya saat frekuensi 1.3 terdapat kenaikan rao sampai mencapai 35. Pada sarat air 1.75 respon cenderung rendah dan konstan.
Picture 4.8.2. RAO for rotational surge movements on structure of PLTA in 45 degre
Picture 4.8.3. RAO for rotational surge movements on structure of PLTA in 90 degre
Dari grafik diatas dapat kita ketahui bahwa rao paling tinggi berada pada sarat 1.00 dan paling rendah pada kondisi sarat 1.25m
77
4.9. Calculation of Volume Displacement
Weight ballast which must be carried by the ship displacement weight of the vessel. Thus the need is calculated displacement weight of the vessel.Heavy displacement boats have been known which is 44.93 tons, with the following explanation:
W ballast = x 15% = 44.9 x 15 % = 6.74 ton which:
Wballast = weight ballast = weight displacement
Once known ballast weight, then calculate the volume by multiplying the weight ballast ballast to the future of sea water, following :
Vballast = Wballast/ p air laut = 44.93/ 1.025 = 6.58 m3
4.8.1 Calculation and Selection of Pumps
Selection of pump is influenced by the volume of fluid to be moved, the static head,pressure head,velocity head, and total head loss.Steps in the pump selection is as follows:
a. Calculating the capacity of the pump
Pump capacity can be calculated using the following equation:
79
Where?
Q = pump capacity (m / sec) V = volume of ballast (m3)
t = time needed to fill or empty the tank (dt) t takes 0.5 hours
so we get:
Q = 13.150 m3/h
= 0.004 m3/s
= 3.66 liter/s
b. Calculate the diameter of the pipe
Diameter pipe can be calculated using the following equation:
D² = Q / (1/4 x π x vb ) = 0.001551102 m D = 0.0393
= 39.38 mm
in which:
Vb = estimate fluid velocity
= 3 m/s
Selection is based on standard ASME pipe B36.10M / 19m-2004, to the appropriate dimensions are:
Outside diameter = 48 mm Pipe size = 40
Schedule Number = 40
c. Calculating pump head 1.Head Static
Head static defined as the difference in height between suction and discharge.The amount of static head is:
Hs = T+ 0.75 = 8.8 + 0.75 = 9.55 m 2. Head Pressure
Head pressure is defined as the difference in pressure (pressure) on the suction and discharge side.Because of the pressure on the discharge and suction sides are equal, so:
Hp = 0 m 3.Head Velocity
Head velocity is defined as the difference in speed (velocity) on suction and discharge side.Because the speed of the discharge and suction sides are equal, so:
Hv = 0 m 4.Head Loss
81
major and minor head loss in the suction and discharge side.
5. Head in the suction pipe
n = kinematic viscocity n = 0.000000894 m2/s dH = diameter dalam
= 40.94 inchi = 1.039876 m
Rn = (v*dH)/n
= (3*0.9738)/ 0.000000849 = 344098.9
Major losses (hf)
Hf = l * L * v2 / (D * 2g) in which:
L = length of suction = 2m
Hf = l*L*v2/(D*2g)
= 0.025 x 2 x (3^2) / (0.09738 x 2 x 9.8) = 0.24 m
Minor Losses (hl)
From the above table are used to determine the amount of head loss is minor, with the formula: ℎ𝑙 = (∑ 𝑛 𝑥 𝑘) 𝑥 𝑣2𝑔 2
= 18.6 𝑥 32
2 𝑥 9.8 = 3.421 m
No Types n k nxk
1 Elbow 90o 1 0.57 0.57
2 T-join 2 1.14 2.28
3 Filter 1 1.5 1.5
4 Butterfly valve 14 0.86 12.04
5 Gate valve 7 0.15 1.05
6 SDRNV 1 1.23 1.23
83
- Calculating the total head loss in the suction side hl = head loss major + head loss minor
= 15.41 m a. Head loss on the discharge side
Head loss is affected by the minor accessories contained in the pipe at the discharge. Here's a table showing the number and value of each pipe accessories
No Types n k nxk
1 Elbow 90o 2 0.57 1.14
2 T-join 4 1.14 4.56
3 Filter 1
4 Butterfly valve 14 0.86 12.04
5 Gate v/v 7 0.2 1.4
6 SDRNV 1 1.23 1.23
total 20.37
From the above table are used to determine the amount of head loss is minor, with the formula:
ℎ𝑙 = (∑ 𝑛 𝑥 𝑘) 𝑥 𝑣2𝑔 2 =
b. Calculating the total head of the suction and discharge line H = Hs + Hp + Hv + Pw head loss ( suction +
discharge) = 20.188
c. Select and determine the specifications of pumps
Based on the above calculation, the selected pipe ballast with the following specifications:
Head : 20.18 m
Capacity : 13.150 m3/hr
Merk : JD 3
85
CHAPTER 5
CONCLUSION
4.1
Conclusion
After working on this thesis can be concluded as follows: 1. Utilization ballast system in the development of
pontoons patamaran very useful, it is because with the addition of ballast water, using the motion response RAO (Response Amplitude Operator) can be reduced in accordance with existing graphics.
2. Utilization of ballast on patamaran have different results on each motion of the ship.For pitching motion can be seen from the graph that the most optimum conditions exist in water laden 1:25 am and most extreme on the water laden 1:00 am.
3. Utilization of the ballast system on the pontoon patamaran using a system that is supported by a pump which pumps capasitas require approximately 13 150 m 3 / hr.
4.2
Recommendation
Recommendation that can be given by the author for further research are :
1. The result of this final project can be used as a reference to the detail design of mechanical transmission system such as gearbox system.
2. Calculation and simulation of vibration that occur need to be done, in order to get the efficiency and more accurate.
87
REFERENCES
[1] Firmanda, Dimas, 2008, Studi Experimental Sistem Pembangkit Listrik Hibrida PV-WIND off grid skala kecil, Teknik Fisika-FTI-ITS : Surabaya
[2] Asosiasi Energi Laut Indonesia. 2012. Energi Gelombang Laut. Diambil dari http://aseli.co. Terakhir diakses tanggal 18 Mei 2015.
[3] Kamus Q - Pengertian dan Definisi. 2012. Energi. Diambil dari http://www.kamusq.com. Terakhir diakses tanggal 18 Mei 2015.
[4] Hanin, Wildan,2008, Perancangan Turbin Angin sebagai Bagian Dari Sistem Pembangkit Listrik Di Kapal, Sistem Perkapalan-FTK-ITS : Surabaya
[5] M. Matsumura, Utilization of Solar Cell, Lecture Notes Research Center for Solar Energy Chemistry, Osaka University 2009
[6] Ula, Musfirotul, 2014, Perancangan Konstruksi Turbin Angin Diatas Hybrid Energi Gelombang Laut, Sistem Perkapalan-FTK-ITS : Surabaya
[7] Prasetyo Endro, Candra, 2014, Perancangan Kapal Penumpang Tenaga Surya Untuk Penyeberangan Sungai Bengawan Solo, Sistem Perkapalan-FTK-ITS : Surabaya [8] Nafis, Mohammad Idrul, 2013, Analisa Perbandingan
[9] Hermawan, 2014, Analisa Pengaruh Sudut Kemiringan Panel Surya Terhadap Radiasi Matahari yang Diterima Oleh Panel Surya Tipe Array Tetap, Teknik Elektro-Undip : Semarang.
[10] Yohana, Eflita, 2014, Uji Eksperimental Pengaruh Sudut Kemiringan Modul Surya 50 Watt Peak Dengan Posisi Mengikuti Arah Pergerkan Matahari, Teknik Mesin-Undip : Semarang.
89
The author, Lenny Rahmawati was born in Kediri, 20 December 1994, the autror is the first child of two in his family and taken formal education at Blimbing 1 Primary School, Grogol 1 Junior High School, Kediri 1 Senior High School. The author was graduater from Kediri 1 in 2013, then continuing to bachelor degree and accepted at Institut Teknologi Sepuluh Nopember, Faculty of Merine Technology in Departement Marine Engineering. The author registered with student number 4213 100 033 in Department of Marine Engineering.
91
Spesifikasi Pompa dan acsesorisnya
1. Spesifikasi Pipa yang Dipakai
95
99