Electoral Systems Using Quick Count Methods With Stratified Sampling
Calculations
Joko Sutopo, Muhammad Septiyanto
Informatics Engineering Program, Faculty of Information Technology and Electrical University of Technology Yogyakarta
Jl. North Ringroad Jombor Sleman Yogyakarta
E-mail : [email protected]
ABSTRACT
Elections are a step of democracy in a nation, where every citizen is obliged to succeed the
activity. Voter participation is a benchmark for success in a good election to elect a head of
state or legislature. Kerbehasilan election seen on how much public participation related to
the results of voting obtained from the collection. This research attempts to give an idea of
the result of the vote counting process. This research uses quick count method to show a
quick calculation result by taking some sample data of 2nd round of election result in election
in DKI Jakarta as test data for application of calculation. Sample calculation with stratified
sampling is a calculation to determine how much data is taken from a population. The results
obtained from the research is the result of quick count calculation with percentage form with
the calculation of data sample using stratified sampling or layer.
Keywords -
System, Election, Quick Count, Stratified Sampling
.
I. PENDAHULUAN
Elections (elections) are an important part of the democratic process to determine a decision that is acceptable to everyone [1]. Every individual has the freedom to express himself through general elections, in accordance with applicable law rules [2]. Elections are needed for a democratic country because with elections the people can decide the choice to whom they will be led. Elections in Indonesia are held every 5 years for the president and members of the legislature. Election is also one of the requirements for the realization of democracy in the country of Indonesia.
In Law Number 8 of 2012 Article 1 Paragraph (1) referred to as General Election is a means of implementing the sovereignty of the people within the Unitary State of the Republic of Indonesia (NKRI) based on Pancasila and the 1945 Constitution of the Republic of Indonesia [3]
Paper-based voting that has been running, has several weaknesses, including inaccuracy in vote counting and the announcement of pending election results [4]. Elections in
Indonesia embrace a democratic system in which every people who already have ID cards (Identity Card) are entitled to vote so that if there is fraud in the calculation is very detrimental to the people. People in Indonesia also have to wait long to know the results of the election so that there is always a suspicion of cheating.
Quick count system aims to keep the principles of the election is JURDIL (Honest and Fair) and must be LUBER (Direct Free and Confidential). Election is a media that should be a medium of information, education and mobilization provoked public cynicism and hampered democracy [6]. Quick count itself still has a weakness in the calculation because it still has a fairly high erorr level ± 1 range.
In a quick count system research there should be data on TPS (Place of Voting). Data for this system is taken from the site http:// kpu.go.id this site provides real count data, so that can be taken some data to be used as sample calculation.
The perceived benefit if the system is created is that the people can know the results more quickly so that no suspicion arises in the counting of their votes.
Quick count method will be made using stratified sampling calculation and slovin formula. The calculation is to determine how many samples we need so we can conclude and see what level of our confidence to retrieve data because more and more data erorr rate will be smaller.
II. TINJAUAN PUSTAKA
Quick count method is very familiar in the field of statistics because many who have studied it so it is easy to find the following references that become the basis of reference for the manufacture of this system.
Previous research using Model Poll Site E-Voting. The study discusses how the Poll Site E-Voting model, the community still goes to the polls, using ID cards with NIK (Population Identity Number) as a means of verification and voting in the provided voting booth. The system automatically stores the selected results in the database, and after the specified time will display the results of the voting and other information required by the KPU [7].
Subsequent research makes a Pilkada Information System with SMS Gateway Subject. In this study described the implementation of sms gateway on the monitoring of votes acquisition and field findings during the election of regional heads took place. Methods of data collection using the method of observation and method documentation. System development in this research using waterfall modification or linear sequential model. This method uses a
systematic approach and the order from the level of system requirements to the stage of analysis, design, coding, testing, and maintenance. In this system also has advantages where there is sms gateway feature that is used to improve supervision function on election result [8].
Another study makes a Geographic Information System Design of Legislative Candidate Spread. The system is expected to assist some parties in facing legislative elections. For legislative candidates and successful teams, the system will help strategize to raise the level of elektabilitasnya. In addition to the candidates, for the party where the candidate is shelter can be used as a prediction model level of influence of his party in general. The purpose of this study is to provide a document design system to map the distribution of legislative candidates, and determine the appropriate technology for the implementation of the system. The method used is spatial analyst aims to operate spatial data, and attribute analyst aims to processing attribute data, ie data unrelated to space [9].
This time the research made a Quick Count System Application (Si-Q-CUP) Election of Regional Head Election Study Case Election of DIY Province (Daerah Istimewa Yogyakarta). This system is made with the intention of minimizing fraud in the election vote calculations located in the area of Yogyakarta with the TPS data as the sample. Researchers solve the problem by using a sms gateway-based system and display it in web applications [10].
The explanation of several studies can be drawn conclusions for the use of quick count method in the election in which this method aims to show the results of voting or election directly and quickly with a small error rate. This quick count method can reduce fraud in the calculation at the polling station (Voting Place).
Stratified Sampling is a principle of sampling in every stratum or layer in which the layer represents from some population so that this method can draw a conclusion from the population [11].
be sampled in the hope that the number of samples taken can represent existing poopulasi. The equation for determining the sample size using the slovin-like formula (equation 1).
n
=
N
1
+(
N e
2)
(1)Keterangan: n = Sampel N = Population
e = Confidence Interval (usually 1%, 5%, 10%)
Propotional Allocation an allocation in which each layer depends on the number of units in the layer. Understanding many sampling units, will be taken more samples, compared to a small layer (based on the number of sampling units). Propositional or comparable allocations are generally used when the average strata with each other differ greatly in this allocation, then nhis defined as (equation 2) [11].
n
h=
N
hN
n
(2)Information:
Nh=¿ the number of units in the h layer. N = the number of units in all layers.
nh = the number of samples in the h layer (taken from the unit).
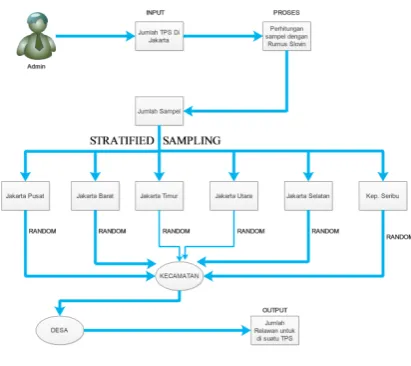
n = the number of samples in all layers. The system is used by two users ie admin and user. Admin duty to check the entire data and input the number of TPS in Jakarta. In inputting the number of TPS there is data processing to determine how many volunteers or witnesses report the voting results in TPS. An overview of the flow on the admin (Figure 1).
Figure 1. Admin Use Flow
User is a volunteer or witness for the calculation of the vote of TPS that has been determined by the admin. The user is in charge of inputting the voting result in the polling station that he or she supervises so that there will be a conversion process to be a percentage of the vote with the probability formula that results from the quick count. Here's an overview of its use. The following user usage flow such as (Figure 2).
Figure 2. User Usage Flow
III. HASIL DAN PEMBAHASAN
At this stage will describe the algorithm or steps taken for the implementation of quick count method with stratified sampling calculation. The first thing to do is to determine the total sample of TPS in DKI Jakarta and the writer get about 13034 which the data is included into the formula with the following conditions:
Question:
N=13034
e= 1 %, 5 %, 10 %.
Asked:
What is the total of n or samples required?
Answered:
n
=
N
1
+(
N e
2)
(3)
n
=
13 03 4
The following (Table 1) shows the calculation with the slovin formula of the number of TPS (equation 3).
Table 1. Slovin Formulas Results Jumlah
Sampel 1% 5% 10%
13023 5658,59165 388,089921 99,2386173
In (Table 1) it can be concluded that: If e = 1% then the sample tps needed 5659. If e = 5% then the sample tps needed 388. If e = 10% then the sample tps required 99.
The second step determines which TPS will be the research sample. First look for the number of TPS located in the Province of DKI Jakarta and the data that is launched from the site https://data.kpu.go.id/ [12].
Table 2.
TPS data of DKI Jakarta
No Regency / City Total of TPS1 Jakarta Barat 2935 2 Jakarta Pusat 1238 3 Jakarta Selatan 2974 4 Jakarta Timur 3698 5 Jakarta Utara 2150 6 Kepulauan Seribu 39 Sum of TPS 13034
In the data (Table 2) shows the data of the number of TPS located in DKI Jakarta which will be made into TPS samples. The stratified sampling calculation function will be used to calculate how many samples are needed from the Slovin formula. Here's the stratified sampling calculation:
Table 3. Calculation of Stratified Sampling
SampleRegency / City
e=1%, n=5659
e=5%, n=388
e=10%, n=99
Jakarta Barat
1274 87 22
Jakarta Pusat
537 37 9
Jakarta Selatan
1291 89 23
Jakarta Timur
1606 110 28
Jakarta Utara
934 64 16
Kep. Seribu
17 1 1
In (Table 3) is the result of calculating the number of tps samples required in each district in Jakarta. The result (Table 3) is the result of rounding which results should be a fractional number, but in determining the sample we need the original number.
The following flowchart or algorithm in the admin account program is already in the settings in the database so no need to create. In (Figure 3) shows that the user must first register to login.
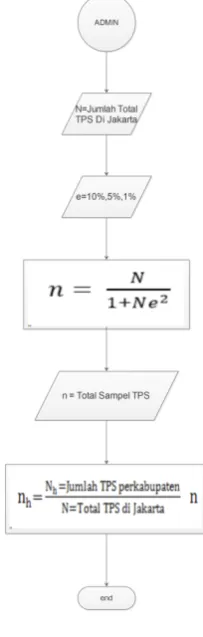
Figure 3. Beginning Flowchart of the Program Flowchart for an Admin is in (Figure 4) where it will input the number of populations or samples of TPS to be calculated then the system will calculate and exit how many TPS should be sampled and its flowchart.
Figure 4. Flowchart Admin
Flowchart for the user is found in (Figure 5) where the user inputs the number of votes of polling stations specified by the admin and the system will convert into the following percentage form the flowchart for the user.
The depiction of the context diagram itself is in (Figure 6). explain the flow of data flowing from user and admin in the form of input and outputan. Data leading to the system is an input while the data that leads to the user is outputan given from the system. Visitors can view the results of quick count
Gambar 6.Diagram Konteks
The drawing of the table relation itself is found in (Figure 7). The relation linked between the registrant table and the provincial, district, sub-district, and village tables table. Relation between sample tables with kosur_gub table and paslon_gub table with kosur_gub table and district table with _kosur_gub.
Gambar 7. Relasi Tabel
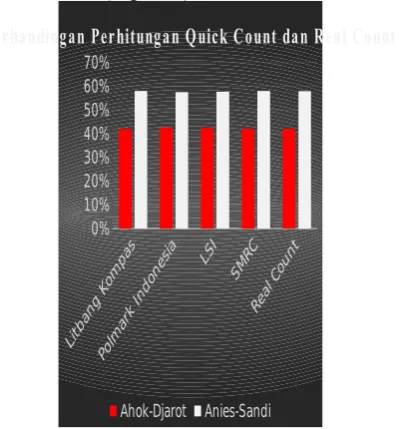
Here is the percentage comparison of vote counting from 4 institutions using quick count method with real count results. The following Institutions in Indonesia that calculate the acquisition of votes using quick count methods such as R & D Kompas, Polmark Indonesia, LSI (Lembaga Survei Indonesia), and SMRC (Saiful Munjani Research and Consulting) [13]. The following sound count results using the quick count method of the 4 Institutions mentioned in (Figure 8).
Gambar 8. Hasil Perhitungan Quick Count
IV. PENUTUP
Pada Pembahasan dapat ditarik kesimpulan:
a. Metode quick count bisa menjadi solusi untuk permasalahan perhitungan suara walaupun masih memiliki tingkat erorr sekitar 1%.
b. Perhitungan menggunakan stratified sampling bisa menentukan berapa jumlah sampel data TPS yang akan diambil sehingga dengan data yang ada bisa menentukan kemenangan sebuah pasangan calon.
c. Pada total TPS yang berada di DKI Jakarta berjumlah 13034 dapat diambil untuk menjadi sampel quick count paling banyak 48% dan itu sudah bisa menentukan sebuah kemenangan pasangan calon.
Saran untuk pengembang selanjutnya adalah Perlunya pengembangan metode quick count karena metode ini masih memiliki Elsevier, Computers & Security, 989-1010.
[2]
Dwumfuo, G.O. Ofori., Paatey, E., 2011. The design of an electronic voting systems. Research Journal of Information Technology3(2): 91-98. implementation, Elsevier, Computer Standards & Interfaces, 376–386.[5]
Kismiantini (2007). PengumpulanData dengan Quick count dan Exit Poll. Seminar Nasional Penelitian, Pendidikan dan Penerapan MIPA, FMIPA, 1-14.
[6]
Sheila S.Coronel. 2001. The Role Of The Media In Deepening Democracy. http://unpan1.un.org/intradoc/groups/ public/documents/un/unpan010194.pdf Diakses pada tanggal 25 Agustus 2017.
[7]
Adi, K., (2014),
Sistem
Pemungutan Suara Elektronik
0%Perbandingan Perhitungan Quick Count dan Real Count