SITUATION OF CHILD DROWNING IN THAILAND
First printing:
October 2014
Number of pages:
18
Advisor:
Dr. Panuwat Panket
Editors:
Mrs. Suchada Gerdmongkolgan
Ms. Som Ekchaloemkiet
Cover design:
Ms.Thitima Khuntasin
Copyright:
Bureau of Non-Communicable Diseases, Department of Disease Control, Ministry of Public
Health, Thailand
Contents
Page
Summary 1
Situation of Child Drowning in Thailand 3
Mortality 3
• Trends in mortality 3
• Provinces 3
• Gender 7
• Age 7
Case-fatality rate 10
Time of drowning 11
• Month 11
• Day of incident 12
• Time of incident 13
Location of drowning injuries 14
• Water sources 14
• Sites of drowning injuries 15
Risks of alcohol consumption 16
List of Tables
Page
Table 1: Numbers and rates of child drowning deaths (per 100,000 children
<15 years) in Thailand, 2004–2013
5
Table 2: Numbers and rates of child drowning deaths (per 100,000 children
<15 years) in Thailand by gender, 2004–2013
7
Table 3: Numbers and rates of drowning deaths in children <15 years and
all age groups (per 100,000 children <15 years) in Thailand
by age group, 2004–2013
8
Table 4: Case-fatality rates for severe drowning injuries* in children
<15 years in Thailand, 2004–2013
10
Table 5: Numbers of drowning deaths in children <15 years in Thailand
by month, 2004–2013
11
Table 6: Percentage of severe drowning injuries* in children <15 years
by day of the week, 2004–2013
12
Table 7: Percentage of severe drowning injuries* in children <15 years
by time period of the day, 2004–2013
13
Table 8: Percentage of severe drowning injuries* in children <15 years
by type of water source, 2013
14
Table 9: Percentage of severe drowning injuries* in children <15 years
by type of incident site, 2013
15
Table 10: Percentage of severe alcohol-related drowning injuries*
in children <15 years by age group, 2013
16
Table 11: Numbers and percentage of severe drowning injuries* in children
<15 years in Thailand by type of transport to hospital for treatment,
2013
17
Table 12: Numbers and percentage of severe drowning injuries in children
<15 years in Thailand by place of death, 2013
List of Figures
Page
Figure 1: Numbers and rates of deaths per 100,000 population due to
the five leading causes of death in Thailand by age group, 2013
4
Figure 2: Numbers and rates of child drowning deaths (per 100,000 children
<15 years) in Thailand, 2004–2013
5
Figure 3: Child drowning deaths (<15 years) in Thailand by risk areas, 2013 6
Figure 4: Numbers and rates of child drowning deaths (per 100,000 children
<15 years) in Thailand by gender, 2004–2013
8
Figure 5: Numbers and rates of child drowning deaths (per 100,000 children
<15 years) in Thailand by age group, 2004–2013
9
Figure 6: Rates of drowning deaths in children <15 years and all age groups
(per 100,000 children <15 years) in Thailand by age group,
2004–2013
Summary
Summary of major points
There are 135,585 children under 15 years of age who die from drowning all over
the world each year, or about 372 children per day on average.
In the WHO South-East Asia Region, there are 32,744 drowning deaths each year
or 90 deaths per day on average.
In Thailand, the rate of child drowning deaths is 5 to 15 times higher than those
for developed countries.
Drowning is the number one cause of death among Thai children under 15 years
of age compared to fatalities due to all other causes including infectious and non-infectious diseases.
In Thailand, 1,243 children under 15 years of age die from drowning each year,
or about 4 children per day on average (10-year average).
The child drowning death rates per 100,000 children under 15 years of age between
1999 and 2008 ranged from 7.6 to 11.5.
Child drowning deaths had a steadily rising trend between 1999 and 2006 with
a downward trend afterwards.
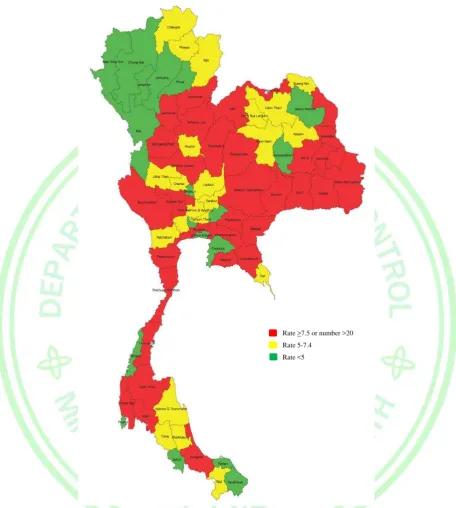
The northeastern region has the highest rate of child drownings, followed by
the central, northern, and southern regions, respectively.
The rate of child drowning deaths for males is approximately 2 times higher than
that for females.
On average, children in the 0–4 age group ranked first for drowning deaths between
1999 and 2008, followed by the 5–9 age group; but since 2005, the 5–9 age group has ranked first.
The proportion of drowning deaths in children under 15 years of age is as high as
24.8% of drowning deaths in all age groups (2013).
The case-fatality rate for child drownings ranged from 31.2 to 47.7% (between
2004 and 2013)
April is the month with the highest number of drowning deaths, followed by
March, May and October. All these months are during school breaks.
Weekends (Saturdays and Sundays) have the highest incidents of severe drowning
injuries.
The time period of the day with the highest incidents of severe drowning injuries
As regards water sources where drownings occur, natural bodies of water rank first,
accounting for 49.4% of all drownings, followed by swimming pools and bathtubs at 6.9% and 4.6%,
respectively (2013).
Of the children under 15 years of age who suffered severe drowning injuries,
3.0% had alcohol consumption behavior.
58.2% of the children with severe drowning injuries admitted to hospital were rescued
and taken to hospital by their relatives or bystanders, followed by officials of emergency medical
Situation of Child Drowning in Thailand
Mortality
According to the analysis of death certificates collected at the MOPH’s Bureau of Policy
and Strategy between 2004 and 2013, drowning was the number one cause of death in Thai children
under 15 years of age, compared to other causes of mortality including infectious and non-infectious
diseases. The rate of drowning deaths ranged from 7.6 to 11.5 per 100,000 children under 15 years
of age, and the total number of drowning deaths was 1,243 cases per year or 4 cases per day
on average.
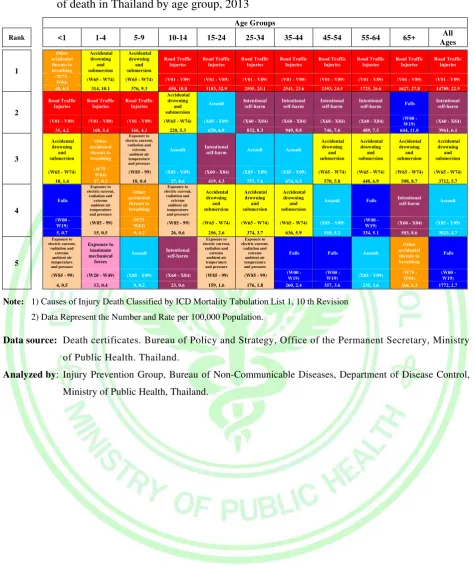
When categorizing the causes of injury-related mortality by age group in 2013,
it was found that the numer one cause of mortality in children under one year of age was accidental
threats to breathing (6.5 per 100,000 population). However, the number one cause of mortality
in the 1–4 and 5–9 age groups was drowning (10.1 and 9.30 per 100,000, respectively). As for
the children aged 10 years and older, the number one cause of mortality was road traffic injuries.
When considering the rates of deaths in all age groups, it was discovered that road traffic injuries
ranked first (22.9 per 100,000), followed by Intentional self-harm (6.1 per 100,000) and drowning
(5.7 per 100,000) (see Figure 1).
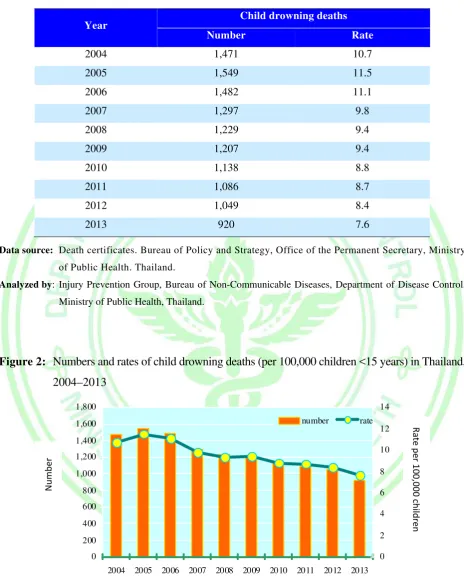
Trends in mortality
During the 10-year period from 2004 to 2013, drowning rates in children aged under
15 years steadily increased between 1999 and 2006, ranging from 7.7 to 11.5 per 100,000 children
under 15 years, before it began to decrease afterwards (see Table 1 and Figure 2).
Provinces
In 2013, the thirty-seven provinces had the highest rates of drowning deaths (7.5 per
100,000 children under 15 years) in children under 15 years of age. Follow by forty provinces
had rates of drowning deaths in children under 15 years less than 7.5 per 100,000 children under
Figure 1: Numbers and rates of deaths per 100,000 population due to the five leading causes
of death in Thailand by age group, 2013
Age Groups
Assault Intentional self-harm Intentional self-harm Intentional self-harm Intentional self-harm Falls Intentional self-harm
(V01 - V89) (V01 - V89) (V01 - V89) (W65 - W74) (X85 - Y09) (X60 - X84) (X60 - X84) (X60 - X84) (X60 - X84) (W00 -
Assault Intentional
self-harm Assault Assault
Accidental
Assault Falls Intentional self-harm Assault
(W00 -
Assault Intentional self-harm
Exposure to
Note: 1)Causes of Injury Death Classified by ICD Mortality Tabulation List 1, 10 th Revision
2) Data Represent the Number and Rate per 100,000 Population.
Data source: Death certificates. Bureau of Policy and Strategy, Office of the Permanent Secretary, Ministry
of Public Health. Thailand.
Analyzed by: Injury Prevention Group, Bureau of Non-Communicable Diseases, Department of Disease Control,
Table 1: Numbers and rates of child drowning deaths (per 100,000 children <15 years) in Thailand,
2004–2013
Year Child drowning deaths
Number Rate
2004 1,471 10.7
2005 1,549 11.5
2006 1,482 11.1
2007 1,297 9.8
2008 1,229 9.4
2009 1,207 9.4
2010 1,138 8.8
2011 1,086 8.7
2012 1,049 8.4
2013 920 7.6
Data source: Death certificates. Bureau of Policy and Strategy, Office of the Permanent Secretary, Ministry
of Public Health. Thailand.
Analyzed by: Injury Prevention Group, Bureau of Non-Communicable Diseases, Department of Disease Control,
Ministry of Public Health, Thailand.
Figure 2: Numbers and rates of child drowning deaths (per 100,000 children <15 years) in Thailand,
2004–2013
0 200 400 600 800 1,000 1,200 1,400 1,600 1,800
2004 2005 2006 2007 2008 2009 2010 2011 2012 2013 0 2 4 6 8 10 12 14 number rate
Data source: Death certificates. Bureau of Policy and Strategy, Office of the Permanent Secretary, Ministry
of Public Health. Thailand.
Analyzed by: Injury Prevention Group, Bureau of Non-Communicable Diseases, Department of Disease Control,
Ministry of Public Health, Thailand.
Number
Rate
per
10
0,
0
00
Figure 3: Child drowning deaths (<15 years) in Thailand by risk areas, 2013
Note: The province is high risk areas: The rate of death from drowning of a child under 15 years in province is equal to or
more than 7.5 per 100,000 children under 15 years or the number of children died more than 20 people.
The province is moderate risk areas: The rate of death from drowning of a child under 15 years in province is 5-7.4 per 100,000 children under 15 years.
The province is less risk areas: The rate of death from drowning of a child under 15 years in province is less than 5 per 100,000 children under 15 years.
Data source: Death certificates. Bureau of Policy and Strategy, Office of the Permanent Secretary, Ministry
of Public Health. Thailand.
Analyzed by: Injury Prevention Group, Bureau of Non-Communicable Diseases, Department of Disease Control,
Ministry of Public Health, Thailand.
Rate >7.5 or number >20 Rate 5-7.4
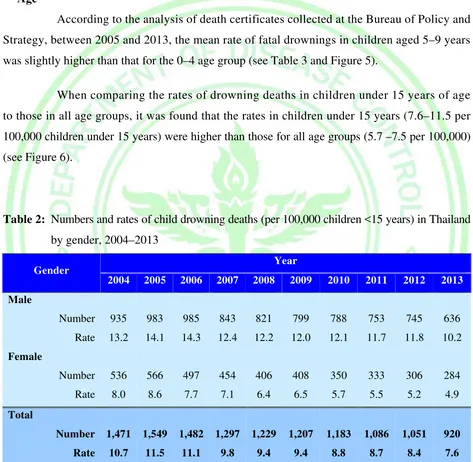
Gender
According to the analysis of death certificates collected at the Bureau of Policy and
Strategy, between 2004 and 2013, the rate of fatal drownings for males was approximately 2 times
higher than that for females. The rate steadily increased from 1999 to 2006 before beginning to
decline in 2007, similar to the overall picture of drowning situations (see Table 2 and Figure 4).
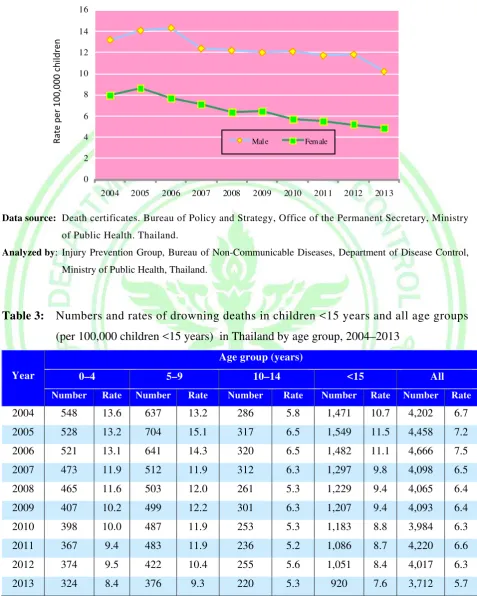
Age
According to the analysis of death certificates collected at the Bureau of Policy and
Strategy, between 2005 and 2013, the mean rate of fatal drownings in children aged 5–9 years
was slightly higher than that for the 0–4 age group (see Table 3 and Figure 5).
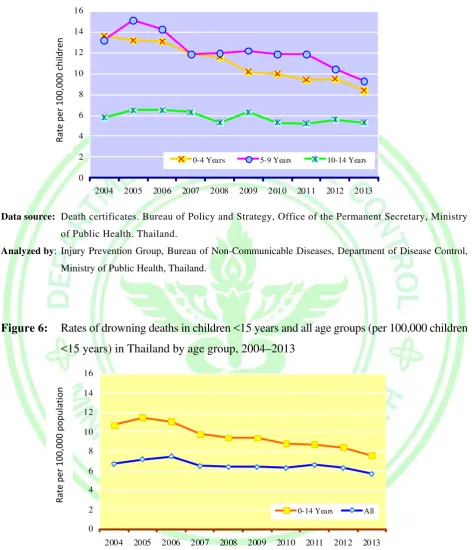
When comparing the rates of drowning deaths in children under 15 years of age
to those in all age groups, it was found that the rates in children under 15 years (7.6–11.5 per
100,000 children under 15 years) were higher than those for all age groups (5.7 –7.5 per 100,000)
(see Figure 6).
Table 2: Numbers and rates of child drowning deaths (per 100,000 children <15 years) in Thailand
by gender, 2004–2013
Gender Year
2004 2005 2006 2007 2008 2009 2010 2011 2012 2013
Male
Number 935 983 985 843 821 799 788 753 745 636
Rate 13.2 14.1 14.3 12.4 12.2 12.0 12.1 11.7 11.8 10.2
Female
Number 536 566 497 454 406 408 350 333 306 284
Rate 8.0 8.6 7.7 7.1 6.4 6.5 5.7 5.5 5.2 4.9
Total
Number 1,471 1,549 1,482 1,297 1,229 1,207 1,183 1,086 1,051 920
Rate 10.7 11.5 11.1 9.8 9.4 9.4 8.8 8.7 8.4 7.6
Data source: Death certificates. Bureau of Policy and Strategy, Office of the Permanent Secretary, Ministry
of Public Health. Thailand.
Analyzed by: Injury Prevention Group, Bureau of Non-Communicable Diseases, Department of Disease Control,
Figure 4: Numbers and rates of child drowning deaths (per 100,000 children <15 years) in Thailand
by gender, 2004–2013
0 2 4 6 8 10 12 14 16
2004 2005 2006 2007 2008 2009 2010 2011 2012 2013 Mal e Fem ale
Data source: Death certificates. Bureau of Policy and Strategy, Office of the Permanent Secretary, Ministry
of Public Health. Thailand.
Analyzed by: Injury Prevention Group, Bureau of Non-Communicable Diseases, Department of Disease Control,
Ministry of Public Health, Thailand.
Table 3: Numbers and rates of drowning deaths in children <15 years and all age groups
(per 100,000 children <15 years) in Thailand by age group, 2004–2013
Year
Age group (years)
0–4 5–9 10–14 <15 All
Number Rate Number Rate Number Rate Number Rate Number Rate
2004 548 13.6 637 13.2 286 5.8 1,471 10.7 4,202 6.7
2005 528 13.2 704 15.1 317 6.5 1,549 11.5 4,458 7.2
2006 521 13.1 641 14.3 320 6.5 1,482 11.1 4,666 7.5
2007 473 11.9 512 11.9 312 6.3 1,297 9.8 4,098 6.5
2008 465 11.6 503 12.0 261 5.3 1,229 9.4 4,065 6.4
2009 407 10.2 499 12.2 301 6.3 1,207 9.4 4,093 6.4
2010 398 10.0 487 11.9 253 5.3 1,183 8.8 3,984 6.3
2011 367 9.4 483 11.9 236 5.2 1,086 8.7 4,220 6.6
2012 374 9.5 422 10.4 255 5.6 1,051 8.4 4,017 6.3
2013 324 8.4 376 9.3 220 5.3 920 7.6 3,712 5.7
Data source: Death certificates. Bureau of Policy and Strategy, Office of the Permanent Secretary, Ministry
of Public Health. Thailand.
Analyzed by: Injury Prevention Group, Bureau of Non-Communicable Diseases, Department of Disease Control,
Ministry of Public Health, Thailand.
Rate
per
10
0,
0
00
childre
n
Figure 5: Numbers and rates of child drowning deaths (per 100,000 children <15 years) in Thailand
by age group, 2004–2013
0 2 4 6 8 10 12 14 16
2004 2005 2006 2007 2008 2009 2010 2011 2012 2013 0-4 Years 5-9 Years 10-14 Years
Data source: Death certificates. Bureau of Policy and Strategy, Office of the Permanent Secretary, Ministry
of Public Health. Thailand.
Analyzed by: Injury Prevention Group, Bureau of Non-Communicable Diseases, Department of Disease Control,
Ministry of Public Health, Thailand.
Figure 6: Rates of drowning deaths in children <15 years and all age groups (per 100,000 children
<15 years) in Thailand by age group, 2004–2013
0 2 4 6 8 10 12 14 16
2004 2005 2006 2007 2008 2009 2010 2011 2012 2013 0-14 Years All
Data source: Death certificates. Bureau of Policy and Strategy, Office of the Permanent Secretary, Ministry
of Public Health. Thailand.
Analyzed by: Injury Prevention Group, Bureau of Non-Communicable Diseases, Department of Disease Control,
Ministry of Public Health, Thailand.
Rate
per
10
0,
0
0
0
childre
n
Rate
per
10
0,
0
00
pop
u
lation
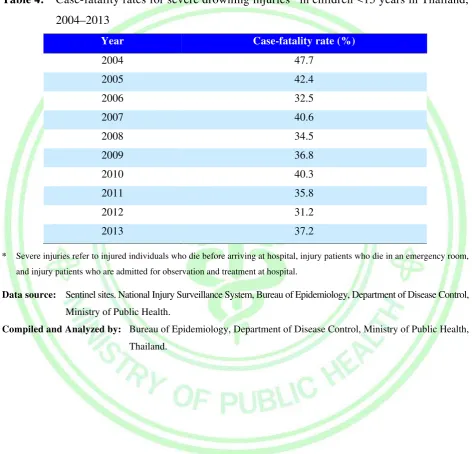
Case-fatality rate
According to the data regarding severe injuries collected at the Injury Surveillance
System (IS), Bureau of Epidemiology, Department of Disease Control, between 2004 and 2013,
the case-fatality rate for child drownings ranged from 31.2 to 47.7% (see Table 4).
Table 4: Case-fatality rates for severe drowning injuries* in children <15 years in Thailand,
2004–2013
Year Case-fatality rate (%)
2004 47.7
2005 42.4
2006 32.5
2007 40.6
2008 34.5
2009 36.8
2010 40.3
2011 35.8
2012 31.2
2013 37.2
* Severe injuries refer to injured individuals who die before arriving at hospital, injury patients who die in an emergency room, and injury patients who are admitted for observation and treatment at hospital.
Data source: Sentinel sites. National Injury Surveillance System, Bureau of Epidemiology, Department of Disease Control,
Ministry of Public Health.
Compiled and Analyzed by: Bureau of Epidemiology, Department of Disease Control, Ministry of Public Health,
Time of drownings
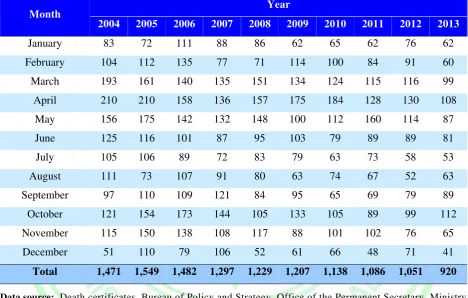
Months
According to the data from the death certificates collected at the Bureau of Policy and
Strategy, when categorizing the drowning deaths among children under 15 years of age by month
of incident, it was found that, between 2004 and 2013, April had the highest number of drowning
deaths, followed by March, May, and October, respectively. (see Table 5).
Table 5: Numbers of drowning deaths in children <15 years in Thailand by month, 2004–2013
Month Year
2004 2005 2006 2007 2008 2009 2010 2011 2012 2013
January 83 72 111 88 86 62 65 62 76 62
February 104 112 135 77 71 114 100 84 91 60
March 193 161 140 135 151 134 124 115 116 99
April 210 210 158 136 157 175 184 128 130 108
May 156 175 142 132 148 100 112 160 114 87
June 125 116 101 87 95 103 79 89 89 81
July 105 106 89 72 83 79 63 73 58 53
August 111 73 107 91 80 63 74 67 52 63
September 97 110 109 121 84 95 65 69 79 89
October 121 154 173 144 105 133 105 89 99 112
November 115 150 138 108 117 88 101 102 76 65
December 51 110 79 106 52 61 66 48 71 41
Total 1,471 1,549 1,482 1,297 1,229 1,207 1,138 1,086 1,051 920
Data source: Death certificates. Bureau of Policy and Strategy, Office of the Permanent Secretary, Ministry
of Public Health. Thailand.
Analyzed by: Injury Prevention Group, Bureau of Non-Communicable Diseases, Department of Disease Control,
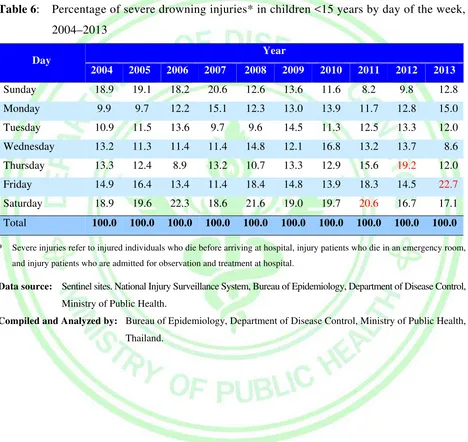
Day of incident
According to the data regarding severe drowning injuries collected at the Injury
Surveillance System (IS), Bureau of Epidemiology, Department of Disease Control, between
2004 and 2013, the day of the week with the largest number of drowning injuries was Saturday,
followed by Sunday (see Table 6).
Table 6: Percentage of severe drowning injuries* in children <15 years by day of the week,
2004–2013
Day Year
2004 2005 2006 2007 2008 2009 2010 2011 2012 2013
Sunday 18.9 19.1 18.2 20.6 12.6 13.6 11.6 8.2 9.8 12.8
Monday 9.9 9.7 12.2 15.1 12.3 13.0 13.9 11.7 12.8 15.0
Tuesday 10.9 11.5 13.6 9.7 9.6 14.5 11.3 12.5 13.3 12.0
Wednesday 13.2 11.3 11.4 11.4 14.8 12.1 16.8 13.2 13.7 8.6
Thursday 13.3 12.4 8.9 13.2 10.7 13.3 12.9 15.6 19.2 12.0
Friday 14.9 16.4 13.4 11.4 18.4 14.8 13.9 18.3 14.5 22.7
Saturday 18.9 19.6 22.3 18.6 21.6 19.0 19.7 20.6 16.7 17.1
Total 100.0 100.0 100.0 100.0 100.0 100.0 100.0 100.0 100.0 100.0
* Severe injuries refer to injured individuals who die before arriving at hospital, injury patients who die in an emergency room, and injury patients who are admitted for observation and treatment at hospital.
Data source: Sentinel sites. National Injury Surveillance System, Bureau of Epidemiology, Department of Disease Control,
Ministry of Public Health.
Compiled and Analyzed by: Bureau of Epidemiology, Department of Disease Control, Ministry of Public Health,
Time of incident
According to the data regarding severe injuries collected at the Injury Surveillance
System (IS), Bureau of Epidemiology, Department of Disease Control, between 2004 and 2013,
the time of the day with the largest number drowning injuries was between 15:00 and 17:59 hrs,
followed the period of time between 12:00 noon and 14:59 hrs (see Table 7).
Table 7: Percentage of severe drowning injuries* in children <15 years by time period of the day,
2004–2013
Time period Year
2004 2005 2006 2007 2008 2009 2010 2011 2012 2013
00:00–02:59 2.5 1.1 2.3 3.5 3.7 0.6 0.7 0.4 2.2 0.0
03:00–05:59 0.0 0.0 0.3 0.0 0.0 0.0 0.0 0.4 0.0 0.4
06:00–08:59 3.9 5.0 4.4 2.7 6.7 4.6 3.7 5.2 3.9 3.9
09:00–11:59 17.6 18.9 16.8 21.8 18.5 23.1 17.6 17.5 16.9 21.2
12:00–14:59 28.8 25.1 30.2 27.4 25.0 25.9 25.9 23.5 26.4 24.8
15:00–17:59 36.3 41.2 38.2 34.5 36.2 38.2 39.5 45.0 40.7 38.3
18:00–20:59 10.3 8.4 7.5 9.2 8.4 7.1 12.0 7.6 9.5 11.2
21:00–23:59 0.6 0.3 0.3 0.9 1.4 0.6 0.7 0.4 0.4 0.4
Total 100.0 100.0 100.0 100.0 100.0 100.0 100.0 100.0 100.0 100.0
* Severe injuries refer to injured individuals who die before arriving at hospital, injury patients who die in an emergency room, and injury patients who are admitted for observation and treatment at hospital.
Data source: Sentinel sites. National Injury Surveillance System, Bureau of Epidemiology, Department of Disease Control,
Ministry of Public Health.
Compiled and Analyzed by: Bureau of Epidemiology, Department of Disease Control, Ministry of Public Health,
Location of drowning injuries
Water sources
According to the data regarding severe drowning injuries collected at the Injury
Surveillance System (IS), Bureau of Epidemiology, Department of Disease Control, 2013, the sites
where drowning deaths most frequently occurred were natural bodies of water, accounting for
49.4% of all drownings, followed by swimming pools and bathtubs at 6.9% and 4.6%, respectively.
In addition, the sites of drowning injuiries most frequently occurred were natural bodies of water
(42.3%), followed by bathtubs (6.4%), and swimming pools (5.2%) (see Table 8).
Table 8: Percentage of severe drowning injuries* in children <15 years by type of water source,
2013
Water source
(categorized according to ICD-10)**
Mortality Morbidity
Percent Percent
Accidental drowning and submersion while in a bathtub (W65) 4.6 5.1
Accidental drowning and submersion following fall into a bathtub (W66) 0.0 1.3
Accidental drowning and submersion while in a swimming pool (W67) 4.6 3.9
Accidental drowning and submersion following fall into a swimming pool (W68) 2.3 1.3
Accidental drowning and submersion while in natural water (W69) 44.8 38.0
Accidental drowning and submersion following fall into natural water (W70) 4.6 4.3
Other specified drowning and submersion (W73) 17.2 16.7
Unspecified drowning and submersion (W74) 21.8 29.5
Total 100.0 100.0
* Severe injuries refer to injured individuals who die before arriving at hospital, injury patients who die in an emergency room, and injury patients who are admitted for observation and treatment at hospital.
** International Standard Classification of Disease and Related Health Problem: ICD 10 refers to the international standard diagnostic classification of diseases and health problems that are the causes of morbidity and mortality.
Data source: Sentinel sites. National Injury Surveillance System, Bureau of Epidemiology, Department of Disease Control,
Ministry of Public Health.
Compiled and Analyzed by: Bureau of Epidemiology, Department of Disease Control, Ministry of Public Health,
Site of drowning injuries
According to the data regarding severe drowning injuries collected at the Injury
Surveillance System (IS), Bureau of Epidemiology, Department of Disease Control, 2013, the sites
where drowning injuries most frequently occurred were the houses or the compounds of the house
(38.5%), followed by paddy fields, farms, or gardens (13.3%) (see Table 9).
Table 9: Percentage of severe drowning injuries* in children <15 years by type of incident site,
2013
Site of incident 2013
Percent
Houses and compounds of the houses 38.5
Paddy fields, farms, gardens 13.3
Schools or hospitals 3.0
Public sports arenas 0.4
Places of trade and services 1.7
Construction sites or factories 1.3
Roads or highways 0.0
Dormitories, prisons, nurseries, or military barracks 0.0
Unspecified 41.9
Total 100.0
* Severe injuries refer to injured individuals who die before arriving at hospital, injury patients who die in an emergency room, and injury patients who are admitted for observation and treatment at hospital.
Data source: Sentinel sites. National Injury Surveillance System, Bureau of Epidemiology, Department of Disease Control,
Ministry of Public Health.
Compiled and Analyzed by: Bureau of Epidemiology, Department of Disease Control, Ministry of Public Health,
Risks of alcohol consumption
According to the data regarding severe injuries collected at the Injury Surveillance
System (IS), Bureau of Epidemiology, Department of Disease Control, 2013, 0.5% of the drowning
victims in all age groups had drunk alcohol. When categorizing the children under 15 years who
drank alcohol and suffered drowning into different age groups, it was found that 3.0% were in
the 10–14 age group and 0% in other age group. (see Table 10).
Table 10: Percentage of severe alcohol-related drowning injuries* in children <15 years by
age group, 2013
Age group (years) Percentage of alcohol-related drownings
(2013)
0 - 4 0.0
5 - 9 0.0
10 - 14 3.0
All age groups 0.5
* Severe injuries refer to injured individuals who die before arriving at hospital, injury patients who die in an emergency room, and injury patients who are admitted for observation and treatment at hospital.
Data source: Sentinel sites. National Injury Surveillance System, Bureau of Epidemiology, Department of Disease Control,
Ministry of Public Health.
Compiled and Analyzed by: Bureau of Epidemiology, Department of Disease Control, Ministry of Public Health,
Accessibility to medical care
According to the individual inpatients database of the MOPH’s Bureau of Policy and
Strategy 2013, for the drowning children under 15 years of age, most of them (58.2%) were rescued
and taken to hospitals by their relatives/bystanders, followed by officials of emergency medical
service (EMS) units (39.3%) and officials of charity foundations (2.5%) (see Table 11).
According to the individual inpatients database of the MOPH’s Bureau of Policy and
Strategy between 2013, 58.6% of the children with severe drowning injuries died after being
admitted to hospital. Furthermore, 31.0% died before arriving at hospital, and 10.4% were pronounced
dead at the emergency room (see Table 12).
Table 11: Numbers and percentage of severe drowning injuries* in children <15 years in Thailand
by type of transport to hospital for treatment, 2013
Persons who took injured children
to hospital
2013
Number Percent
No one 0 0.00
Officials of EMS units 31 39.3
Officials of charity foundations 2 2.5
Police officers 0 0.0
Others such as relatives/bystanders, etc. 46 58.2
Total 79 100.0
* Severe injuries refer to injured individuals who die before arriving at hospital, injury patients who die in an emergency room, and injury patients who are admitted for observation and treatment at hospital.
Data source: Sentinel sites. National Injury Surveillance System, Bureau of Epidemiology, Department of Disease Control,
Ministry of Public Health.
Compiled and Analyzed by: Bureau of Epidemiology, Department of Disease Control, Ministry of Public Health,
Table 12: Numbers and percentage of severe drowning injuries in children <15 years in Thailand
by place of death, 2013
Place of death 2013
Number Percent
Death before arriving at hospital 27 31.0
Death at the emergency room 9 10.4
Death after being admitted to hospital 51 58.6
Total 87 100.0
* Severe injuries refer to injured individuals who die before arriving at hospital, injury patients who die in an emergency room, and injury patients who are admitted for observation and treatment at hospital.
Data source: Sentinel sites. National Injury Surveillance System, Bureau of Epidemiology, Department of Disease Control,
Ministry of Public Health.
Compiled and Analyzed by: Bureau of Epidemiology, Department of Disease Control, Ministry of Public Health,
Thailand.
...
Acknownledgement
Bureau of Health Policy and Strategy, Ministry of Public Health