MALANG
THESIS
BY:
LAILLY WIJIATI RAHMATUL ULLA REG. NUMBER: A73215105
ENGLISH DEPARTMENT
FACULTY OF ARTS AND HUMANITIES
STATE OF ISLAMIC UNIVERSITY SUNAN AMPEL SURABAYA
2019
ABSTRACT
Ulla, L. (2019). Capturing the Linguistic Landscape of Two Islamic Universities in East Java: UIN Sunan Ampel Surabaya and UIN Maulana Malik Ibrahim Malang. English Department, UIN Sunan Ampel Surabaya. Advisor: Prof.
Dr. Hj. Zuliati Rohmah, M.Pd.
Keywords: linguistic landscape, top-down, bottom-up
This research analyzed the linguistic landscape of two islamic universities in East Java; UIN Sunan Ampel and UIN Maulana Malik Ibrahim. By using the concept of space by Lafebre (1991), the language environment will be examined through three dimensions they are; political dimension, physical dimension and experiential dimension. The study was conducted to answer three aspects of linguistic landscape in the universities: what the most appeared language in top- down and bottom-up sign is, how the process of creating public sign in both universities is, and how the students’ attitude as sign reader toward language-use in public signage is.
Quantitative and qualitative content analysis was chosen to investigate the data. Taking photograph, interviewing, and handing out questionnaire were the steps of data collection. Then, in processing the data analysis the general steps taken are classifying, transcribing and calculating the data. The last step required is drawing conclusion.
The result shows that both UIN Sunan Ampel and UIN Maulana Malik Ibrahim have similarity in the most appeared language in the top-down and bottom-up signage. Bahasa Indonesia is placed as the most appeared language, English comes up as the second and the least appeared in public signage is Arabic.
It implies that there is no discrepancy between the official and unofficial sign in both universities. Meanwhile, in the process of creating the public sign UIN Maulana Malik seems to be stricter in conducting the policy of creating public signs. Apparently, UIN Sunan Ampel does not have clear instruction to manage the multilingual signs in the campus. Lastly, the Likert Scale calculation of sign readers’ attitude toward public signs in UIN Sunan Ampel and UIN Maulana Malik Ibrahim also shows an average percentage >70% in responding the foreign language used in public signs. It confirms that the students of both universities have positive attitude toward the foreign language used in the campus public sign.
ABSTRAK
Ulla, L. (2019) Menangkap Linguistik Landskap di Dua Universitas Islam di Jawa Timur: Sunan Ampel Surabaya dan UIN Maulana Maling Ibrahim Malang. Program Studi Sastra Inggris, Universitas Islam Negeri Sunan Ampel Surabaya. Pembimbing: (1) Prof. Dr. Hj. Zuliati Rohmah, M.Pd.
Kata Kunci: linguistik landskap, top-down, bottom-up
Penelitian ini menganalisa linguistik landskap dari dua universitas islam di Jawa Timur yakni UIN Sunan Ampel dan UIN Maulana Malik Ibrahim.
Menggunakan konsep ruang oleh Lafebre (1991), lingkungan kebahasaan akan dianalisa melalui tiga sisi konsep yakni sisi politis, sisi fisik, dan sis empiris. Studi ini dilakukan untuk menjawab tiga aspek dari linguistik landskap di universitas:
bahasa apa yang paling sering muncul dipapan resmi dan tidak resmi, bagaimana kebijakan dalam membuat papan informasi di universitas, dan bagaimana perilaku siswa sebagai pembaca terhadap papan informasi kampus.
Analisa data kualitatif dan kuantitatif dipilih untuk menginvestigasi data penelitian. Langkah-langkah pengumpulan data dilakukan dengan proses pengambilan foto, interview, dan penyebaran kuisioner. Kemudian, proses menganalisa data secara garis besar dilakukan dengan pengklasifikasian, pembuatan transkrip dan perhitungan data. Langkah terakhir adalah menarik kesimpulan.
Hasil penelitian menunjukkan bahwa diantara UIN Sunan Ampel dan UIN Maulana Malik Ibrahim memiliki kesamaan dalam pilihan bahasa yang paling sering muncul di papan resmi dan tidak resmi. Bahasa Indonesia menempati sebagai bahasa yang paling sering muncul, diikuti Bahasa Inggris dan terakhir dengan paling sedikit muncul adalah bahasa Arab. Hal ini menjelaskan bahwa tidak ada perbedaan dalam pemilihan bahasa di papan informasi resmi mau pun tidak resmi. Sementara itu, dalam proses pembuatan papan informasi UIN Maulana Malik Ibrahim terlihat lebih ketat dalam penataan kebijakan. UIN Sunan Ampel tidak memiliki instruksi kebijakan yang jelas untuk mengelola papan multibahasa di kampus. Terakhir, perhitungan skala Likert mengenai perilaku pembaca terhadap papan petunjuk umum di kampus UIN Sunan Ampel dan UIN Maulana Malik Ibrahim menunjukkan rata-rata presentase >70% dalam merespon penggunaan bahasa asing dipapan petunjuk umum. Hal ini mengonfirmasi bahwa mahasiswa dari kedua kampus memiliki perilaku positif terhadap penggunaan bahasa asing dipapan petunjuk umum kampus.
TABLE OF CONTENTS
Inside Cover Page………...……… i
Inside Title Page……….……..…….. ii
Thesis Advisor’s Approval Sheet………..………. iii
Thesis Examiners’ Approval Sheet…………...…..………...… iv
Declaration……..………..………..…………...….... v
Acknowledgements………..………....….. vi
Abstract……….………..…….… vii
Abstrak……… viii
Table of Contents…………...………... ix
List of Tables……… xi
List of Figures……..………...…. xii
CHAPTER I INTRODUCTION 1.1 Background of Study……… 1
1.2 Research Question……….… 7
1.3 Research Objectives………..…… 8
1.4 Significance of the Study………..…… 8
1.5 Scope and Limitations………...…… 8
1.6 Definition of Key Terms………..…….…… 9
CHAPTER II THEORITICAL FRAMEWORK 2.1 Linguistic Landscape……… 10
2.2 Sign Maker………..……….…….………… 11
2.2.1 Top-Down Sign…..………...……….. 11
2.2.2 Bottom-Up Sign….………...……..…….. 12
2. 3 A Three Dimensional Study….………..………. 13
2.3.1 Physical Dimension….………...……….. 14
2.3.2 Political Dimension….………...….…….. 15
2.3.3 Experiential Dimension….………... 15
CHAPTER III RESEARCH METHODOLOGY 3.1 Research Design……… 17
3.2 Data and Data Source……… 17
3.3 Research Instrument……….……… 19
3.4 Data Collection ……… 20
3.5 Data Analysis……… 22
CHAPTER IV FINDINGS AND DISCUSSION
4.1 Findings ……… 32
4.1.1 Top-Down and Bottom-Up Signs……….…………. 33
4.1.1.1 UIN Sunan Ampel………..…….… 33
4.1.1.1.1 Top Down Sign in UINSA………...….…... 33
4.1.1.1.2 Bottom Up Sign in UINSA……….. 37
4.1.1.2 UIN Maulana Malik Ibrahim……….…..…………... 40
4.1.1.2.1 Top Down Sign in UIN Maulana Malik Ibrahim……….…………...………. 39
4.1.1.2.2 Bottom Up Sign in UIN Maulana Malik Ibrahim…..………... 41
4.1.2 Process of Creating Public Sign………..……….………... 45
4.1.2.1 UIN Sunan Ampel………... 45
4.1.2.2 UIN Maulana Malik Ibrahim………..………... 46
4.1.1.3 Sign-Reader Attitude toward Language in Sign………..…... 59
4.1.1.3.1 UIN Sunan Ampel Surabaya………..……….. 50
4.1.1.3.2 UIN Maulana Malik Ibrahim………... 52
4.2 Discussion ……… 54
CHAPTER V CONCLUSION AND SUGGESTION 5.1 Conclusion.………...………... 64
5.2 Suggestion………... 65
REFERENCES 67 APPENDICES Appendix 1 Interview Guidelines………... 70
Appendix 2 Questionnaire Guidelines……..………... 71
Appendix 3 Transcript of the Interview………... 74
LIST OF TABLES
Tables Pages
Table 3.1 Color Coding... ... 26 Table 4.1 Indonesia, English and Arabic in UINSA Public Signs... 35 Table 4.2 Indonesia, English and Arabic in UINSA Private Signs... 39 Table 4.3 Indonesia, English and Arabic in UIN MALIKI Public Signs.... 42 Table 4.4 Indonesia, English and Arabic in UIN MALIKI Private Signs... 44
LIST OF FIGURES
Figures Pages
Figures 2.1 Examples of Top-down Sign in UINSA... 12
Figures 2.2 Examples of Bottom-up Sign in UINSA... 13
Figure 3.1 Folder for each building... 23
Figure 3.2 Grouping... 23
Figure 3.3 Counting each number of signs... 24
Figure 3.4 Table of LL Physical Dimension Percentage... 24
Figure 3.5 Example of transcribing the data... 25
Figure 3.6 Coding in the transcribe text... 26
Figure 3.7 Highlighting... 27
Figure 3.8 Interpreting... 28
Figure 3.9 Sorting the questionnaire... 29
Figure 3.10 Counting the Likert Scale category... 29
Figure 3.11 Calculating the percentage... 30
Figure 3.12 Tabulating the percentage... 30
Figure 4.1 Appearances of Top Down Sign in UINSA……… 34
Figure 4.2 Top Down Multilingual Sign in UINSA... 36
Figure 4.3 Appearances of Bottom Up Sign in UINSA………... 37
Figure 4.4 Appearances of Top Down Sign in UIN MALIKI……….. 41
Figure 4.5 Appearances of Bottom Up Sign in UIN MALIKI………. 43
Figure 4.6 Bottom Up Signs in UIN Maliki... 45
Figure 4.7 Top Down Multilingual Sign in UIN Maliki... 46
Figure 4.8 Top Down Sign in UIN Maulana Malik Ibrahim Malang... 52
Figure 4.9 Sign Reader’s Attitude in UINSA………. 53
Figure 4.10 Sign Reader’s Attitude in UIN MALIKI………. 35
CHAPTER I
INTRODUCTION
This chapter provides the explanation of background of the study, objective of the study, significance of the study and the definition of key terms.
1.1 Background of the Study
Linguistic landscape or LL is often defined as the language of public road signs, advertising billboards, street names, place names, commercial shop signs, and public signs on government buildings and how they combine to form the linguistic landscape of a given territory, region or urban agglomeration (Landry and Bourhis, 1997: 25). Since Landry and Bourhis introduces the term, this subfields from sociolinguistics has gained interests by many linguist researchers.
Troughout the decades, several attempts have been done by many researchers in investigating the linguistic landscape in order to develop its potential as language of society. Thereupon, the scope of linguistic landscapestarts to expandfrom multilingualism (Laundry and Bourhis, 1997; Gorter, 2007; Bakchaus, 2006;
Lawrence, 2012) to bussines & tourism (Moriarty, 2015; Schlik, 2003, Cenoz and Gorter; 2008, Kallen, 2009), even minor and major language (Lawrence, 2012), also variant of English (Huebner, 2006), as well as semiotic (Jaworski, 2010;
Pennycook,2009; Poveda, 2012), and typology (Reh, 2004).
The taken site for the study is also enhanced started from public places such as town-centers (Schlick, 2003), market, street (Lawrence, 2012), airport (Sole, 2007), to education site such as schools (Dagenais, D., Moore, D., Sabatier,
C., Lamarre, P., & Armand, F..; 2014) and universities (Haynes, 2012). Cenoz and Gorter (2008) have pointed the role of linguistic landscape as language input device of second language acquisition to pupil. They find out potential usage of linguistic landscape through the functions of English langauge on commercial signs. Since then, several studies start their focus on pedagogical applications of linguistic landscape.
With the increasing interest in public places signage, the research about linguistic landscape is also easily found in many part of the world. Some regions where the researches have conducted linguistic study are, for instances, in Asia (Wang, 2015; Backhaus, 2006; Rowland, 2013; Curtin, 2014, Lawrence, 2012), Europe (Calvet, 1990; Shohamy, 2010; Trumper, 2009; Lanza, 2009; Leung, 2012;
Poveda, 2012), and Southeast Asia (Tan, 2014; Tang, 2016; Huebner, 2016;
Siricharoen, 2016; Shang, 2017; Coluzzi, 2017).
In Indonesia, there have been also some researches of linguistic landscape studies conducted by some researchers. Unfortunately, the main focuses of the previous researches are dominated by the context of tourism and cityscape only.
The study of LL that investigates educational area is still considered to be very rare in Indonesia.
Places such as school, boarding school, and university should also be investigated. Education places have a big role in enhancing students’ language awareness and perception toward globalization. Siricharoen (2016) states that raising language awareness can be done by letting the students to be exposed to authentic contexts in foreign language and make them conscious of linguistic
strategies of their landscape. Therefore, by this study, the researcher wants to follow Siricharoen’s suggestion in conducting linguistic landscape in education settings.
In Indonesia, the number of the official published research of LL in educational setting in Indonesia is only two titles that can be found at the moments. They are conducted by Auliasari (2019) and Firdausiyah (2019).
The recent study of LL conducted in education settings have been done by Auliasari (2019). The researcher investigates the LL of private and state school of Surabaya by applying the theory of Spolsky and Cooper. The study analyzes the linguistic landscape according to the language used in the sign and the function of the sign. The instrument observation and interview are used in the research. The results of the research show that the kinds of the languages that is used in the school, the types of LL categorization sign and the function of the LL in the school. However, the researcher is only focused on the physical and the political dimension of LL.
The other study of LL held in educational area has been done by Firdausiyah (2019). The study takes place in Pondok Pesantren Putri Mambaus Sholihin Gresik. The research explores three research questions about how the languages are displayed, what are the categories of the sign and how the signs are constructed. The research concludes that the displayed languages in the sites are English, Indonesia, and Javanese. There are six kinds of signs in the area and the function of the sign is not only as pedagogical tool but also to remind the students, to build language environment and to create aesthetic values. Neverthless, the
clear distinction of the sign maker either top-down or bottom-up from the sign is vague.
The present study tries to fill in the gaps of the previous LL research in educational settings area by taking different site. Therefore, to enrich the perspective of LL in educational context in Indonesia the researcher chooses different angle in exploring the LL related to education area. The chosen site of the study will be university.
Universities have a big role as institutes settings which applying the functioning society that should be valued (Haynes, 2012). Universities are educational institutions that have both educational and occupational perspectives, they are where knowledge is invented, exchange and disseminated, and are workplaces for staff and students. University setting is an important area due to its influence roles on society (Yavari, 2012) and employment (Shohany and Abu Ghazaleh Mahajneh, 2012). Furthermore, the research of linguistic landscape conducted in Indonesia by focusing educational sites or pedagogy potential is still relatively rare.
The present study take an analysis in research construction that has not been investigated by other linguistic landscape researchers in Indonesia. First, the researcher will use comparative design to explore the language environment of two Islamic campus in Indonesia asrepresentatives. Second, the theory that will be used is three-dimensional theory which means the policy, the signage, as well as the sign-reader’s feedback will be investigated. Comparing two sites of university
and analyzing three aspects of linguistic landscape in one research is never done by Indonesian previous linguistic landscape researchers in Indonesia.
Comparing two universities’ linguistic landscape has been done by Sonia Yavari in her thesis entitled Linguistic Landscape and Language Policies: A Comparative Study of Lingkoping University and ETH Zurich. She chooses the mentioned universities because both of them are the house of many international students; it is likely that the national languages are not the only languages found in the linguistic landscape. Therefore, the multilingualism and students background is rich by diversity. From the study, it is found out that at both universities, the dominant language is the national language (Swedish at LiU and German at ZTH), and English has the second position. Yavari concludes that defining a unified policy from both campus from different country, Switzerland and Germany, even its university is not possible. However, the study is only investigated around the relationship between linguistic landscape (LL) and language policy in both campuses.
Analyzing by using three-dimensional space design in Kyushu University’s linguistic landscape has been conducted by Jing-Jing Wang in 2015report entitled Linguistic Landscape on Campus in Japan—A Case Study of Signs in Kyushu University. He investigates Ito campus of Kyushu University from its language policy, language sign, and language perception by students. The investigation to analyzed the campus language policy is done by compelling document or formal written book that governs language policy in campus. The language sign was divided through the types of the multilingualism to
monolingualism of the public board, and the perception is collected by questionnaire. Japan eventhough does not have regulation or law written in governing language in public, the government –starts from entertainment to education side, has pushed a great effort to potray internationalization in Japan landscape. It is found out that on Ito campus of Kyushu University, bilingual Japanese-English signs compose the majority of the formation of campus signs, with Japanesse language used as the dominant language. The results from the questionnaire is known that in academic life, students value bilingual ability a lot;
in the daily life, students maintain multilingual contact to a certain degree.
However, Wang only focuses on public sign (top-down) as the reference for Trumper-Hecht’s theory in physical dimension and neglects the private sign (bottom-up). Szabo et al (2012) in Yavari (2012) states that even though a distinction is usually made between top-down and bottom-up signs, both play their part together in making the overall image of LL. Therefore, to evaluate the manifestation of certain policy, bottom-up signage should not be ignored since the sign also plays particular part in linguistic landscape phenomena.
The present study aims at filling in the gaps by previous researches in Indonesia by investigating the aspects of linguistic landscape in educational site particularly in university area. The theory of three-dimensional study would also be differentiated from Wang’s (2015) study. Since Wang has neglected the bottom-up sign in the previous research, the present research will try to potray the landscape of top-down and bottom-up signage as well. As Szabo et al (2012) has said that even though a distinction is made between top-down and bottom-up
signs, both play their part together in making the overall image of LL. In other words, LL is a “gestalt”, Ben Rafael defines gestalt as items-appearing-together, and all the items are seen as one whole (2009).
In this research, the researcher will compare the linguistic landscape of two Islamic Universities in East Java, they are UINMaulana Malik Ibrahim in Malangand UIN Sunan Ampel in Surabaya. The comparison is used in order to know the language environment and the language attitude from the students. This report will try its best to describe the language phenomena in Islamic university in by conducting researh inUIN Maulana Malik Ibrahim, and UIN Sunan Ampel Surabaya.
The reason for conducting the study of LL in the two Islamic universities is because Islamic universities have certain absolute similarities in language rather than public universities. Arabic, English, and Indonesia are the most certain language expected to be found when one encounters the Islamic university sites.
The multilingualism expectation is clear and more certain be constructed in such strong multiculture site. Therefore, the researcher chooses Islamic Universities.
1.2 RESEARCH QUESTION
1. What is the most appeared language in top-down and bottom-up signage in UIN Sunan Ampel and UIN Maulana Malik Ibrahim?
2. How is the policy in creating public sign inUIN Sunan Ampeland UIN Maulana Malik Ibrahim?
3. How is the students’ attitude as sign-reader toward the language-sign inUIN Sunan Ampeland UIN Maulana Malik Ibrahim?
1.3 RESEARCH OBJECTIVES
1. To describe what is the most appeared language in top-down and bottom-up signage in UIN Sunan Ampel and UIN Maulana Malik Ibrahim
2. To describe the policy in creating public sign in UIN Sunan Ampel and UIN Maulana Malik Ibrahim
3. To describe the students’ attitude as sign-reader toward the language-sign inUIN Sunan Ampel and UIN Maulana Malik Ibrahim
1.4 SIGNIFICANCE OF THE STUDY
This study will be conducted in reaching its two main significance goals, theoritically and practically. In theoritical significance, the researcher wants to enrich the scope study of linguistic landscape. This research also will add more references in linguistic landscape study by using three-dimensional theory.
Practically, the researcher wants this study to contribute in Islamic Universities in Indonesia especially in raisinng language awareness and developing language-making in education site. Thereupon, this research can be a guide to start the better international atmosphere in education area particularly through contructing its education setting’s language environment.
1.5 SCOPE AND LIMITATION
In order to make the discussion not going all over the place, the scope and limitiation are made. The line scope of the research is bordered by the notion of three-dimensional theory by Trumper-Hecht (2010) developed from Lefebre’s (1991) notion of space.
The research will analyze three dimensions, they are; political dimension, physical dimension, and experiental dimension. The political dimension only covers the process of creating the public signs, the physical dimension only covers the official and unofficial sign in certain faculties that have been chosen by the researcher and the experiential dimension only covers the experience of the students in two universities.
1.6 DEFINITION OF KEY-TERMS
i. Linguistic landscape: the language that is written in any sign displayed in certain areas, it could be public sign such as street names, buildings name, etc. or private sign such as graffiti, sticker, or flyer created by locals.
ii. Top-down signs : top-down sign is also refer to public sign. It refers to any sign that is created by the official head or staff from the goverment / institutes that regulates the territory.
iii. Bottom-up signs : bottom-up is also called as private sign refers to any sign or announcement paper or writings created by locals that can be seen easily in public places
CHAPTER II
THEORITICAL FRAMEWORK
This chapter describes the theory that the researcher uses to conduct the research. The theory that is described in the following paragraphs is linguistic landscape theory.
2.1 LINGUISTIC LANDSCAPE
Gorter (2006) in Yavari (2012) defines linguistic landscape (LL) as a developing field of sociolinguistics and applied linguistics which concerns the written-form of languages in public space. Landry and Bourhis define linguistic landscape as the language of public road signs, advertising billboards, sreet names, place names, commercial shop signs, and public signs on government building (1997). However, more recent studies point out the necessity to go beyond the definition, Shohamy (2011) states as cited in Aladjem et al (2016) that linguistic landscape also include images, sounds, drawings and movement, in line with current theories about multimodality. But Wang (2015) limits the definition by arguing that the term depends on how the researchers collect the signs as their data.
Linguistic landscape as public signage conveys more than what it writes.
Notion such as ideology, power, awareness and attitudecan be linked as the message that can be learnt from the landscape of public-private sign.Many linguistic landscape researches have focused primarily on analyzing collections of digitally photographed signs, and relationship between language and particular
linguistic landscapes (Backhaus, 2007; Rafael et al, 2006; Laundry and Bourhis, 1997), other researchers have focused on people’s relationships with linguistic landscapes, examining issues related to the creation of signs, the perception of signs, and the experience of being in a particular landscape (Wang, 2015).
Exploring linguistic landscape in educational setting is as important as exploring linguistic landscape in certain town. Since the language-sign can convey many complicated things from a hidden agenda to a language awareness, the results can also significantly contribute to an evaluation of certain area in the aspect of multilingualism and globalization. As Haynes (2012) has stated on his thesis, that the linguistic landscape study should be conducted wholly in order to know the language environment deeply.
2.2 SIGN MAKER
Identifying the sign maker is one of important aspect in LL. By identifying the sign-maker reseacher will be able to indirectly reveal many things between different sign-makers (Huebner, 2009). Apparently, there are many terms used to differentiate the sign maker based on previous researchers but mostly they are distinguished between two categories, “private & public” (Shohamy, Ben-Rafael
&Barni, 2010), “top-down & bottom-up” (Ben-Rafael, Shohamy, Trumper Hect, 2006), “official & non-official” (Backhaus, 2006), or “private & public” (Landry and Bourhis, 1997). In this thesis, the author will use the categorization LL sign maker by Ben-Rafael that is top-down and bottom-up.
2.2.1TOP-DOWN SIGN
Top-down signs is also referred as “public signs” (Shohamy, Ben-Rafael, Laundry & Borhis, 1997), or “official signs” (Backhaus, 2006). Despite of many terms refer to the top-down signs, previous researchers share similar concept and scope of top-down signs. Top-down signs refer to “signs issued by public authorities (like government, municipalities or public agencies” (Ben Rafael, 2006). Therefore, any public signs that is released by the authorities of the place is considered to be top-down sign. In this thesis, top-down sign refers to any publi sign, announcement, flyer or etc. that is published by the official office of university’s head and staff.
Figures 2.1Examples of Top-down Signin UINSA
2.2.2 BOTTOM-UP SIGN
Bottom-up signs is also having many terms, such as “private signs”
(Landry and Borhis, 1997), or “non-official signs” (Backhaus, 2006). Regardless
of many terms to mention bottom-up signs, previous researcher also shared the similar concept and scope of bottom-up signs.
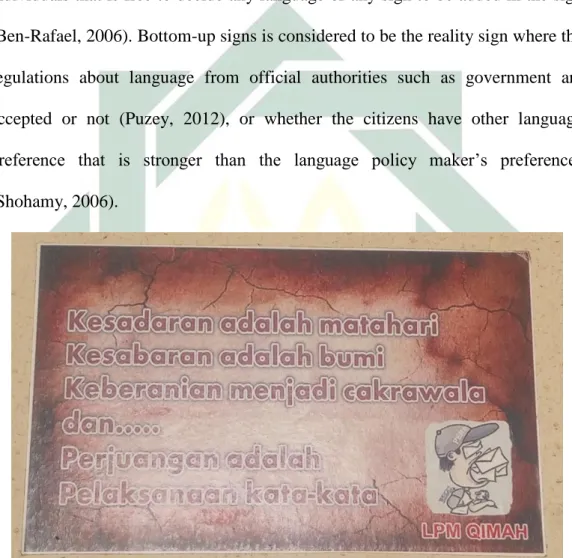
The basic definition that makes bottom-up sign different from top-down sign is the maker and its policy. Bottom-up sign preferably created by private or individuals that is free to decide any language or any sign to be added in the sign (Ben-Rafael, 2006). Bottom-up signs is considered to be the reality sign where the regulations about language from official authorities such as government are accepted or not (Puzey, 2012), or whether the citizens have other language preference that is stronger than the language policy maker’s preferences (Shohamy, 2006).
Figure 2.2 Examples of bottom-up sign in UINSA
2.3A THREE DIMENSIONAL STUDY
Trumper-Hecht (2010) expands Lefebvre’s (1991) idea of ‘space’ and sees linguistic landscape as a sociolinguistic-spatial phenomenon. Lefebvre refers
landscape to the visual aspect of space that may change in different social context accordingly with the features of that society (Trumper-Hecht, 2010). The study brings linguistic landscape research into the field of multilingual campuses to see the stimulation of globalization (Wang, 2015).
Trumper-Hecht (2010) develops three dimension of space proffered by Lefebvre in The Production of Space (1991) and explains that the spatial-practice can be seen as: political dimension, physical dimension, and experiential dimension.This theory covers the entire aspect of what and who is involved in language environment in certain settings.
2.3.1 PHYSICAL DIMENSION
Spatial-practice or be seen as physical dimension of language space is the one sign the demonstrates the actual distribution of languages used on signs (Trumper-Hecht, 2010). The physical sign in linguistic landscape is divided as public sign (top-down) and private sign (bottom-up) (Rafael, 2006).
Shohamy states that top-down and bottom-up are differentiated by the used languages in the public places (2006). Top-down signages links with the authorities of languages preference, bottom-up signs shows whether the preference is accepted and implemented by general population (Puzey, 2012). Ben Rafael (2009) puts the distinction between top-down and bottom-up in clear way, that they are differentiated by the actor who makes it. Top-down signs serve official policies meanwhile bottom-up signs are designed much more freely (Rafael, 2009).
2.3.2 POLITICAL DIMENSION
Political dimension or be called as conceived space by Trumper-Hecht’s (2010) theory means the policy that reflects views and ideologies held by different policy makers whose policies mold the linguistic landscape. The policy that will be examined through is the policy in creating the public sign. Even though the language policy plays the big role in creating tool to promote the foreign and national language, the researcher will separate the policy in general language management and the process of creating public sign.
2.3.3 EXPERENTIAL DIMENSION
The lived-space theory or often be called as experiential dimension explained by Trumper-Hecht as the dimension that presents the attitudes of inhabitants (2010). This means that experential dimension is any feedback from the sign-reader to the signage, it could be attitude or perception. Here, the research focuses on the feedback in form of attitude.
Allport (1935) in Garret (2010) claims that attitude is the most indispensable concept in social psychology. Thurstone (1931) in Garret (2010) defines an attitude as affect for or against a psychological object. It deals with the condition of what people think, feel and like to do toward a person or an object in certain situations. Since 1996, the work on attitudes has become the core concept of sociolinguistics. It is marked by Labov’s research about language changes by the prestige and the stigma or “language attitude” afforded by speech community.
Language attitudes are distinguished from other forms of attitudes due to the fact that they are precisely about attitude toward language. Richard (1992) defines
language attitude as the attitude which speakers of different languages or language varieties have toward each others’ language or to their own language. Language attitude people’s belief in a language and language object, which make people react in a certain way; positive attitude or negative attitude.
A positive attitude is defined as the attitude of enthusiasm for the use of language (Garin & Mathiot, 1986 in Chaer & Agustina, 2004). Moreover, Garvin and & Mathiot (1968) aslo states that positive attitude toward particular languages are said to work as language loyalty, language pride, and awareness of language norms. Language loyalty triggers and encourages the society to maintain the existence of their language. Language pride influences the community to develop the language and to use it as their identity and unity of society. Awareness of language norms motivate the society to use the language appropiately and correctly.
Conversely, negative attitude toward a language can be defined as a rejection, indignity, and unawareness toward the language. Related to the characterisitc proposed by Garvin and Mathiot (1968), negative attitude is characterized as the absence of language loyalty, language pride as well as awareness of language norms.
CHAPTER III
RESEARCH METHODOLOGY
In this chapter, the methodology or the research is explained. The chapter delivers the detail information about the research design, how to get and analyze the data of the research.
3.1 RESEARCH DESIGN
The researcher used the mixture of two methods; qualitative and quantitative. This method gave many benefits to the research as Donyei (2007) has stated that one principal benefits of using such approach for the research wouldcomplement the research data.
Besides using qualitative and quantitative approach, the comparative research design was also used. The research aimed to strike the data differences as and similarities from the two universities in the capacity of the signage, the sign policy, and the sign-reader’s perception.
3.2 DATA AND DATA SOURCE
In this research, there were three kinds of data. The first data was the photograph of linguistic landscape in universities. Shohamy (2011) stated as cited in Aladjem et al (2016) that linguistic landscape also included images, sounds, drawings and movement, in line with current theories about multimodality. But Wang (2015) limited the definition by arguing that the term depends on how the researchers collect the signs as their data. The signage included students’ notice, students’ event, infographic, etc. However, in this research the data was limited to
signs that have written form only. The researcher captured any sign in the universities both public-signage (the signs which are created by official staff of the campus, such as; building name, road sign, etc) and private-signage (the signs which are created by the students of the campus, such as; event flyer, poetry hung in magazine wall, etc) by mobile phone camera. Therefore, the data were stored in .jpg formats.
The second data were qualitative data. Therefore, the data were served in form of words. The researcher looked forsome informations in regard to universities’ regulation that has the authority to manage the public signage. The researcher did interview to some people that has authority in creating public sign in both universities.
The third data were taken from the questionnaires filled by the respondents.
The data answered the third research question which is about students’ language- in-sign attitude. The data were served in numeric data and charts since the data were considered to be quantitative. There are two kinds of questionnaire that will
The source of data that was taken for this research were some buildings and area inUIN Maulana Malik Ibrahim and UIN Sunan Ampel. According to Haynes (2012) the selected building for linguistic landscape appropitely taken from buildings with different purpose. In addition, Yavari (2012) conductedthe research by selecting the campus area that has bigger number of students in scale.
In the present research, the researcher combined both method from Yavari (2012) and Haynes(2012). The researcher selected the campus areaof UIN Maulana Malik Ibrahim and UIN Sunan Ampelforthe undergraduatestudents. Then, the
data source were shrinken into some buildings only as Haynes (2012) has suggested to purposefully pick buildings with different purposes. Therefore, the present research purposefully picked the following department buildings; Arts and Humanities Faculty, Tarbiyah Faculty, Sharia and Law Faculty, Science and Technology Faculty, and Economic Faculty.
The reason arts humanities, tarbiyah, sharia, science, and economics faculty are chosen by the researcher to shrink the different buildings between UIN Maulana Malik Ibrahim and UIN Sunan Ampel. The chosen faculties listed above are the faculty buildings which both universities have in common. The students of mentioned departement are more pushed to be able to adapt and to involve in such multi-race and multi-culture setting.
3.3 RESEARCH INSTRUMENT
In conducting the research, there were three instruments used to answer different research questions. The first instrument was observation. The researcher observed the public and private signage in the campus and take photograph as data. As Hult (2009) states that linguistic landscape study is based on taking photographs from the relevant source. Observation was needed to know whether the language-maker’s policy is accepted by the whole population, or there will be another notion of language-policy by different actors.
The second instrument was interview. The researcher didsemi-structured interview to several islamic university authorities in order to know the universities’
policy of language. When doing the structured-interview, the researcher also did audio-recording as main instrument and field-note as secondary instrument. To
make the intervew run smoothly, the interviewee will be interviewed in Bahasa Indonesia (for more detail check interview guidelines in appendix 1).
The third instrument that was used is questionnaire. The questionnaire wasadapted from Wang (2015) to see readers’ attitude toward the sign. The section of the questionnaire was formed in Likert scale. The respondents were served several questions regarding the language appears in public sign then, the respondents were asked to pick the range from 1 (notimportant at all) to 5 (very important).The second section is appeared in qualitative form. The researcher asked either the respondent has further comment toward language public sign issues or not. Therefore, the questionnaire that was used in this research is an open-ended questionnaire.
3.4 DATA COLLECTION
In collecting the data, the researcher did in several procedures. The procedures were divided into three categories they are interview, obsevation, and collecting questionnaire. The first one was observation. In linguistic landscape methodology, it is known that the data collection is based on taking photographs from the relevant sources (Hult:2009). Here, the researcher gathered the data photograph by using mobile-phone camera.
1. The researcher went to the chosen buildings (see table 1) to capture several signs that can be seen. The researcher only considered the sign in a specific area. Hult (2009) suggests to photograph the signs which are visible at street level with the naked eye. Therefore, the data that were taken is the sign that
can be seen easily. The taken data was based on the following criteria; hung in notice-boards-signs, direction signs, and warning signs.
2. Categorizing the data that had been collected. When collecting the data, the problem of LL usually arises in categorizing numerous gathered signs (Yavari, 2012). The sign thatn was taken should be identified who the actor post the signs, top-down means the sign is posted by university staffs and bottom-up means the sign is posted by student.
3. Capturing the sign. The researcher gathered the data photograph by using mobile-phone camera. One picture aimed at one sign.
The second one was interview. The researcher conducted a structured interview to know the basic language-environment idea in the university. The interview guidelines is attached in the appendix.
1. The researcher met the chairperson that has authorities to regulate the language policy in regard universities
2. Recording. The interviewee and interviewer’s conversation were recorded by using mobile phone. Audio recorder was chosen to record the interview session.
3. Field note taking. Besides recording the audio, the interviewer also noted down any vital information that was given by the interviewee.
The third methodology wasconducting questionnaire. However, the questionnaire was spread along with the same time and place where the researcher held observation for physical landscape. The reason why these two actions take at
the same time and place is to make the methodology efficient. Questionnaire were handed-out to the students of UIN Maulana Malik Ibrahim and UIN Sunan Ampel.
The chosen criteria for the respondents was the respondent must be an undergraduate students in regarded universities. However, the total number of the undergraduate students in those three universities is too large. The official websites state that there are 15.484 students of UIN Maulana Malik Ibrahimand 9.217 students of UIN Sunan Ampel. Therefore, in order to make the reseach conducted effectively and efficiently the researcher minimalized the respondents by using convenience sampling.
Convenience sampling (also known as Haphazard Sampling or Accidental Sampling) is a type of non-probability or non-random sampling where members of the target population that meet certain practical criteria, such as easy accessibility, geographical proximity, availability at a given time, or the willingness to participate (Donyei:2007). It is also referred to the searching subjects of the population that are easily accessible to the researcher.
The researcher spreaded the questionnaire to the undergraduate students who were available at the same building where the researcher takes observation method. The questionnaire wasspread to 50 respondents in everyuniversities.
Hence, the total for both universities respondents were100 respondents.
3.5 DATA ANALYSIS
In analyzing the data, the researcher did in several procedures to answer each research questions. For the first question about language-sign was analyzed by observation data.
1. The researcher moved the file data from phone to laptop
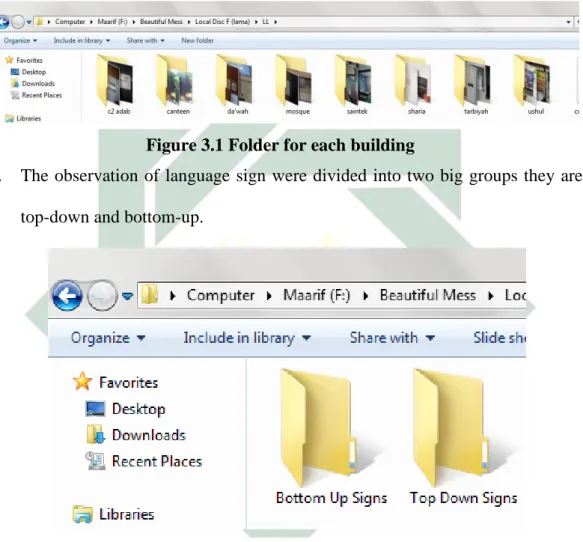
2. The researcher classified the pictures into each folder. There wasone folder for each buildings.
Figure 3.1 Folder for each building
3. The observation of language sign were divided into two big groups they are top-down and bottom-up.
Figure 3.2Grouping
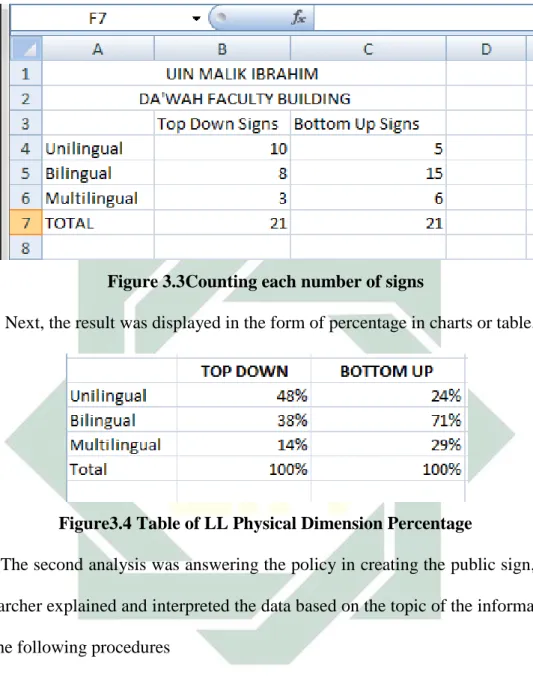
4. Then, researcher counted both big groups into smaller groups sign, they are multilingual sign, bilingual sign, and monolingual sign.
Figure 3.3Counting each number of signs
5. Next, the result was displayed in the form of percentage in charts or table.
Figure3.4 Table of LL Physical Dimension Percentage
The second analysis was answering the policy in creating the public sign, the researcher explained and interpreted the data based on the topic of the information by the following procedures
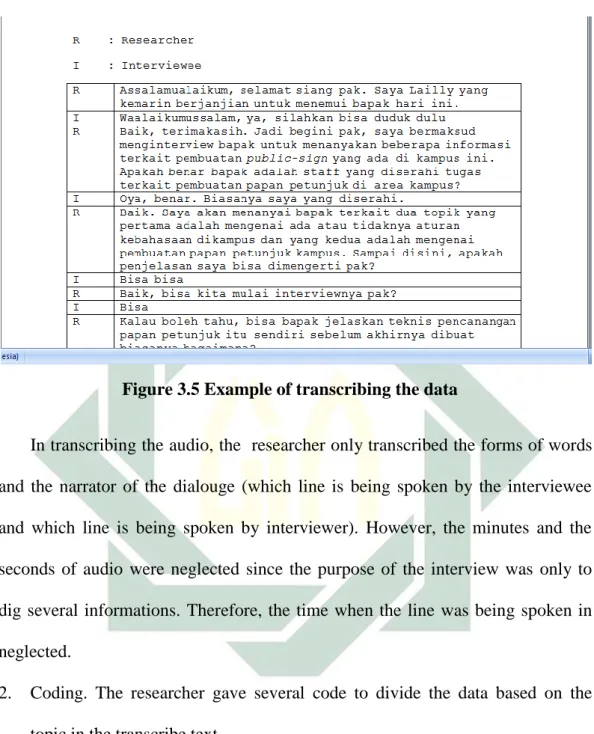
1. Transcribing the audio. The researcher transcribed the audio that records the interview conversation with the interviewee.
Figure 3.5 Example of transcribing the data
In transcribing the audio, the researcher only transcribed the forms of words and the narrator of the dialouge (which line is being spoken by the interviewee and which line is being spoken by interviewer). However, the minutes and the seconds of audio were neglected since the purpose of the interview was only to dig several informations. Therefore, the time when the line was being spoken in neglected.
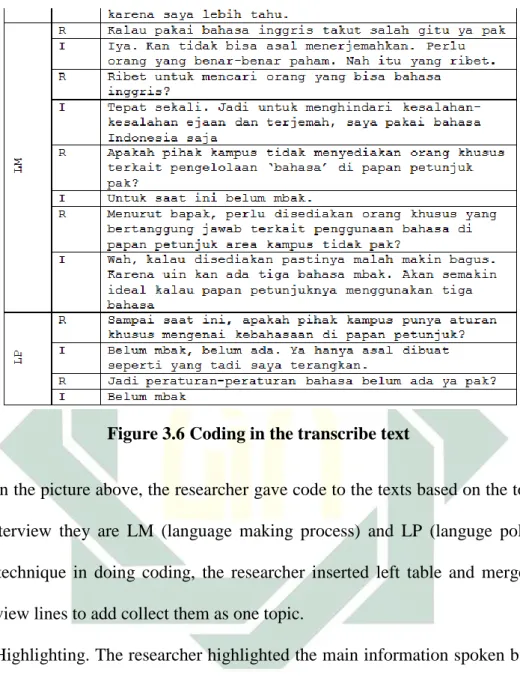
2. Coding. The researcher gave several code to divide the data based on the topic in the transcribe text.
LP : language-making process SP : sign-policy
Figure 3.6 Coding in the transcribe text
In the picture above, the researcher gave code to the texts based on the topics of interview they are LM (language making process) and LP (languge policy).
The technique in doing coding, the researcher inserted left table and merge the interview lines to add collect them as one topic.
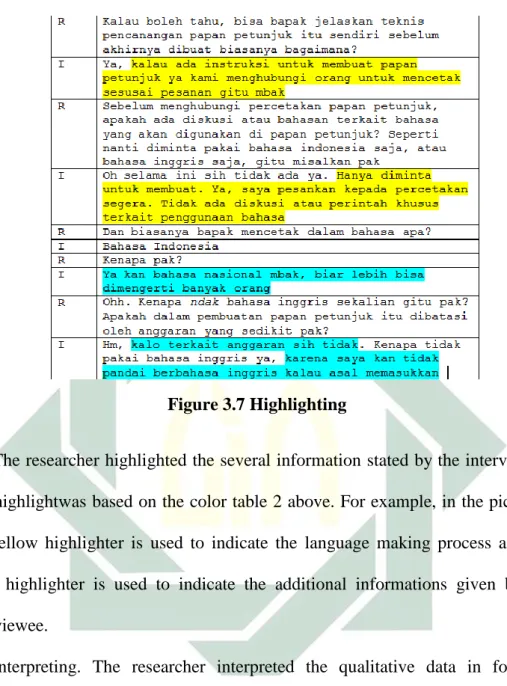
3. Highlighting. The researcher highlighted the main information spoken by the interviewee. This technique helped the researcher to pick quotation that relates to the topic to be added in the findings.
Table 3.1 Color Coding
sign-making process sign-policy
additional information
Figure 3.7 Highlighting
The researcher highlighted the several information stated by the interviewee.
The highlightwas based on the color table 2 above. For example, in the picture 3 the yellow highlighter is used to indicate the language making process and the tosca highlighter is used to indicate the additional informations given by the interviewee.
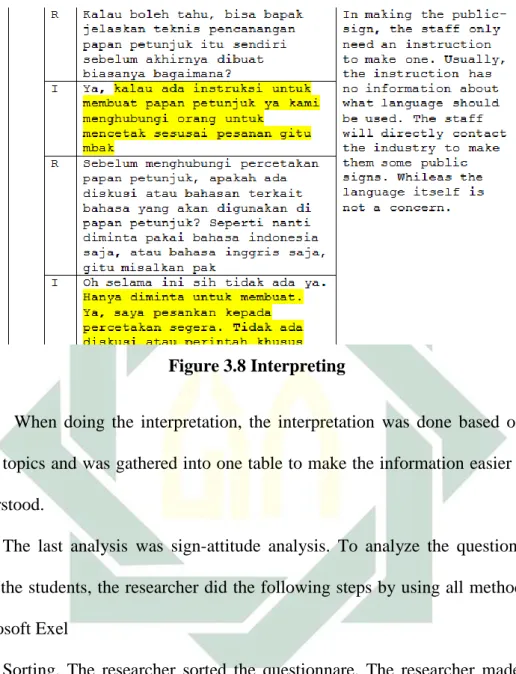
4. Interpreting. The researcher interpreted the qualitative data in form of dialogue into narrative text.
Figure 3.8 Interpreting
When doing the interpretation, the interpretation was done based on the same topics and was gathered into one table to make the information easier to be understood.
The last analysis was sign-attitude analysis. To analyze the questionnaire from the students, the researcher did the following steps by using all methods on Microsoft Exel
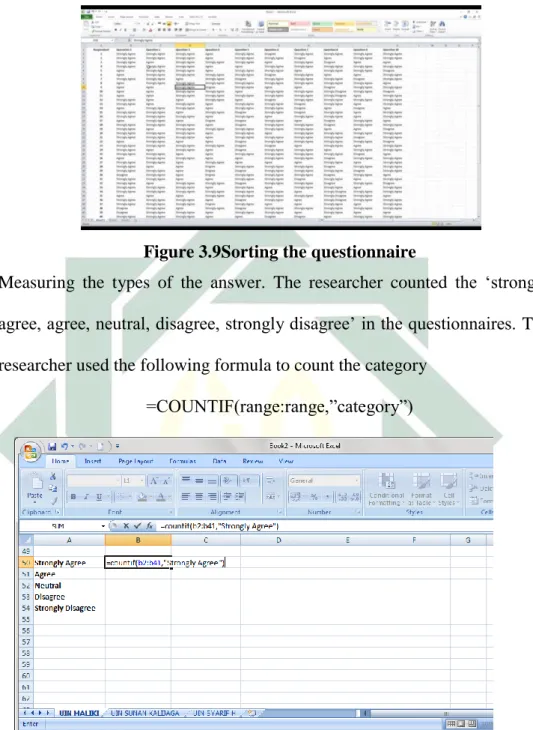
1. Sorting. The researcher sorted the questionnare. The researcher made one sheet for each university. Then, the researcher started to sort the questionnaire.
Figure 3.9Sorting the questionnaire
2. Measuring the types of the answer. The researcher counted the ‘strongly agree, agree, neutral, disagree, strongly disagree’ in the questionnaires. The researcher used the following formula to count the category
=COUNTIF(range:range,”category”)
Figure 3.10 Counting the Likert Scale category
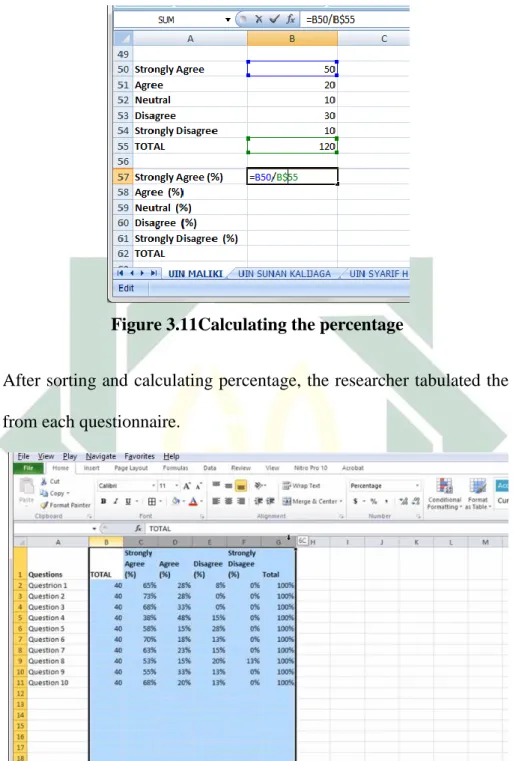
3. Calculating the percentage in each number of question in respondents. The researcher used the following formula
=RANGE/COLUMN$RANGE
Figure 3.11Calculating the percentage
4. After sorting and calculating percentage, the researcher tabulated the result from each questionnaire.
Figure 3.12 Tabulating the percentage
5. After measuring each questionnaire. The researcher calculated the general percentage from all answers. The scale was designed in a way that scale 1 for the negative attitude and scale 5 for positive attitude. Strongly agree (5
points), agree (4 points), neutral (3 points), disagree (2 points), and strongly disagree (1 point). Here is the table percentage for the score.
In measuring and calculating, the researcher usedthe following criteria to know the dominan answer from all of the questions.
Answer
0% - 19.99% Strongly disagree (unimportant at all) 20% - 39.99% Disagree (not important)
40% - 59.99% Neutral (fair) 60% - 79.99% Agree (important)
80% - 100% Strongly agree (very important)
to calculate the percentage score, the writerused the following formula
% = ∑ 𝑠𝑐𝑜𝑟𝑒
𝑌 𝑥 100
∑ 𝑠𝑐𝑜𝑟𝑒= total score
Y = highest score Likert scale x total respondents
After setting the scale, the writer was able to reveal about the respondents’
attitude toward the language in their linguistic environment.
6. Drawing conclusion. Lastly, the writer made a conclusion from the analysis.
CHAPTER IV
FINDING AND DISCUSSION
This chapter provides the analysis of the present study. It reports the results of the research analysis which appear in two subsections; those are findings and discussion. The findings and the discussion are provided in order to answer the problem of the study so that the research objective can be achieved.
4.1 Findings
The findings are provided to elaborate the analysis of the data to answer the problem of the study. There are three big sections to respond the three research question in this study. The three sections are further specified to detailed points based on the three dimension theory of Linguistic Landscape. The first part attempts to explain the physical appearance in top-down and bottom-up form of the signs in UIN Sunan Ampel and UIN Maulana Malik Ibrahim. The first point deals with the top-down and bottom-up in UINSA. The second point deals with the top-down and bottom-up signs in UIN Maulana Malik Ibrahim. The second section tries to counter the language policy in both universities. The first point will explain the language policy and process of creating public sign in UIN Sunan Ampel and the second point will elucidate the policy and process in UIN Maulana Malik Ibrahim. The third section responds the sign reader attitude toward public sign. The section is further broken down into UIN Sunan Ampel and UIN Maulana Malik Ibrahim.
4.1.1 Top-Down and Bottom-Up Signs
Linguistic Landscape three-dimensional theory consists of three parts;
physical dimension, political dimension, and experiential dimension. The first dimension to be discussed is the physical dimension. The physical dimension is defined by the presence of top-down and bottom-up sign. The top-down sign is referred to the public signage that is created by the campus authorities, meanwhile, bottom-up sign (also referred to as private signage) is created by the lower authorities or the students. Later, each sign from each authority is divided based on monolingual, bilingual and multilingual appearances.
4.1.1.1 UIN SUNAN AMPEL
In the following part, the elaboration will cover the first dimension of UIN Sunan Ampel linguistic landscape’s physical dimension. There are two kinds of signs that will be investigated they are; top-down signs which are created by campus authorities and bottom-up signs which are created by the university students.
4.1.1.1.1 Top- Down Sign in UINSA
In this part, the quantitative dimension of the study regarding the number and variety of visible language in the linguistic landscape of UINSA will be examined. There are many categories to classify the signs, but the present research will limit the characteristics based on the monolingual, bilingual and multilingual form of the signage.
The language distribution is seen through the monolingual, bilingual, and multilingual signs can be found in the surveyed area. The researcher took five
Faculty buildings to be investigated as campus’ top-down signage. The chosen buildings are; Arts and Humanities Faculty (FAH), Tarbiyah Faculty (FTK), Sharia Faculty, Islamic Economy Faculty (FEBI), and Technological Science Faculty.
Figure 4.1 Appearances of Top-Down Sign in UINSA
The type of sign whether they appear as monolingual, bilingual, or multilingual visual shows the language’s use of its people in its area. As it can be seen from the surveyed areas that have been investigated by the researcher mostly the five faculties still use monolingual sign as the percentage has the highest chart among another form of appearances. Mostly, the percentage of the monolingual signs appears more than 90%. Unfortunately, the existence of language-use combination is barely noticed within five faculties that have been investigated.
Arts Humanities Faculty whose Departments consist of English and Arabic Department has tied percentage of bilingual and multilingual signs (2.50%- 2.50%), Education Faculty has the highest percentage of bilingual signs’ existence
95% 92.40% 93.40%
100% 100%
2.50% 7.50% 6.50%
0%
20%
40%
60%
80%
100%
120%
Arts &
Humanities
Education Faculty
Sharia Faculty
Islamic Economy
Science Technology
Unilingual Bilingual Multilingual
(7.50%), followed by Sharia Faculty (6.50%). However, the Islamic Economy Faculty and Science-Technology Faculty have the least presence of bilingual and multilingual signage (0%).
However, to examine the most used language in public sign by UINSA the research has classified the above charts based on each type of sign specifically.
Table 4.1Indonesia, English and Arabic in UINSA Public Signs
Monolingual Bilingual Multilingual
Indonesia 240 (88.9%) ID+EN 9 (3.3%)
ID+EN+AR 1 (0.3%)
English 13 (4.8%) ID+AR 0
Arabic 2 (0.7%) EN+AR 5 (1.8%)
The monolingual signs were further classified into three groups: (1) Indonesia (88.9%), (2) English (4.8%), and (3) Arabic (0.7%). The bilingual sign is also sorted into three groups; (1) Indonesia-English (3.3%), (2) Indonesia- Arabic (0%), and (3) Arabic-English (1.8%). In the area, there are very rare to find a multilingual sign. Therefore in UINSA, based on surveyed area, only a single type of multilingual sign; Indonesia-English-Arabic with the percentage (0.3%).
Figure 4.2 Top Down Multilingual Sign in UINSA
It is quite clear that among the three languages, Indonesia (88.9%) language still sets on the most frequent language to be seen in public sign in many faculties building. The second language that appears most in public sign is English (4.8%). In addition, the comparison number of the photographed sign is quite far 240:13. Meanwhile, Arabic placed in the third position with the very least signage to be found in monolingual Arabic sign (0.7%).
It shows that in every faculty, the monolingual sign mostly used is Indonesia. This phenomenon could be happening because of the lack of language policy does not set in the area. Therefore, the language-in-use found is also merely using Indonesia because the aim of public signage for the students, lecturer, and staff is only based on clarity rather than expanding the globalizing the campus landscape.
When entering a language Department, one may expect to see many guidance, instruction, newsletter, or etc to be written in English/Arabic, particularly in UINSA where ilahiyat and human/natural sciences are taught. The globalized environment is expected to be sensed by students whose university aims to have a position in the international academic community. However, seen by the small landscape of Arts and Humanities Department, where the English Department and Arabic Department take place, the instructions are still mostly written in monolingual form, mainly in Indonesia language.
4.1.1.1.2 Bottom-Up Sign in UINSA
In the following paragraphs, the quantitative findings from bottom-up signage analysis will be examined. The creation of signage within a certain space
is created by two authorities; the public bureaucracies and the personal institutions (Rafael, 2006). The public sign created by the public authorities such as government is called top-down.
Figure 4.3 Appearances of Bottom-Up Sign in UINSA
Meanwhile, the private sign created by personal institutions such as shop, company, etc is called bottom-up. In the present research of Islamic Universities’
Linguistic Landscape, the unofficial signs may be in form wall magazine, department students association’s event brochure or notice, etc. To highlight precisely, the signs must be noticed as the notion products of the university students toward the campus audience.
Roughly, the percentage of multilingual sign (0%) does not exist among the five faculties. There has not been any flyer or brochure written by students union by using three languages. Meanwhile, the appearances of bilingual signs are also quite rare to be found. Among the five faculties, there are only 29.50%
93%
100.00%
88.80% 89%
100%
7.30%
0.00%
11.10% 11.10%
0%
0%
20%
40%
60%
80%
100%
120%
Arts &
Humanities
Education Faculty
Sharia Faculty
Islamic Economy
Science Technology
Unilingual Bilingual Multilingual
bilingual signs produced by the students within the five buildings that have been examined. However, the monolingual signs produced by the students are dominant. Education Faculty and Science Technology Faculty are two buildings whose signs written only in monolingual visual (100%). Meanwhile, the monolingual sign percentage in other faculties are quite varying (93%) in Arts and Humanities, (88.8%) in Sharia Faculty, and in Islamic Economic Faculty (89%). It can be concluded that mostly the student's unions are producing the sign within monolingual form either in the single language of Indonesia, English or Arabic only.
However, it is also important to examine further about which language among Indonesia, English, and Arabic have the dominant usage within students’
bottom-up signs. Therefore, the specific information of figure 2 is presented in the following table:
Table 4.2 Indonesia, English and Arabic in UINSA Private Signs
Monolingual Bilingual Multilingual
Indonesia 84 (71.1%) ID+EN 5 (4.23%)
ID+EN+AR 0 (0%) English 23 (19.4%) ID+AR 1 (0.84)
Arabic 5 (4.23%) EN+AR 0 (0%)
The total of the compiled signs referred to as bottom-up sign in UINSA is 118 including the monolingual, bilingual and multilingual signs. According to the table, it is clear to mention that multilingual sign does not exist in bottom-up signs (0%). Meanwhile, among the signs, the bilingual signs take part in 6 out of 118 with the dominant appearance of Indonesia and English combination (4.23%),
followed by Indonesia-Arabic combination (0.84%) and have zero sign in English-Arabic combination (0%).
It shows that combining two languages in UINSA bottom-up signage is not quite popular. Despite the combination of Indonesia-English sign takes the highest number within bilingual signs (4.23%), the comparison signs between bilingual sign and monolingual sign are quite significant (112 signs to 6 signs).
Therefore, in bottom-up signage, the monolingual signs still become the dominant sign produced by the lower authorities of campus.
Among the total number of bottom-up signage, the monolingual signs produced by the students are strongly dominant. The five faculties (Arts and Humanities, Education Faculty, Sharia, Science and Technology, and Islamic Economics) gathered 118 total numbers of bottom-up signs and 112 out of 118 depict the appearance of monolingual signs. In addition, the table also shows the popularity in using language within monolingual signs either in Indonesia, Arabic or English. Indonesia as monolingual signs are still dominating the list with 84 signs (71.1%), followed by English with 23 signs (19.4%) and the least is Arabic with 5 signs (4.23%).
To see Bahasa Indonesia still takes the dominant position in top-down and bottom-up signage is understandable since many parties consider the aims of the sign to reach clarity. Indonesia is mainly used in official and unofficial signs on the campus as the mother language. The usage of Bahasa Indonesia language will deliver the intention of the message more precisely rather than in another language.
However, considering the aim of UINSA in gaining world-class university title and the increasing number of involving the campus within international competence, the language environment of campus must be set to be more ready in receiving further multilingual cooperation. Therefore, the existence of English and Arabic notices and signs are supposedly being supported by all campus authorities.
4.1.1.2 UIN MALIKI
In the following part, the elaboration will cover the first dimension of UIN Maulana Malik Ibrahim’sLL physical dimension. There are two kinds of signs that will be investigated they are; top-down signs which are created by campus authorities and bottom-up signs which are created by the university students.
4.1.1.2.1 Top-Down Sign in UIN MALIKI
Figure 4.4 Appearances of Top-Down Sign in UINMALIKI
69% 69.20%
95.20%
89%
95%
31.00%
26.80%
2.30%
9.00%
4.00%
0%
10%
20%
30%
40%
50%
60%
70%
80%
90%
100%
Arts &
Humanities
Tarbiyah Sharia Islamic Economy
Saintek
Unilingual Bilingual Multilingual
Referring to the chart, the appearance of monolingual signs among five buildings is still dominating. The percentages of monolingual signs are varying from the least (62%) in Arts and Humanities Faculty to the most (95.20%) in Shariah Faculty. Meanwhile, the presence of bilingual signs is quite impressive within the taken five buildings considering the high percentage in Arts and Humanities the bilingual signs reached (31.00%). Meanwhile, in Tarbiyah Faculty they are (26.80%), followed by Islamic Economics in (9%) percentage, Science Technology in (4%) percentage, and Sharia Faculty with the least appearance of bilingual signs in (2.40%) percentage.
It is interesting to note that Arts and Humanities Faculty in UIN Maulana Malik Ibrahim Malang has the least percentage of monolingual signs (69%) and the highest chart in bilingual signs (31%) but has no multilingual signs at all among the five faculties. Meanwhile, in other faculties, the multilingual signs are still able to find even though the percentage of signs are quite low.
Even though the percentage is showing in a maximum score of one hundred percent, the raw data taken from a photograph of each Faculty is varying in number. Arts and Humanities have 58 data, the Education Department has 26 data, Sharia has 42 data, Islamic Economy has 65 data, and Science Technology has 335 data. The difference can happen because the width of the faculty area is different from one to another. Science and Technology Faculty and Arts and Humanity Faculty have the whole building as their own Faculty. Meanwhile, Economics, Sharia, and Tarbiyah share the same single building.
To see the allotment of language use in monolingual, bilingual and multilingual signage from UIN MALIKI seems to have no big difference to UINSA. Both of the universities have few numbers in the existence of multilingual and bilingual signage. However, when the language distribution is broken down into Indonesia, English and Arabic language the differences are noticed.
Table 4.3 Indonesia, English and Arabic in UIN MALIKI Public Signs
Monolingual Bilingual Multilingual
Indonesia 367 (68.3%) ID+EN 14 (2.6%)
ID+EN+AR 10 (1.8%) English 96 (17.8%) ID+AR 6 (1.1%)
Arabic 17 (3.1%) EN+AR 27 (5%)
The monolingual signs were further classified into three groups: (1) Indonesia 68.3%, (2) English 17.8%, and (3) Arabic 3.1%. The bilingual sign is also sorted into three groups; (1) Indonesia-English 2.6%, (2) Indonesia-Arabic 1.1%, and (3) Arabic-English 5%. In the area, multilingual sign is found. The multilingual sign produced by campus authority is founded 10 1.8% in total.
4.1.1.2.2 Bottom-Up Sign in UIN MALIKI
The figure below shows the percentage as monolingual, bilingual and multilingual signs. The monolingual data are represented in blue, bilingual in red and the multilingual in green. However, it is clear to see that the multilingual signs produced by the lower authorities of campus are not seen in the charts. It shows that the multilingual signs are not being produced at all by the students union.
Figure 4.5 Bottom-Up Sign in UIN Maulana Malik Ibrahim
On the other hand, the monolingual signs are still dominant among another form of signs in bottom-up data. As seen in the charts, Education Faculty stands as the Faculty which has (100%) data as monolingual signs. Meanwhile, Science and Technology Faculty (60%) has the least number of monolingual signs along with Sharia Faculty (60%). Then, the Islamic Economy Faculty (94%) and Arts and Humanities Faculty (93%) share a very slight difference number of monolingual signs.
Furthermore, the bilingual signs are also revealed in the chart. Education Faculty which has all monolingual data shows no appearance in red charts color which stands for a bilingual sign. Similar to monolingual signs data, Sharia Faculty and Science and Technology Faculty share the same number of data in term of bilingual signs (40%). Meanwhile, Arts and Humanities Faculty has
93%
100.00%
60.00%
94%
60%
7.14%
0.00%
40.00%
6.25%
40%
0%
20%
40%
60%
80%
100%
120%
Arts &
Humanities
Education Faculty
Sharia Faculty Islamic Economy
Science Technology
Unilingual Bilingual Multilingual