INTRODUCTION
Sample preparation is one of the steps in analysis which able to determine efficacy of analysis, because it can establish reproducibility and recovery of the matrix interference1. The presence of metabolites of the parent compound in analysis using biological material should be observed the existence of metabolites because the analysis of a drug may give misinter-preting results2. Therefore it was needed to explore the method that can accurately identify both the parent drug and metabolites. Solid phase extraction (SPE) is recent trends in sample preparation for reduction solvent volume and time1b,3. In this work, the application of solid phase extraction has been carried out in determination of lead compounds aromatherapy in blood plasma of mice after inhalation essential oil. A lead compound is one of fulfilled in standardization of Indonesian traditional medicines1a,4.
Leading study of this type of research has been performed by Kovar et al.5. They investigated the efficiency of the essential oil of rosemary and its main constituent, 1,8-cineol. The locomotor activity of the test animal increased signifi-cantly when they inhaled this oil. The finding recently published by Buchbauer et al.6 after investigation of 40 fragrance and 6 essential oils to observe their ability to decrease the locomotor activity of the test animal.
The study carried out by Sangat and Roematyo7 in the fields etnopharmacology indicated that there were 49 species
Off-Line SPE-GC/MS Analysis of Lead Compounds Aromatherapy in Blood
Plasma of Mice of Essential Oils Materials from Indonesian Aromatic Plants
MUCHTARIDI MUCHTARIDI*
and IDA MUSFIROH
Division of Pharmacochemistry, Faculty of Pharmacy of Universitas, Padjadjaran Jl. KM 21.5, Bandung-Sumedang, Jatinangor 45363, Indonesia
*Corresponding author: Tel: +62 22 7796200; E-mail: [email protected]
Asian Journal of Chemistry; Vol. 24, No. 11 (2012), 5124-5128
(Received: 22 September 2011; Accepted: 11 June 2012) AJC-11577
The aim of this study was to evaluate the analysis method for identify lead compounds aromatherapy in blood plasma by using off-line SPE-GC/MS. Identification and quantification of active compounds in the blood plasma were carried out with GC/MS analysis after the mice experienced after 0.5, 1.0 and 2.0 h inhalation. The blood plasma of three mice were collected in heparin tube and the volatile compounds were isolated and concentrated by the C-18 solid phase extraction column with methanol and bidistilled water mixture (60:40) as the solvent. The recovery analysis was increased up to 90 %. The reproducibility of extraction methods might be qualified with the indicated value of the variation coefficient less than 15 %. This method successfully detected all the volatile compounds in the blood plasma which the concentration was relatively low (µg/mL or ppm).
Key Words: Solid phase extraction, Aromatherapy, Essential oils, Inhalation and GC-MS.
of Indonesian plants of 22 families that was used as traditional aromatherapy. However the publication about active volatile compounds of aromatical plants were only few, especially for Indonesian plant.
In previous publication8
, we studied four Indonesian aromatic medicinal plants; (Melaleuca leucadendron L.), basil (Ocimum formacitratum L.), lemongrass (Cymbopogon citratus L.), ki lemo (Litcea cubeba L.) and nutmeg seeds (Myritica fragrans Houtt) that located in West Java area. Prior to analyses active compounds from these spices plants used in blood plasma of mice, we used eucalyptus (Meulaleuca leucadendron L.) to validation these analysis. Here we integrated all the data to strengthen the validity of the analysis we have done that might be considered. In addition, eucalyptus was used in this investigation, because almost of all part Indonesia uses euca-lyptus as aromatherapy especially to baby since the long time9
.
EXPERIMENTAL
Eucalyptus leafs (Meulaleuca leucadendron Linn) was taken from Kuningan, West Java. Specimens are identified by the Herbarium Laboratory, Department of Biology, Faculty of Mathematics and Natural Sciences, Universitas Padjadjaran and voucher specimens are stored in the herbarium of Biology Department, Faculty of Mathematics and Natural Sciences, Universitas Padjadjaran.
-20 ºC after addition of sodium sulfate. The 2.31 % essential oil of eucalyptus leafs was obtained.
The 2 to 3 months old male mice weighing 25 to 30 g were used. The mice were adapted for one week to the labo-ratory in which locomotor activity experiments were conducted and were selected for wheel rotations of between 150 to 300 before the experiments were started.
Methanol p.a. (Merck) was used as mobile phase for SPE. Heparin tubes (Boehringer) were used for blood collection. Pure lavender (Lavandula officinalis) oils were obtained from Martina Bertho. Alkane standards C8-C20, C21-C40, 1,4-dichlo-robenzene and myristicin and safrole were obtained from Sigma.
General procedure
Isolation of essential oil: Dry samples (1 kg of leaf) on steam-distillation in Monaco Lembang, West Java, for 3 h to isolate the essential oil fraction. Oil stored at -20 ºC after the addition of sodium sulfate.
GC/MS analysis: Measurements were performed using a QP-5050A (Shimadzu) gas chromatograph coupled to a VG Autospect Mass Spectrometer at 70 eV, 40-550 amu with a fused silica capillary column (DB-5MS, 30 m × 0.25 mm) using helium as a carrier gas and with temperature progra-mming from 60 ºC/5 min to 300 ºC/1 min (10 ºC/ min) for blood plasma and 60 ºC/5 min to 300 ºC/2 min (10 ºC/ min) for essential oils. The MS was operated using an interface temperature of 240 ºC and an electron impact ionization of 70 eV with a scan mass range of 40-350 m/z (sampling rate of 1.0 scan/s).
Qualitative analysis: Identification of the compounds was conducted by comparing their linear retention indices (LRI) with literature values and their mass spectral data with those from the MS data system (Willey-229 lib., Nist-62 lib. and Nist-12 lib)10
. Linear retention indices were calculated using GC data of a homologous series of saturated aliphatic hydrocarbons (C8 to C40) separated on the same column using the same conditions as for GC analysis of the essential oils and the blood samples. The blood samples were collected from the corner parts of the eyes using capillary tubes and placed in a heparin tube.
Quantitative analysis: Detailed analysis was performed using a modification of the methods of Jirovetz et al.11
and Kovar et al.5
. The blood samples (500 to 600 µL), obtained according to Jirovetz11a
, were centrifuged (1800 rpm/10 min) at room temperature and concentrated on a C18-column (100 mg). Volatile compounds were separated using a mobile phase of the mixture of methanol-bidistilled water (60:40). 5 µL were injected into the GC-MS. Quantification of the volatile compounds in the blood samples was accomplished using 1,4-dichlorobenzene 0.5 % (5 mg in 1 mL blood plasma as an internal standard according to the following eqn. 1:
6
where C = concentration (g/g); IS = GC peak area of internal standard; A = GC peak area of compounds of essential oils; % EO = yield of essential oils.
RESULTS AND DISCUSSION
Composition of essential oils of eucalyptus leafs: There were 52 compounds present in the eucalyptus oil. The compo-sition of essential oils of eucalyptus leafs was dominated 1,8-cineole which is found to be 22.45 %. This content was lesser when compared with the data contained on Proscea (30-50 %). The next component was based on percentages of α-terpineol (12.45 %), caryophillene (6.95%), β-pinene (5.74 %), α-humulene (4.70 %), β-selinene (3.82 %), β-myrcene (3.58 %), α-selinene (2.9 %) and α-terpenyl acetate (2.74 %).
Application off-line SPE-GC/MS for analysis of lead compounds in blood plasma of mice after inhalation of essential oils of spices: Volatile compounds may be difficult to attract of biological materials in analysis, because volatile compounds is very non-polar compound and small quantity in bloods or urine. We successfully applied SPE methods with methanol and water (60:40) as solvent to isolate volatile comp-ounds in the blood plasma before detection and quantification of the compounds by GC-MS8b
. This method might reduce solvent volume and time and increasing of this analysis to 90 %. Surprisingly, this method also increased reproducibility and recovery of the matrix interference and reduced interference from blood plasma matrix as shown in Fig. 2, even reprodu-cibility was shown consistently on replication of analysis in which retention time of each interesting compounds were pro-duced closely as shown Table-1 and Fig. 1. The repeatability criteria of the extraction method is expressed by the variation coefficient of percentage of the acquisition value of recovery, coefficient of variation that allowed less than 15 %12
. The analysis of variation coefficient in quantification volatile compounds of blood plasma of mice after inhalation leaf oils of Meulaleuca lecadendron was less than 15 % which means that this method qualifies reproducible method of analysis12
.
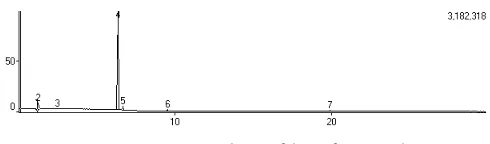
Fig. 1. One (replication no. 2 in Table-1) of three of total ion chromatogram of blood plasma sample after 0.5 h inhalation of basil leaves oils
Fig. 1a showed that many interference in sample were detected by GC-MS even volatile compound could not be detected in sample, whereas Fig. 1b showed clearly which volatile compounds could be detected by application of SPE C-18 in preparation even though 6 volatile compounds successfully were determined.
In this analysis, the compounds identified in blood plasma with high bioavailability after 0.5 to 2 h of exposure are likely responsible for the observed locomotor inhibition and are thus lead compounds6.
Compounds of essential oils of eucalyptus leafs detected in blood plasma of mice after inhalation with preparation solid phase extraction.
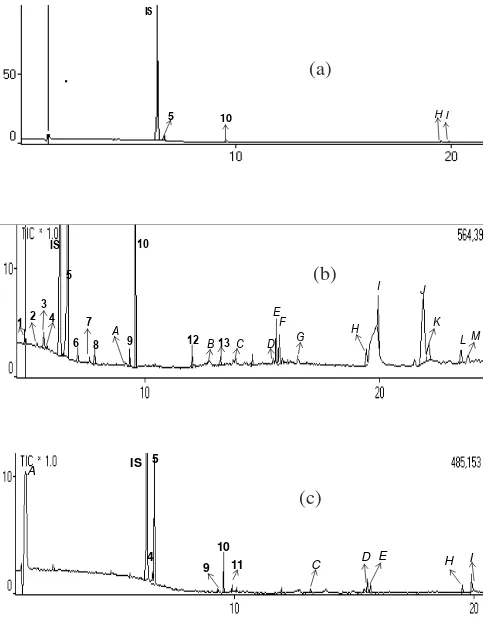
Fig. 2. Total ion chromatogram of blood plasma sample after one hour inhalation of basil leaves oils. (a) sample preparation without aided SPE, no volatile compounds could be detected in blood plasma. (b) Sample preparations by using SPE C-18, some volatile compounds were found in blood plasma. IS : Internal standar (1,4-dichlorobenzene): 1: 1,8-cineol, 2: linalool, 3: 4-terpineol, 4: α -terpineol, 5: linalyl acetate, 6: α-Humulena
0.5, 1.0 and 2.0 h, while α-pinene detected after inhalation for 0.5 h even though its concentration increased after inhalation of 1 h of essential oils of eucalyptus leafs as shown in Table-2. 1.8-Cineol, α-terpineol also is detected in blood plasma of mice after inhalation of ki lemo bark, basil leaf and nutmeg seeds oils in previous work8a
.
Solid phase extraction using non polar stationary phase C-18 could removes protein and lipid from sample biological fluid. Fig. 3 indicated that peak no.1 (1,8-cineol), 3 (citronellal), 7 (α-terpineol) and 8 (citronelol) always appear on the inhalation of 0.5, 1 and 2 h. Their concentration increased in blood plasma level after inhalation 1 h compared than 0.5 and 2 h.
5 10 HI
4 5
10 11 9 IS A
C D E H I
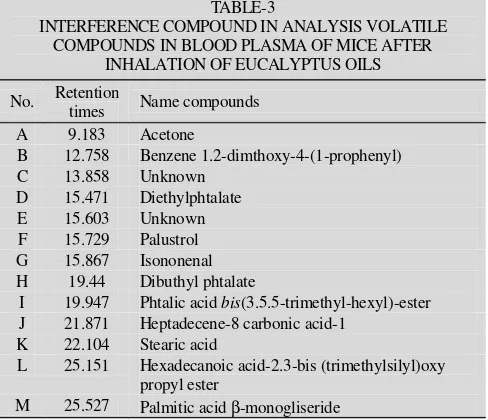
Fig. 3. Total ion chromatogram of blood plasma sample after inhalation of eucalyptus oils. (a) chromatogram of the sample after 0.5 h inhalation, (b) chromatogram of the sample after 1.0 h inhalation, (c) chromatogram of the sample after 2 h inhalation. IS: Internal standard (1,4-dichlorobenzene). Peak of A until M was interference compound in analysis as shown in Table-3
TABLE-1
ANALYSIS OF VOLATILE COMPOUNDS IN BLOOD PLASMA AFTER INHALATION OF ESSENTIAL OILS OF EUCALYPTUS (M. leucadendron L.) LEAFS AT 0.5 h INHALATION
Inhalation 0.5 h
No. Compound name Replication
LRI Exp.b
Concentration (µg/mL) X(averages)
Variation coefficient (%)
1 nd nd
2 nd nd
1 Unknown
3 nd nd
- -
1 nd nd
2 nd nd
2 Unknown
3 nd nd
- -
1 939 0.01
2 nd 0
3 α-Pinene
3 938 0.02
0.01 0.005
1 - 4904
2 - 4949
4 1,4-Dichlorobenzene*
3 - 4894
4915.67 0.59
1 nd nd
2 nd nd
5 unknown
3 nd nd
- -
1 1036 41.5
2 40.8
6 1,8-Cineole
3 39.9
40.73 1.97
1 1176 13.3
2 1177 12.9
7 α-Terpineol
3 1176 13.1
13.1 1.53
*Internal standard of 1,4-dichlorobenzene was added 5 mg in 1 mL blood plasma of mice which inhaled eucalyptus leaf oils.
(a)
(b)
(c) (a)
(b)
10 20 50
0
IS
10 20
2.5
0
TABLE-3
INTERFERENCE COMPOUND IN ANALYSIS VOLATILE COMPOUNDS IN BLOOD PLASMA OF MICE AFTER
INHALATION OF EUCALYPTUS OILS
No. Retention
times Name compounds
A 9.183 Acetone
B 12.758 Benzene 1.2-dimthoxy-4-(1-prophenyl)
C 13.858 Unknown
D 15.471 Diethylphtalate
E 15.603 Unknown
F 15.729 Palustrol G 15.867 Isononenal H 19.44 Dibuthyl phtalate
I 19.947 Phtalic acid bis(3.5.5-trimethyl-hexyl)-ester J 21.871 Heptadecene-8 carbonic acid-1
K 22.104 Stearic acid
L 25.151 Hexadecanoic acid-2.3-bis (trimethylsilyl)oxy propyl ester
M 25.527 Palmitic acid β-monogliseride
Fig. 3 showed that the noise of the basic line of the chroma-tograms was cleaner than the previous analysis which has been not aided SPE-C18 column (Fig. 4). No volatile compounds detected in Fig. 4, but almost all metabolite compounds from the blood identified on the chromatogram as shown in Table-4.
Fig. 4. Total ion chromatogram of blood plasma sample after 0.5 h inhalation of eucalyptus oils without aided SPE-C18 that compounds detected were shown in Table-4
The results showed that non-polar compounds that being interference in the analysis had been held by octadecyl-silica or C18. The stationary phase of C18 was based on hydropho-bic interaction that volatile compounds could be separated by selective sorption rather than the washing procedure alone13. Hydrophobic surface interacted with hydrophobic chain of
TABLE-2
ACTIVE VOLATILE COMPOUNDS IDENTIFIED IN BLOOD AFTER INHALATION OF ESSENTIAL OILS OF EUCALYPTUS LEAFS AT DIFFERENT DURATIONS OF INHALATION
Inhalation 0.5 h (Rc
= 89 %) Inhalation 1.0 h (Rc
LRI reference in Adams (1995) with DB5 column, b
LRI experiment with DB5-MS column, c
Recovery (n = 2) was calculated on the basis of comparation between 1,4-dichlorobenzene (methanol diluted) in blood plasma and 1,4-dichlorobenzene in methanol only.
TABLE-4
COMPOUNDS IDENTIFIED IN BLOOD PLASMA OF MICE AFTER INHALATION OF ESSENTIAL OILS OF EUCALYPTUS OILS LEAFS AT 0.5 h OF INHALATION
No. Retention
times Name compounds
1 13.651 2-Propenoic acid 3-(4-methoxyphenyl) ethyl ester 2 19.951 Oxycarboxamide-2-ethyl-3-propyl
3 22.304 D-Norandrostan-16-ol-acetate. (5-α -16-β) 4 23.483 Testosterone
5 23.970 Palmitic acid 6 25.197 Pregnolene 7 26.993 Elaidic acid
8 27.415 Ergost-5-en-3-ol. (3-β) 9 27.907 Oxanamide
10 28.367 5-Cholestone-3-β-ol-7-one 11 28.650 Stimagsterol
12 28.864 Stigma-5-en-3-ol-(3-β)
13 29.241 3- Cyclopropyl (1.2)-5-cholest-1-en-3-one
interference or volatile compounds. The compounds that have strong hydrophobic would be held on first by stationary phase4b. These reasons explained why compounds such as in Tables 3 and 4 could be eliminated from analyte, thus recovery and sensitivity of analysis would increases.
On the other hand, solid phase extraction methods successfully reduced solvents in extraction and isolation volatile compounds, because only 1000 µL of methanol was discarded for every running analysis.
Conclusion
Application of off-line solid phase extraction (SPE-C18) and GC/MS analysis in preparation samples could detects lead compounds in blood plasma of mice after inhalation essential oils of spices. Reliability analysis can be seen from the recovery that reached 90 % and the reproducibility which has a variation coefficient less than 15 % which meets the requirements method of analysis.
ACKNOWLEDGEMENTS
research, financial support through the DIKS and LISTAR 2004 research grant and Prof. Gerhard Buchbauer, M.Phil and Dr. L. Jirovetz, M.Phil of Institute Pharmaceutical Chemistry of Vienna University for the gift of their paper related to this research.
REFERENCES
1. (a) C. Deng, N. Liu, M. Gao and X. Zhang, J. Chromatogr. A, 1153, 90 (2007); (b) R. Saari-Nordhaus, L.M. Nair and J.M. Anderson Jr, J. Chromatogr. A, 671, 159 (1994); (c) R.M. Montgomery, R. Saari-Nordhaus, L.M. Nair and J.J.M. Anderson, J. Chromatogr. A, 804, 55 (1998).
2. R.D. McDowall, E. Doyle, G.S. Murkitt and V.S. Picot, J. Pharm. Biomed. Anal., 7, 1087 (1989).
3. I.K. Henderson, R. Saari-Nordhaus and J.M. Anderson Jr, J. Chromatogr. A, 546, 61 (1991).
4. (a) H. Kataoka, Trends Anal. Chem., 22, 232 (2003); (b) E. Bacalum, A. Tanase and V. David, In Analele Universitatii din Bucuresti, Vol. 19 (2010).
5. K.A. Kovar, B. Gropper, D. Friess and H.P. Ammon, Planta Med., 53, 315 (1987).
6. G. Buchbauer, L. Jirovetz, W. Jager, C. Plank and H. Dietrich, J. Pharm. Sci., 82, 660 (1993).
7. H. Sangat, Roematyo Simposium Nasional I Tumbuhan Aromatik APINMAP, Bogor (1996).
8. (a) Muchtaridi, A. Diantini and A. Subarnas, Pharmaceuticals, 4, 590 (2011); (b) K.A. da Silva Rocha, J.L. Hoehne and E.V. Gusevskaya,
Chem. Eur. J., 14, 6166 (2008).
9. (a) B. Cooke and E. Ernst, Br. J. Gen. Pract., 50, 493 (2000); (b) K. Heyne, Tumbuhan Berguna Indonesia; Yayasan Sarana Wijaya: Jakarta (1987); (c) H.M. Feinblatt, J. Nat. Med. Assoc., 52, 32 (1960). 10. R.P. Adams, Identification of Essential Oil Components by Gas
Chromato-graphy/Mass Spectroscopy, Allured Publishing Corporation: Illinois (1995).
11. (a) L. Jirovetz, G. Buchbauer, W. Jager, A. Woidich and A. Nikiforov,
Biomed. Chromatogr., 6, 133 (1992); (b) L. Jirovetz, W. Jager, G. Buchbauer, A. Nikiforov and V. Raverdino, Biol. Mass Spectrom., 20, 801 (1991). 12. Y. Harahap, U. Mansur and T. Sinandang, Majalah Ilmu Kefarmasian,
III, 22 (2006).