EEG based Pattern Recognition Method for
Classification of Four Mental Tasking
Preliminary study for stroke survivors in Indonesia
Wahyu Caesarendra
a*, Mochammad Ariyanto
a,
Syahara U. Lexon
a, Elta D Pasmanasari
ba
Department of Mechanical Engineering Diponegoro University
Semarang, Indonesia
bDepartment of Neurology
Diponegoro University Semarang, Indonesia *[email protected]
Cindy R. Chang
School of Nursing and MidwiferyUniversity of Wollongong Wollongong, Australia
Joga D. Setiawan
Department of Mechanical Engineering Universiti Teknologi Petronas
Perak, Malaysia
Abstract—This paper presents a result of pattern recognition
method for different mental tasking of 8 volunteers. The EEG data used in this paper were acquired from 8 Indonesian volunteer using Emotiv EEG device with 16 channels. 24 feature extraction methods including time-domain and statistical features are applied to the EEG signal. Feed forward artificial neural network (ANN) is employed for classification. This is the preliminary study in developing a pattern recognition method for stroke survivors in Indonesia. The paper aims to investigate the reliable EEG signal from 14 channels. The results show that among 14 EEG channels, channel F7 and F8 are better in classification than other channels. The test classification of channel F7 and F8 is 66.7%.
Keywords—artificial neural network; classification; EEG signal; feature extraction
I.! INTRODUCTION
Besides heart diseases, cancer, and lung disorders, stroke has become one of the risk factors for mortality in Indonesia. Recent study stated that stroke is accounted for 15.4% of all deaths and the prevalence of stroke has reached 0.8% [1]. In some case, stroke can be overcome and the person can live an almost-normal life. Unfortunately in other cases, the disabilities are severe and permanent. The hardest part of it is the recovery journey. Recovering from a stroke is challenging, both emotionally and practically for the person him/herself as well as his/her family and friends. Another recent study explained the burden of a disrupted life for person who survives from stroke [2]. According to this study, the stroke survivors are struggling even with their activities of daily living. ‘I feel bad, my heart is broken’ stated one of the survivors because she is now unable to do things she used to enjoy doing by herself.
In 2008, there was a novel design of a wheelchair for stroke patients by a group of expertise from Taiwan [3].
Having a wheelchair is important for the stroke survivors to be independent in at least one of the activities of daily living, which is mobility. This study highlighted that wheelchair is the most used mobility aid for the stroke survivors because of its stability. However, the manual wheelchair still needs to be operated by the person him/herself. The manual wheelchair is actually targeted those people with healthy upper limbs. Moreover, big amounts of energy need to be used in order to move the manual wheelchair around. However thanks to the technology improvement, now we can actually do something rather than sit still and watch these people suffer even more.
Brain Computer Interface (BCI) is a method where the signals from neuronal activity in the brain i.e. EEG signals are being interfaced with a computer. This method had proved to be effective in helping patients with severe motor deficits to control remote devices such as computer cursor or even an artificial limb [4]. This method of using BCI to restore function in neurologically impaired patients has become a great interest. Starting from mobile phone companies, game developers, even the U.S. Army had sponsored investigators to develop helmets which can direct mental control of military systems by thought alone. Therefore, the aim of this preliminary study is to develop a pattern recognition method with the use of BCI which enables the stroke survivors to move around without the need to physically move or control anything. The reason behind this idea was since it has been very stressful for stroke survivors when they are not only unable to do what they use to enjoy but also being unable to move around independently. This fact will impact they family as well as they recovery in the future. Having such as stressful mind will lead the stroke survivors to feel worthless which will further lead to the survivors not being compliance towards the treatment and further delay the recovery process or even in the worst case scenario, refuse any sort of treatment towards the recovery journey.
2015 International Conference on Automation, Cognitive Science, Optics, Micro Electro-Mechanical System, and Information Technology (ICACOMIT), Bandung, Indonesia, October 29–30, 2015
In present study, a pattern recognition method based on feature extraction and classification method is developed. This is the preliminary study in developing a reliable wheelchair based BCI for stroke survivors. Once the robust pattern recognition developed, the method will be embedded in the wheelchair for stroke survivors. The most important thing that has to consider in designing wheelchair for the stroke survivors is how accurate the classification to distinguish couple of mental tasking such as thinking forward, backward, right and left.
II.!PATTERN RECOGNITION METHOD
A.!Feature Extraction
A number of studies have employed feature extraction methods for EEG signals. In this paper we focused on the signals that have been commonly used in electromyography (EMG) signals and vibration signals. A brief discussion of the feature extraction methods are presented as follows
•! Average Amplitude Change (AAC): is nearly equivalent to Waveform Length (WL) feature, except that wavelength is averaged [5]
1 1 1
1 N
i i
i
AAC x x
N
=
+ =
=
∑
− (1)•! Difference Absolute Standard Deviation Value (DASDV): is look like RMS feature, in other words, it is a standard deviation of the wavelength [6]
(
)
1
2 1 1
1 1
N
i i
i
DASDV x x
N
−
+ =
= +
−
∑
(2)
•! Integrated EMG (IEMG): is normally used as an onset detection index in EMG non-pattern recognition and in clinical application [7, 8]
1 N
i i
IEMG x
=
=
∑
(3)•! Log detector (LOG): like the V-Order (V) feature, this feature also provides an estimate of the muscle contraction force (e.g. contraction force) [9, 10]
( )
1 1
log N
i i
x N
LOG=e ∑= (4)
•! Mean Absolute Value (MAV): MAV is one of the most popular used in EMG signal analysis. It is similar to IEMG feature which is used as an onset index, especially in detection of the surface EMG signal for the prosthetic limb control [11], [10]
1
1 N i i
MAV x
N =
=
∑
(5)•! Modified Mean Absolute Value type 1 (MAV1): MAV1 is an extension of MAV feature [12, 13]
1
1 1
1, 0.25 0.75
0.5, N
i i i
i
MAV w x
N
if N i N
w
otherwise = =
≤ ≤ "
=#
$
∑
(6)•! Modified Mean Absolute Value type 2 (MAV2): MAV2 is an expansion of MAV feature which is similar to the MAV1 [12, 13]
1 1 2
1, 0.25 0.75
4 , 0.25
4( ) , N
i i i
i
MAV w x
N
if N i N
w i N else if i N
i N N otherwise
= =
≤ ≤ "
#
=$ <
# − &
∑
(7)
•! Root Mean Square (RMS): RMS is another popular feature in analysis of the EMG signal [14], [6]. It is modeled as amplitude modulated Gaussian random process whose relates to constant force and non-fatiguing contraction
2
1
1 N i i
RMS x
N =
=
∑
(8)•! Simple Square Integral (SSI) or integral square uses energy of the EMG signal as a feature [15]
2
1
N i i
SSI x
=
=
∑
(9)•! Absolute value of the 3rd temporal moment (TM3)
3
1
1 3
N
i i
TM x
N =
=
∑
(10)•! Absolute value of the 4th temporal moment (TM4)
4
1 1 4
N
i i
TM x
N =
=
∑
(11)•! Absolute value of the 5th temporal moment (TM5)
5
1 1 5
N
i i
TM x
N =
=
∑
(12)Tree temporal moment is a statistical analysis that was proposed in [16] to be used in control of a prosthetic arm. Normally, the absolute value was taken to greatly reduce the within class separation for the odd moment case. The first moment and the second moment are similar to the MAV and VAR features, respectively. In [16], the third, fourth, and fifth moments (TM3, TM4, and TM5) were used and also evaluated in this study
•! The V-order (V): V is a non-linear detector that implicitly estimates muscle contraction force mi. It is defined from a functional mathematical model of the EMG signal generation [9, 10].
1
1
1 N v v i i
V x
N =
! "
=# $
%
∑
&•! Variance of EMG (VAR): VAR is another power index. Generally, variance is defined as an average of square values of the deviation of that variable; however, mean value of EMG signal is close to zero (~10-10).
2
1 1
1 N
i i
VAR x
N =
=
−
∑
(14)
•! Waveform Length (WL): WL is a measure of complexity of the EMG signal [11, 12]. It is defined as cumulative length of the EMG waveform over the time segment
1
1 1 N
i i i
WL
x
x
−
+ =
=
∑
−
. (15)•! Hjorth 1 (activity): The activity parameter represents the signal power, the variance of a time function. This can indicate the surface of power spectrum in the frequency domain [17]
_1 var( )
Hjorth = x (16)
•! Hjorth 2 (mobility): The mobility parameter represents the mean frequency, or the proportion of standard deviation of the power spectrum [17]
var _ 2
var( )
dx x
dt Hjorth
x
! "
# $
% &
= (17)
•! Hjorth 3 (complexity): The complexity parameter represents the change in frequency. The parameter compares the signal's similarity to a pure sine wave, where the value converges to 1 if the signal is more similar [17]
_ 3
( )
dx mobility x
dt Hjorth
mobility x ! "
# $
% &
= (18)
•! Kurtosis (Ku): Kurtosis measures the degree of flatness of the probability density function (pdf) near its center. Kurtosis has been well known in vibration signal to monitor the bearing condition [18]
(
)
(
)
4 14
1σ
− −
=
∑
=N m x Ku
N
i i
(19)
•! Skewness (Sk): Skewness measures the asymmetry of probability density function (pdf) of the signal. Similar to kurtosis, skewnes also has been used in vibration signal to monitor the bearing condition [18]
(
)
(
)
31
3
1
σ
− −
=
∑
= Nm x Sk
N i i
(20)
•! Autoregressive (AR) coefficients: A common approach for modelling univariate time series is the AR model as follows [14], [19], [10]
∑
= − −
−
− + + + + = +
=
n
i
t t i t n t n t
t
t a y a y a y ay
y
1 1 2
2 1
1 ...
ε
ε
(21)
where a1
to
anare the autoregressive coefficients,
y
t is the time series under investigation,n
is the order of
the AR model and ε is the residual which always assumed to be Gaussian white noise. In this paper
4
=
n is used.
B.!Classification using ANN
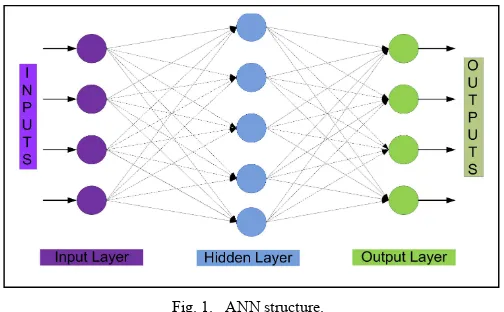
In this paper, ANN is selected for classification method. The standard structure of ANN is shown in Fig. 1. This structure consists of two layer feed forward network with a hyperbolic tangent sigmoid transfer function in hidden layer and a softmax transfer function in the output layer.
Fig. 1.! ANN structure.
The first output neuron of hidden layer can be expressed in (22)
1 1 1
( )
a = f IWp b+ (22)
where a1 is output vector from input layer, p is an n-length input vector, IW is input weight matrix, f1 is transfer function of hidden layer, and b1 is the bias vector of hidden layer.
The first output neuron of the output layer as written in (23)
2 2 1 1 2
( ( ( )) )
a = f LW f IWp b+ +b (23)
where a2 is output vector from output layer, LW is output layer weight matrix, f2 is transfer function of the output layer, and b2 is the bias vector of the output layer.
The transfer function in hidden layer and output layer as in equation (24) and (25). The function of hyperbolic tangent sigmoid generates outputs between -1 and 1 while softmax transfer function generates ouputs 1, as the neuron’s net input goes from negative to positive infinity. The description of transfer function can be seen in Fig. 2.
1
2
2
( ) 1
1 n
f n
e−
= −
+ (24)
2
( ) 1
-10 -5 0 5 10 -1
-0.5 0 0.5 1
a
n
-10 -5 0 5 10
-1 -0.5 0 0.5 1
n
a
tansig
softmax
Fig. 2. Neuron activation function.
The Levenberg-Marquardt training algorithm is used in this study. It was designed to approach second-order training speed without having to compute the Hessian matrix. As typical training feed forward networks, the performance function of this training algorithm has the form of a sum of squares, and the Hessian matrix can be approximated using equation (26).
T
H=J J (26)
and the gradient can be calculated as
T
g=J e (27)
where J is the Jacobian matrix that contains first derivatives of the network errors with respect to the weights and biases, and e is a vector of network errors.
The Levenberg-Marquardt training algorithm uses equation (28) to approximate the Hessain matrix
1 1
T T k k
x x J J
µ
I − J e+ = −"$ + #% (28)
When the scalar µ is zero, the equation (28), using the approximate Hessian matrix. When µ is large, this becomes gradient descent with a small step size.
The ANN classification use Mean Square Error (MSE) to measures the magnitude of the forecast errors as shown in (23). Better model will result to the smaller values of MSE.
2 1 2
( )
error
y y mse
m
−
=
∑
(24)where y1 is the real output in classification, y2 is the output
from ANN classification, and m is the total number of samples in classification. The input of ANN is this paper is 24 features and the output is 4 different mental tasking that are thinking forward, thinking backward, thinking right, and thinking left as shown in Fig. 3.
III.!MATERIALS
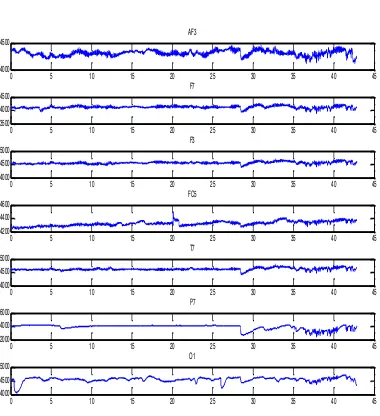
The EEG data used in this paper are acquired from 8 Indonesian volunteer using Emotiv EEG device with 16 channels: 14 channels located on scalp to acquire the EEG signals as shown in Fig. 4 and the others 2 channels are gyros channels. Each subject is asked to complete four mental tasking such as thinking forward, backward, right and left, sequentially. The EEG signal for each mental tasking is
measured for approximately 10 seconds. The total one dataset is 40 seconds. To distinguish the EEG signal of four different mental tasking in one dataset, the subject did the nod movement between the mental tasking. The 14 EEG signals and 2 gyro signals from one subject are presented in Figs. 5-7. The nod is shown as high peak signal as presented in Fig. 7. The EEG data used for feature extraction is separated manually based on the visual signal. Fig. 8 shows the separation of four mental task for F7 and gyro-y signal.
!24!Feature!inputs:
!1.!AAC !9.!SSI !!17.!Hjorth2 !2.!DASDV !10.!TM3 !!18.!Hjorth3 !3.!IEMG!!! !11.!TM4 !!19.!Ku !4.!LOG !12.!TM5 !!20.!SK !5.!MAV !13.!V !!21.!AR1 !6.!MAV1 !14.!VAR! !!22.!AR2 !7.!MAV2 !15.!WL! !!23.!AR3 !8.!RMS !16.!Hjorth1!!24.!AR4
!4!Classes!(4!mental!tasking): !1.!Thinking!forward !2.!Thinking!backward !3.!Thinking!right !4.!Thinking!left
Input Hidden!Layer Output!Layer Output
Fig. 3. ANN input and output for pattern recognition.
Fig. 4. Electrode locations covered by Emotiv.
0 5 10 15 20 25 30 35 40 45
4000 4500
AF3
0 5 10 15 20 25 30 35 40 45
3500 4000 4500
F7
0 5 10 15 20 25 30 35 40 45
4000 4500 5000
F3
0 5 10 15 20 25 30 35 40 45
4200 4400 4600
FC5
0 5 10 15 20 25 30 35 40 45
4000 4500 5000
T7
0 5 10 15 20 25 30 35 40 45
2000 4000 6000
P7
0 5 10 15 20 25 30 35 40 45
4000 4500 5000
O1
0 5 10 15 20 25 30 35 40 45 0
5000
AF4
0 5 10 15 20 25 30 35 40 45 4500
5000 5500
F8
0 5 10 15 20 25 30 35 40 45 3500
4000 4500
F4
0 5 10 15 20 25 30 35 40 45 3000
4000 5000
FC6
0 5 10 15 20 25 30 35 40 45 4000
4500 5000
T8
0 5 10 15 20 25 30 35 40 45 3800
4000 4200
P8
0 5 10 15 20 25 30 35 40 45 4600
4800 5000
O2
Fig 6. EEG signals from right side brain: channel.
0 5 10 15 20 25 30 35 40 45 1660
1670 1680 1690 1700
gyro x
0 5 10 15 20 25 30 35 40 45 1400
1600 1800 2000
gyro y
Fig 7. Gyro x and gyro y signal show the nod movement.
0 5 10 15 20 25 30 35 40 45
3500 4000 4500 5000
F7
0 5 10 15 20 25 30 35 40 45
1400 1600 1800 2000
gyro y
forward <--->
backward <--->
left <--->
right <--->
Fig 8. Raw signal data right.
IV.!RESULT AND DISCUSSION
A.!Feature Extractions
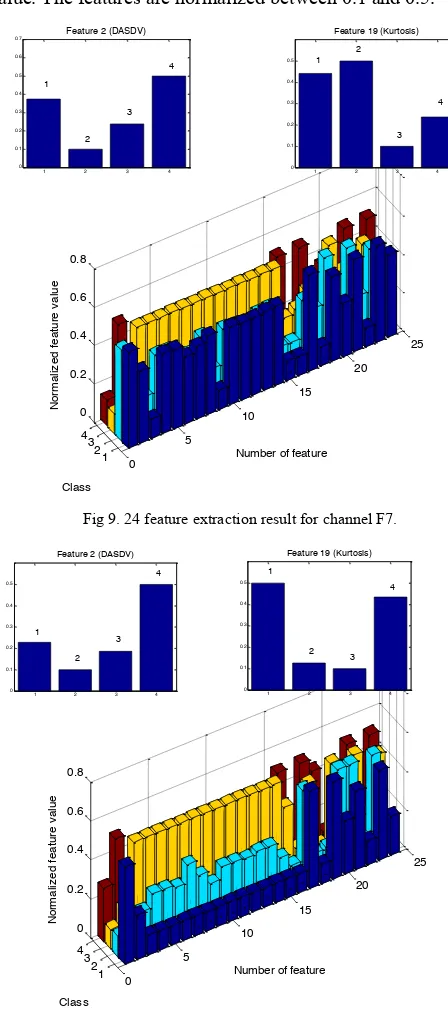
The result of 24 features for one subject are presented in Figs. 9-10. Fig. 9 shows the bar chart of 24 features for
channel F7 and Fig. 10 presents the bar chart of similar features for channel F8. Two zoom features are presented above the bar chart for each channel. It can be seen that the four mental tasking can be distinguished based on the feature value. The features are normalized between 0.1 and 0.5.
1 2 3 4
0 5
10 15
20 25
0 0.2 0.4 0.6 0.8
Number of feature
Class
N
o
rm
a
li
z
e
d
f
e
a
tu
re
v
a
lu
e
Fig 9. 24 feature extraction result for channel F7.
1 2 3 4
0 5
10 15
20 25
0 0.2 0.4 0.6 0.8
Number of feature
Class
N
o
rm
a
li
z
e
d
f
e
a
tu
re
v
a
lu
e
Fig 10. 24 feature extraction result for channel F8.
B.!Classification (ANN)
Four mental tasking i.e. forward, backward, left and right movement are classified using ANN. The pattern recognition method is designed by arranging the 24 features as rows and 20 data samples as column in matrix 24 x 20. That matrix is used as input vector in ANN. The target vector has 4 elements/classes that each of element consists of the value 0 or
1 2 3 4 0
0.1 0.2 0.3 0.4 0.5 0.6 0.7
Feature 2 (DASDV)
1
2 3
4
1 2 3 4
0 0.1 0.2 0.3 0.4 0.5
Feature 19 (Kurtosis)
1 2
3 4
1 2 3 4
0 0.1 0.2 0.3 0.4 0.5
Feature 2 (DASDV)
1
2 3
4
1 2 3 4
0 0.1 0.2 0.3 0.4 0.5
Feature 19 (Kurtosis) 1
2 3
1. The 20 dataset samples of mental tasking are divided into three subset i.e. training, testing, and validation using specified samples. 14 data are used in training, 3 data are used in test, and 3 data are used in validation. The ANN uses 40 neurons in hidden layer and 4 neurons in output layer.
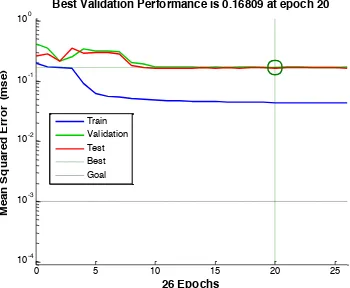
The training of ANN pattern recognition uses Levenberg-Marquardt training algorithm and the performance utilizes MSE. In Fig. 11, we used the best channel F7 to identified the performance of ANN Classification. The ANN iterations is 26 epochs with the MSE of training, test, and validation is 0.0429, 0.1693, and 0.1645, respectively. The results of 14 channels classification are presented in Table 1.
0 5 10 15 20 25
10-4 10-3 10-2
10-1 100
Best Validation Performance is 0.16809 at epoch 20
Me
a
n
S
q
u
a
re
d
E
rr
o
r
(m
s
e
)
26 Epochs
Train
Validation Test Best Goal
Fig 11. MSE graph during Training, validation, and testing.
TABLE I. ! TABLE STYLES
Channels ANN Confusion Matrix Results (%)
Training Validation Test Overall
Left
AF3 28.6 0 0 20
F7 85.7 66.7 66.7 80
F3 100 100 33.3 90
FC5 78.6 66.7 33.3 70
T7 85.7 33.3 0 65
P7 14.3 66.7 33.3 25
O1 21.4 33.3 33.3 25
Right
O2 21.4 66.7 0 25
P8 85.7 66.7 33.3 75
T8 35.7 66.7 0 35
FC6 57.1 66.7 33.3 55
F4 64.3 66.7 33.3 60
F8 85.7 100 66.7 85
AF4 21.4 66.7 0 25
V.!CONCLUSION
The pattern recognition method based on EEG signal and ANN has been presented. 24 time-domain and statistical features are used. The features can distinguished the four
mental tasking. 14 EEG channels are investigated and the results indicate that channel F7 and F8 are better than others channels. These channels are related to the brain area for deep thinking and emotional [20].
References(
[1]! Y. Kusuma, N. Venketasubramanian, L.S. Kiemas, J. Misbach. “Burden of stroke in Indonesia,” Int. J. Stroke, vol. 4(5), pp. 379-80, October 2009
[2]! M. Norris, P. Allotey, G. Barrett, “It burdens me’: the impact of stroke in central Aceh, Indonesia,” Sociol. Health & Illness, vol. 34(6), pp. 826-40, November 2012.
[3]! K.H. Tsai, C.-Y. Yeh, H.-C. Lo, “A novel design and clinical evaluation of a wheelchair for stroke patients,” Int. J. Ind. Ergon., vol 38(3), pp. 264-71, April 2008.
[4]! I.A. Langmoen, J. Berg-Johnsen, “The brain-computer interface,” World Neurosurg.., vol. 78(6), pp. 573-5, 2012
[5]! A. Fougner, “Proportional myoelectric control of a multifunction upper limb prosthesis,” Master’s Thesis, Norwegian University of Science and Technology, Norway 2007.
[6]! K.S. Kim, H. H. Choi, C.S. Moon, C.W. Mun, ”Comparison of k-nearest neighbor, quadratic discriminant and linear discriminant analysis in classification of electromyogram signals based on the wrist-motion directions,” Current Applied Physics, vol.11(3), pp. 740–745, November 2011.
[7]! H.P. Huang, C.Y. Chen, “Development of a myoelectric discrimination system for a multi-degree prosthetic hand,” in Proc. IEEE Trans. Robot. Autom., vol. 3, pp. 2392–2397, May 1999.
[8]! R. Merletti. “Standards for reporting EMG data,” J. Electromyogr. Kinesiol., vol. 6(1), pp. III–IV, Februari 1996.
[9]! D. Tkach, H. Huang, T. Kuiken, “A Study of stability of time-domain features for electromyographic pattern recognition,” J. Neuroeng. Rehabil., vol. 7(21), 2010.
[10]!M. Zardoshti-Kermani, B.C. Wheeler, K. Badie, R.M. Hashemi, “EMG feature evaluation for movement control of upper extren mity prostheses,” IEEE Trans. Rehabil. Eng.., vol. 3, pp. 324–333, Desember 1995.
[11]!B. Hudgins, P. Parker, R. Scott, ”A new strategy for multifunction myoelectric control,” IEEE Trans. Biomed. Eng.., vol. 40(1), pp. 82–94, Januari 1993.
[12]!M.A. Oskoei, H. Hu. “Support vector machine based classification scheme for myoelectric control applied to upper limb,” IEEE Trans.. Biomed. Eng., vol. 55(8), pp. 1956–1965, August 2008.
[13]!A. Phinyomark, C. Limsakul, P. Phukpattaranont, “A novel feature extraction for robust EMG pattern recognition,” J. Comput, vol. 1(1), pp.71–80, Desember 2009.
[14]!R. Boostani, M.H. Moradi, ”Evaluation of the forearm EMG signal features for the control of a prosthetic hand,” Physiol. Meas., vol.24(2), pp. 309–319, March 2003.
[15]!S. Du, M. Vuskovic. “Temporal vs. spectral approach to feature extraction from prehensile EMG signals.” Proc. IEEE Int. Conf. Inf. Reuse Integr., pp. 344–350, November 2004.
[16]!G.N. Saridis, T.P. Gootee., ”EMG pattern analysis and classification for a prosthetic arm,” IEEE Trans. Biomed. Eng.., vol.29(6), pp.403–412, 1983.
[17]!R.M. Rangayyan, Biomedical Signal Analysis : Case-Study Approach. IEEE Press series on Biomedical Engineering, Wiley , New York, 2002. [18]!W. Caesarendra, B. Kosasih, K. Tieu, C.A.S. Moodie, “An application
of nonlinear feature extraction – A case study for low speed slewing bearing condition monitoring and prognosis,” Proc. 12th IEEE/ASME Int. Conf. Adv. Intell. Mechatron., pp. 1713-1718. July 2013
[19]!S.H. Park, S.P. Lee, ”EMG pattern recognition based on artificial intelligence techniques,” IEEE Trans. Rehabil. Eng., vol. 6, no.4, pp. 400–405, 1998.