CARBON DIOXIDE (CO2) EMISSION FOLLOWING CULTIVATION OF
TWO CONTRASTING SOILS UNDER NATURAL CONDITION
(Emisi karbon dioksida (CO2) setelah pengolahan tanah dari dua jenis tanah yang berbeda pada
kondisi alami)
Yulnafatmawita
ABSTRACT
Emisi CO2 sebagai salah satu gas rumah kaca bukan
ha-nya berasal dari oksidasi bahan bakar oleh alat trans-portasi dan industri, tetapi juga bisa berasal dari lahan pertanian. Di Australia aktifitas pertanian mengkontribu-si CO2 sekitar 20% dari total CO2 yang diemisikan ke
udara. Akan tetapi belum ada data spesifik tentang bera-pa laju dan total CO2 yang diemisikan dari lahan
pertani-an sebagai akibat dari pengolahpertani-an tpertani-anah untuk budidaya tanaman. Tujuan dari penelitian ini adalah untuk meng-hitung laju CO2 yang bisa diemisikan dari lahan
pertani-an ypertani-ang punya tekstur halus (Vertisol) dpertani-an tekstur kasar (Alfisol), dari kedalaman 0-10 cm setelah 1 (satu) kali pengolahan tanah dengan traktor (Double Disk). Peneliti-an dilakukPeneliti-an di Pusat PenelitiPeneliti-an PertPeneliti-aniPeneliti-an TrPeneliti-angie, NSW, Australia pada musim dingin. Dari hasil penelitian diperoleh bahwa laju emisi CO2 dari tanah Vertisol
(bertekstur halus = berliat tinggi) lebih kecil dari tanah Alfisol (bertekstur kasar = lempung liat berpasir). Disamping tekstur, perbedaan kandungan bahan organik akibat perubahan penggunaan lahan juga menyebabkan perbedaan laju CO2 emisi dari suatu lahan. Pada tanah
Alfisol, contohnya, total CO2 emisi setelah pengolahan
ta-nah dari lahan dengan vegetasi asli (semak) > lahan yang biasa diolah dengan sistem olah konservasi > lahan yang diolah secara konvensional.
Kata kunci: emisi CO2, vertisol, alfisol
INTRODUCTION
Carbon dioxide (CO2) which is one of green-house gases contributes 50% to global warming (Lal et al, 1999) while it is up to 68% in Australia (AGO, 2002). Approximately 50% of that amount can be resulted from direct human action, one of which is from soil or agriculture activities, which contribute about 20% of CO2 emission in Australia. However, it is not yet accounted from agricultural soils (AGO, 2002)
In field condition of agricultural soils, CO2 can be originated from organism and root respira-tion, as well as from organic matter oxidation or breakdown. Organic matter decomposition in a soil is affected by the soil characteristics, such as
the texture and the structure, climate especially soil temperature and moisture, and types of the organic matter present. Therefore, the same soil can emit different amount of CO2, or different soils can induce the same amount of soil organic matter (SOM) degradation.
The release of CO2 from soils or agricultural lands can be accelerated by human activities, such as forest or pasture conversion to farming land, and tillage operation, and any other soil degradation process. Tillage loosens soil clods, degrades aggregates or even disperses into single particles, and exposes more surfaces of the soil aggregates or particles as well as the OM on it. At the same time, higher O2 circulation in soils increases microorganism activity, therefore, they consume more OM as their energy source, and emit CO2 to the atmosphere. To balance the CO2 emission, the atmospheric carbon (i.e., CO2) can be incorporated into soils through the application of plant residue retention and conservation tillage and the regrowth of native vegetation on aban-doned agricultural land. Accumulations of soil organic matter on these lands could offset emissions of CO2 from fossil fuel combustion, and hence reduce the greenhouse gas emission in the context of the Kyoto protocol (Schlesinger, 2000).
Recently, an increase of interest in investi-gating CO2 emission from soils as an indicator of SOM degradation was aimed to sequester OM in soils in order to sustain a better soil and air envi-ronment. As one of aggregate bonding agent, SOM develops and improves soil aggregate stability, which provides media for plant growth and controls the quality of the soils, reducing runoff and erosion. In stable aggregated soils, on the other hand, OM can be protected from being accessed and oxidized by microorganisms. In turn, rate of CO2 emission as one of greenhouse gases decreases.
Temperature, as well as soil texture was found to affect SOM degradation or CO2 emissi-on in the Glasshouse experiment. However, whether the CO2 emission rate in controlled (glasshouse) condition also performs under field condition, needs to be investigated. Therefore, to study CO2 release as it happens naturally in the field work was conducted. This research was aimed to find out how much CO2 release from soils as affected by soil textures and land use under natural condition.
MATERIALS AND METHODS 1. Field Site History
This research was conducted in Trangie Agricultural Research Center (TARC), about 600 km west of Sydney, New South Wales, Australia, during winter time. The area is rather flat, the lower Macquary Valley with altitude 215 m above sea level. Mean annual rainfall is 481 mm (ranging between 210-1189 mm) with a slight summer dominance (McKenzie, 1992). Two types of soils used were Alfisol (known as Red Brown Earth, silty clay loam, 37% clay) and
Vertisol (known as Grey Clay, clay, 60% clay). Alfisol is dominated (48.9%) by kaolinite clay mineralogy, contained high fine sand and low organic matter (1.2%) (Chan and Pratley, 1998). While Vertisol contained high smectites (46.9%) and low OC (1.4%) (McKenzie, 1992).
Alfisol was divided into two parts; cultivated and native pasture. Native pasture mixed with some weeds (approximately 50 cm high) grew and covered the soil surface. The area was not used for grazing or anything, but it was just left, instead, naturally. The other was an area of 20 x 20 m2 occupied (by K.Y.Chan, a soil scientist from Wagga-Wagga Research Institute in NSW) for tillage treatment since few years before this experiment. He divided the area into several plots (2 x 4 m) with different tillage systems and crop planting. Two of them used for this experiment were Direct Drill with Lucerne and Conventional Till with Fallow.
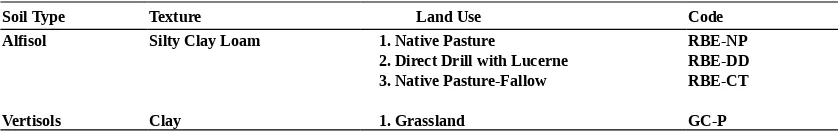
Vertisol, about 4 km far from RBE, was pastured (grassland) and not cultivated since the previous 6 years, but for grazing sometimes, was chosen for the experiment. The measurement sites are provided in Table 1 for detail.
Table 1. Field site measurement
Soil Type Texture Land Use Code
Alfisol Silty Clay Loam 1. Native Pasture RBE-NP
2. Direct Drill with Lucerne RBE-DD
3. Native Pasture-Fallow RBE-CT
Vertisols Clay 1. Grassland GC-P
2. Equipment and Technique of Measurement
Equipment used to measure CO2 release from soil was Licor-6400. It is actually portable pho-tosynthesis measurement, but completed with soil chamber by which can measure CO2 emission
from soil. It has two main parts, an IRGA (Infra Red Gas Analyzer) to count the amount of CO2 emitted by soils and a box with control buttons and a screen on the top to read the concentration of CO2 release counted by the IRGA.
Cover
Reading Box Licor-6400 IRGA
Base above soil surface
Base below soil surface 87 cm
90.5 cm cm
18 cm 21 cm
To measure CO2 emission from soil, a speci-al box (Figure 1) was designed to collect the CO2. It consists of two parts, the base which was inserted into soil surface and left there untill measurement finish and the cover which was attached to the base at the time of reading conducted. There was a hole on the top of the cover to connect an IRGA directly to the CO2 gas emitted by soil and there were 2 fans attached to the inside cover functioning to mix CO2 emitted by soil evenly. The joining parts of both cover and base were designed flat (3 cm wide) and plated with sponge in order to be firmed when it was put together, and then sealed with clips.
3. CO2 Measurement
Measurement of CO2 emission was conduct-ed for ambient CO2 atmosphere (before and after each site reading), control site (no-till soil) which was measured before tilled site, and tilled-site. About 3 minutes before finishing control site, the cultivation was conducted for 10 cm depth using double disks tractor. After tillage, time was elapsed about 5 minutes for inserting a base and joining the cover, before reading was taken. For each measurement, 50 readings were with 10 seconds interval. The CO2 release was only
measured for 3 days, since the rate of the emissi-on at that time approaching the cemissi-ontrol site. The distribution of measurement was 4, 3, and 2 for the 1st, 2nd, and 3rd day, respectively.
Besides CO2 measurement, soil water con-tent, air and soil temperature, soil BD, and soil organic matter were also measured as supporting data. Some soil characteristics (soil water con-tent and soil BD) was measured at TRAC laboratory, and soil organic carbon (SOC) at the School of Land and Food (SLAF) Sciences, University of Queensland.
RESULTS AND DISCUSSION 1. CO2 Release
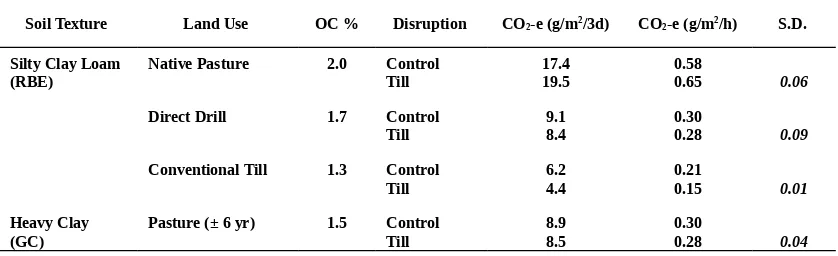
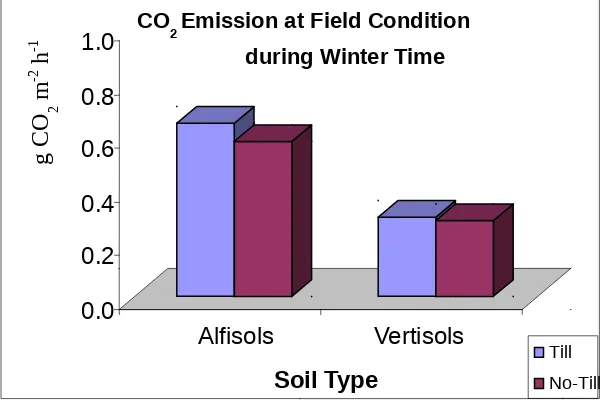
Table 2 shows that rates of CO2 release from coarse textured Alfisol and fine textured Vertisol soils. As also shown in Figure 2, Alfisol emitted CO2 about twice (19.5 gm-2) as high as that emitted by Vertisol (8.5 gm-2) from tillage site over 3 days since cultivation. Approximately the same comparison was also found for control sites. Since both soils were pastured, this should be due to the differences in texture between both soil types,.
Table 2. Emission rate of CO2 from Vertisol and Alfisol soils under field condition during winter time
Soil Texture Land Use OC % Disruption CO2-e (g/m2/3d) CO2-e (g/m2/h) S.D.
Silty Clay Loam Native Pasture 2.0 Control 17.4 0.58
(RBE) Till 19.5 0.65 0.06
Direct Drill 1.7 Control 9.1 0.30
Till 8.4 0.28 0.09
Conventional Till 1.3 Control 6.2 0.21
Till 4.4 0.15 0.01
Heavy Clay Pasture (± 6 yr) 1.5 Control 8.9 0.30
(GC) Till 8.5 0.28 0.04
The differences of total CO2 emission from different soil texture could be explained by the relationship between the soil physical condition and the microbial activity. Alfisol soil having coarser texture (silty clay loam, 37% clay) would have higher percentage of large pores than that in finer textured Vertisol (heavy clay, 60% clay). Large pores will cause good soil aeration, air circulation between outside and inside soil pores, which induced microorganism activity. Additionally, large pores also give chance for microbes to be able to reach SOM source within the pores. This was supported by the results found by McInerney and Bolger (2000) that CO2 production at clayey soil was 20-40% lower than that at sandy loam soil. Franszluebbers et al,
(1996) also repored that specific respiration of soil microbes decreased from 29 to 11 mg day-1 mineralizable-C by increasing clay content from 10 to 40%.
This field results agreed with what have been found under glasshouse condition. Yulnafatmawita et al (2003a) reported that coarser texture soil emitted more CO2 than finer texture soil did under controlled glasshouse condition.
fraction OM (HF-OM), which is protected from enzymatic and biological degradation (Dalal and Mayer, 1986). Therefore, it can be generalized
that, higher CO2 emission rate could be measured from coarser than finer textured soils, due to its accessibility toward decomposers.
Figure 2. CO2 emission rate from Alfisol and Vertisol soils under field condition over 3 days after tillage during winter
time in Trangie-ARC, New South Wales
2. Land Use Change
In Alfisol soil, having the same soil texture, land use change was found to affect the amount of CO2 released. Figure 3 shows that rate of CO2 emission for the first 15 minutes after disruption decreased from native pasture (RBE-NP) to the sites which were used to be cultivated by the methods of direct drill (RBE-DD) and conven-tional tillage (RBE-CT). Much higher CO2 emission for a few minutes after tillage was also
reported by Reicosky (1977) that CO2 flux 1 minute after plowing ranged between 26-114 g m -2 h-1 due to soil variability, such as landscape position, SWC, and SOC content. The same tendency was also found for CO2 emission rate over 3 days (Figure 3) after tillage. The values were higher from tillage than from control (no-till) sites for the 1st 15 minutes, but then the CO2 release reversed the results for direct drill and conventional tillage.
Figure 3. CO2 emission rate from RBE soil under field condition at the 1st 15 minutes (a) and 3 days (b) after tillage
during winter time in Trangie-ARC, New South Wales
Since the soil type was the same, and they were located at adjacent sites, higher CO2 emissi-on from native pasture was believed emissi-only due to its higher SOM content (Table 2). This land use
(native pasture) was also thought to have more easily degraded OM, which is easy to oxidize by microbes into CO2 than the others, since it was never disrupted. In addition, high CO2 emission
0.0
0.2
0.4
0.6
0.8
1.0
Alfisols
Vertisols
Soil Type
CO
2 Emission at Field Condition
during Winter Time
Till No-Till
g
C
O
2m
-2
h
-1
0.0 0.2 0.4 0.6 0.8
Pasture DD CT
Land Use
CO2 E-Rate from Alfisol soil
after Tillage under Field Condition
NT Till
C
O
2, g
m
-2
h
-1
0.0 0.2 0.4 0.6 0.8 1.0
Pasture DD CT
Land Use
CO2 E-Rate from Alfisol soil at the 1st 15 min after Tillage during Winter Time
NT Till
C
O
2, g
m
-2
h
-1
from native pasture was caused by flashing out of the CO2 having already been in the soil pores before cultivation.
Clearing soil surface of native pasture has caused decline in the SOM content due to the reduction of SOM source but also by letting some air and microbes to directly intact with the soil materials and the SOM in it. As a soil was inten-sively disrupted by conventional tillage, most of the SOM was degraded and oxidized. Consequently, the SOM content of the soil decreased. Therefore, when the native pasture soil was exposed to cultivation, it emitted more CO2 than the cultivated soils, at least the first few hours. These results were supported by Watts et al (2000) that CO2 emission increased from 1.88 ug g-1day-1 from permanent fallow (SOC = 1.1%)
For cultivated land use (DD and CT), the rate of CO2 emitted from control or no-tilled site became higher than that from tilled site (Fig 4) for 3 days after tillage. This was probably due to higher SOM content on the soil surface than in the 10 cm mixed layer, some of which was buried after being tilled. As a consequence, less SOM was exposed to oxidation, resulted in lesser CO2 emission to the atmosphere than control (no-till) site. Moreover, the tilled sites are likely to have lower plant residue C remaining at the end of the fallow than the no-till soil. The difference was higher at more intensive (CT) cultivation site. Cultivation which means converting soil, in-creasing soil volume, providing aeration, and making otherwise inaccessible substrates avail-able for microbial metabolism would promote degradation of SOM, including aggregating agents, and therefore results in a decline in soil aggregation (Lynch, 1984).
It can be inferred that, the higher the organic matter content of a soil, the higher the possibility to emit more CO2 to the atmosphere after culti-vation. It is found to be true especially for the virgin or uncultivated area, because most of the SOM is still highly susceptible to oxidation.
CONCLUSION
After 3 day measurement under natural condition during winter time (average soil tempe-rature 13oC), it can be concluded that:
1. The rate of CO2 emission decreased from 0.65±0.06 to 0.28±0.04 g m-2 h-1, respectively from coarser textured Alfisol soil to finer textured Vertisol soil under pasture 2. At the same soil (Alfisol) decreasing
C-organic content of the soil from 2% to 1.7% and 1.3 % due to land use change from native pasture, to direct drill (conservatiol till), and to conventional till, had decreased the total amount of CO2 emission from 0.65 to 0.28, and 0.15 g m-2 h-1.
ACKNOWLEDGMENT
Author would like to thank Dr. K.Y Chan for his permission using the experimental plot to study, Trangie-ARC NSW staffs for the facilities (field equipment and accomodation) given during the reseach, and also L. Kapral (undergraduate student) for working together in the field.
REFERENCES
Aase, J.K., and, J.L.Jr. Pikul. 1995. Crop and soil response to long-term tillage practices in the northern Great Plains.
Agron. J., 87(4), 652-656.
Australian Greenhouse Office. (AGO). 2002. National Green-house Gas Inventory 2000 with Methodology Supplements. Australian Greenhouse Office, Annual Report.
Chan, K.Y., and J. Pratley. 1998. Soil structural decline: can the trend be reversed? In “Agriculture and the environmental imperative”, edited by J.J. Pratley and A.Robertson, CSIRO Publ., Collingwood, Australia, 129-163.
Dalal, R. C., and R.J. Mayer. 1986. Long-term trends in fertility of soils under continuous cultivation and cereal cropping in Southern Queensland (Australia): III. Distribution and kinetics of soil organic carbon in particle-size fractions. Aust. J. Soil Res., 24, 293-300. Franzluebbers, A.J., R.L. Haney, F.M. Hons, and D.A.
Zuberer. 1996. Active fractions of organic matter in soils with different texture. Soil Biol. Biochem., 28, 1367-1372.
Lal, R., J.M. Kimble, R.F. Follet, and C.V. Cole. 1999. The potential of U.S. cropland to sequester carbon and mitigate the greenhouse effect. Lewis Publishers, Boca Raton, 128.
Leiros, M. C., C. Trasar-Cepeda, S. Seoane, and F. Gil-Sotres. 1999. Dependence of mineralization of soil organic
Lynch, J.M. 1984. Interaction between biological processes, cultivation, and soil structure. Plant and Soil., 6, 307-318.
McInerney M., and T. Bolger. 2000. Temperature, wetting cycles and soil texture effects on carbon and nitrogen dynamics in stabilized earthworm casts. Soil Biol. Biochem., 32, 335-349.
Parfitt, R. L., A. Parshotam, and G.J. Salt. 2002. Carbon turnover in two soils with contrasting mineralogy under long-term maize and pasture. Aust. J. Soil Res., 40(1), 127-136.
Reicosky, D.C. 1997. Tillage-induced CO2 emissions from soil. Nutr. Cycl. Agroecosyst., 49, (1/3), 273-285. Schlesinger, W.H. 2000. Carbon sequestration in soils: some
cautions amidst optimism. Agric. Ecosys. Environ., 82, 121-127.
Veldkamp, E. 1994. Organic carbon turnover in three tropical soils under pasture after deforestation. Soil Sci. Soc. Am. J., 58 (1), 175-180.
Watts, C.W., S. Eich, and A.R. Dexter. 2000. Effects of mechanical energy inputs on soil respiration at the aggregate and field scales. Soil Till. Res., 53, 231-243.
Yulnafatmawita, H.B. So, R.C. Dalal, and N.W. Menzies. 2003a. CO2 Release from Two Contrasting Soils under Controlled (Glasshouse) Condition. Proceedings The 16th Triennial International Soil Tillage Research Organisation (ISTRO) Conference, 13-18 July 2003, Brisbane, Queensland, Australia. p1403-1407
Yulnafatmawita, H.B. So, R.C. Dalal, and N.W. Menzies. 2003b. CO2 emission from different aggregate size fractions following physical disruption: Implication for tillage practices. Proceedings The 16th Triennial ISTRO Conference, 13-18 July 2003, Brisbane, Queensland, Australia. p1396-1402
---oo0oo---Attachment 1. Characteristics of field experimental soils on 0-10 cm depth in Trangie
ARC
Soil Characteristics RBE-NP GC-P
Texture
Sand (%) 33.7 23.5
Silt (%) 28.7 16.4
Clay (%) 37.6 60.1
BD 1.55 1.63
SWC (%)
Saturation 46.2 66.8
Field Capacity 31.0 42.2
Wilting Point 8.6 16.3
Initial OC (%) NP 2.0 1.5
CEC (meq 100g-1) 11 27