3.1. Preliminary Study
A preliminary study was conducted prior to main study in order to determine the electrolyzed water production time, product shelf life and antimicrobial performance.
3.1.1. Production Time
The determination of production time of electrolyzed water was based on the time required to reach pH 3.5 of acidic electrolyzed water. The oxidation-reduction potential of the samples were measured as well. The results are shown on Figure 5, Figure 6 and Appendix 1.
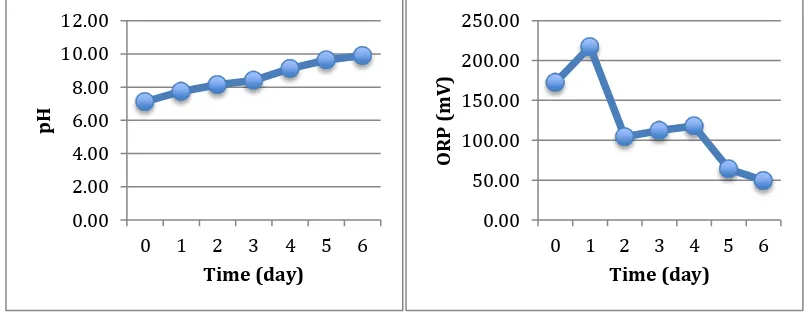
Figure 5. (a) pH Reduction during Production (b) ORP Increment during Production
Figure 5 shows the pH and ORP of during the production of acidic electrolyzed water. The pHvalue decreased sharply during the first 3 days. Afterwards, the reduction rate decreased and the pH reached 3.5 after 6 days. Meanwhile, the ORP increased sharply during the first 2 days and steadily increase until the 6th day.
Figure 6. (a) pH Increment during Production (b) ORP Decrement during Production
On Figure 6, it can be seen that pH increased steadily during the production. Meanwhile, the ORP increased sharply during the 1st day of production. Despite the increment, the ORP is still lower than 600 mV which is the minimum level required to conduct bactericidal and virusidal characteristics. The ORP was significantly reduced during the 2nd day. On the 3rd and 4th day of production, the ORP increased slightly prior to decreasing on the 5th and 6th day.
3.1.2. Shelf Life of Electrolyzed Water
The shelf life was observed based on the pH and ORP for 7 days and analysed by regression method. The results are listed on Figure 7, Figure 8 and Appendix 2.
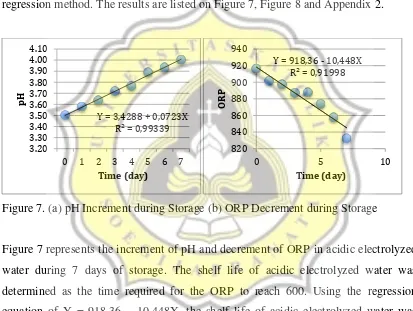
Figure 7. (a) pH Increment during Storage (b) ORP Decrement during Storage
Figure 7 represents the increment of pH and decrement of ORP in acidic electrolyzed water during 7 days of storage. The shelf life of acidic electrolyzed water was determined as the time required for the ORP to reach 600. Using the regression equation of Y = 918,36 – 10,448X, the shelf life of acidic electrolyzed water was calculated and found to be 27 days.
Figure 8. (a) pH Reduction during Storage (b) ORP Increment during Storage
Figure 8 depicts the decrement of pH and increment of ORP in alkaline electrolyzed water during 7 days of storage. The shelf life of alkaline electrolyzed water was determined as the time required for the pH to reach 8, as pH 7 is considered neutral. Using the regression equation of Y = 9,75 – 0,0636X, the shelf life of alkaline electrolyzed water was calculated and found to be 30 days.
3.1.3. Antimicrobial Performance
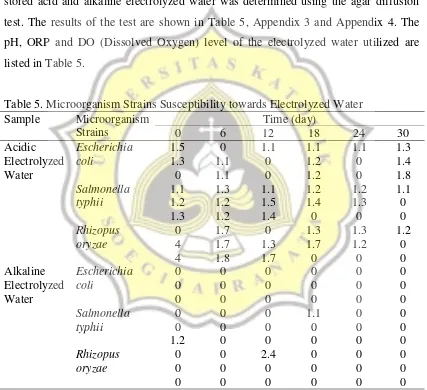
The susceptibility of Escherichia coli, Salmonella typhii and Rhizopus oryzae towards stored acid and alkaline electrolyzed water was determined using the agar diffusion test. The results of the test are shown in Table 5, Appendix 3 and Appendix 4. The pH, ORP and DO (Dissolved Oxygen) level of the electrolyzed water utilized are listed in Table 5.
Table 5. Microorganism Strains Susceptibility towards Electrolyzed Water Sample Microorganism
Figure 9. Inhibition Zones Formed around Treated Paper Discs
Table 6 shows the pH, ORP, and DO levels of electrolyzed water samples that were used for the agar diffusion test.
Table 6. pH, ORP and DO Levels of Electrolyzed Water Samples Electrolyzed
Water
Time (day) pH ORP (mV) DO
Acid 0 3.39 ± 0.01 986.33 ± 1.53 7.17 ± 0.06
6 3.42 ± 0.02 979.33 ± 2.08 8.23 ± 0.12 12 3.41 ± 0.01 971.67 ± 0.58 8.97 ± 0.15 18 3.91 ± 0.02 946.00 ± 0.00 9.03 ± 0.06 24 4.62 ± 0.01 911.00 ± 1.00 10.70 ± 0.10 30 5.82 ± 0.02 887.00 ± 1.00 11.47 ± 0.15
Alkaline 0 8.82 ± 0.02 97.33 ± 0.58 2.37 ± 0.06
6 9.01 ± 0.02 98.00 ± 2.65 6.03 ± 0.15 12 8.94 ± 0.03 110.00 ± 1.00 8.77 ± 0.06 18 8.18 ± 0.03 125.33 ± 1.53 8.40 ± 0.10 24 7.37 ± 0.01 151.00 ± 2.00 10.00 ± 0.10 30 6.74 ± 0.00 175.33 ± 1.15 11.60 ± 0.20
In acidic electrolyzed water, the pH and DO increased with storage time while the ORP decreased. In alkaline electrolyzed water, the pH and ORP increased while the pH decreased.
Inhibition zone
Paper disc
Inhibition zone Paper disc
3.2. Main Study
The main study of this research consisted of gel electrophoresis and identification of fungal strains.
3.2.1. Physical Appearance
The changes on the products’ physical appearance throughout the study can be seen on Table 7.
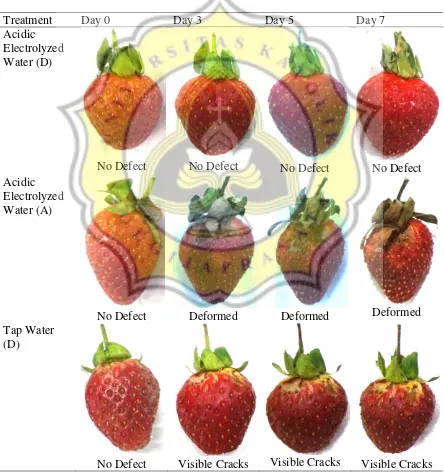
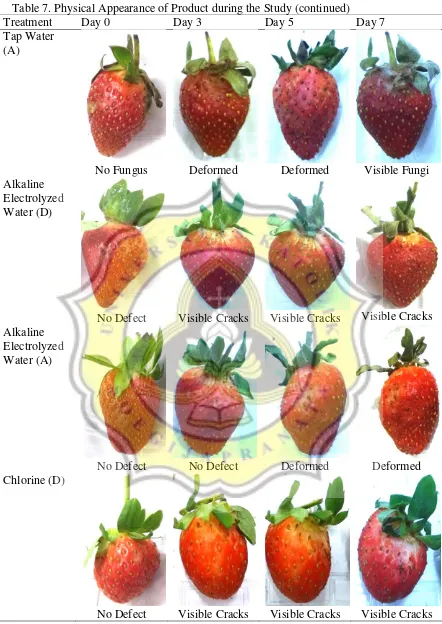
Table 7. Physical Appearance of Product during the Study
Treatment Day 0 Day 3 Day 5 Day 7
Acidic Electrolyzed Water (D)
No Defect No Defect No Defect No Defect
Acidic Electrolyzed Water (A)
No Defect Deformed Deformed Deformed
Tap Water (D)
Table 7. Physical Appearance of Product during the Study (continued)
Treatment Day 0 Day 3 Day 5 Day 7
Tap Water (A)
No Fungus Deformed Deformed Visible Fungi
Alkaline Electrolyzed Water (D)
No Defect Visible Cracks Visible Cracks Visible Cracks Alkaline
Electrolyzed Water (A)
No Defect No Defect Deformed Deformed
Chlorine (D)
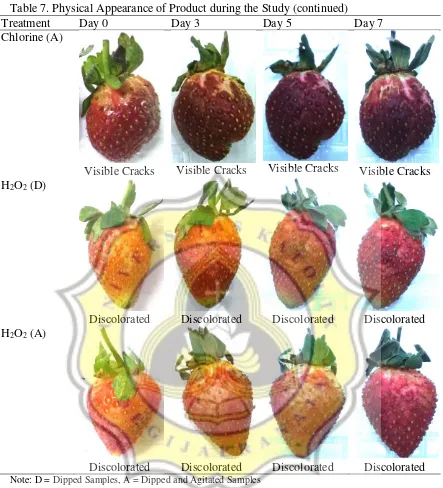
Table 7. Physical Appearance of Product during the Study (continued)
Treatment Day 0 Day 3 Day 5 Day 7
Chlorine (A)
Visible Cracks Visible Cracks Visible Cracks Visible Cracks H2O2 (D)
Discolorated Discolorated Discolorated Discolorated H2O2 (A)
Discolorated Discolorated Discolorated Discolorated
Note: D = Dipped Samples, A = Dipped and Agitated Samples
3.2.2. Gel Electrophoresis
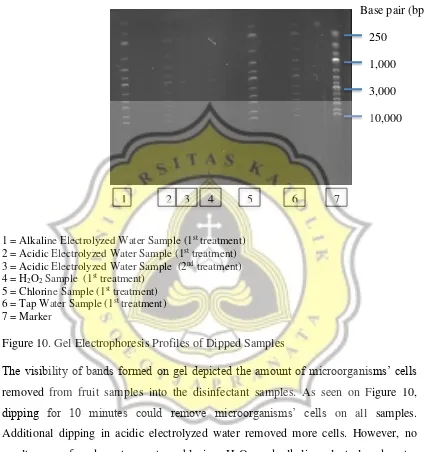
The results of gel electrophoresis of isolated DNA are shown in Figure 10 and Figure 11.
1 = Alkaline Electrolyzed Water Sample (1st treatment)
2 = Acidic Electrolyzed Water Sample (1st treatment)
3 = Acidic Electrolyzed Water Sample (2nd treatment)
4 = H2O2 Sample (1st treatment)
5 = Chlorine Sample (1st treatment)
6 = Tap Water Sample (1st treatment)
7 = Marker
Figure 10. Gel Electrophoresis Profiles of Dipped Samples
The visibility of bands formed on gel depicted the amount of microorganisms’ cells
removed from fruit samples into the disinfectant samples. As seen on Figure 10,
dipping for 10 minutes could remove microorganisms’ cells on all samples. Additional dipping in acidic electrolyzed water removed more cells. However, no results were found on tap water, chlorine, H2O2 and alkaline electrolyzed water samples. The third washing step removed no cells on all samples.
1 2 3 4 5 6 7
Base pair (bp) 250
1 = Alkaline Electrolyzed Water Sample (1st treatment)
2 = Acidic Electrolyzed Water Sample (2nd treatment)
3 = Acidic Elctrolyzed Water Sample (1st treatment)
4 = H2O2 Sample (2nd treatment)
5 = H2O2 Sample (1st treatment)
6 = Chlorine Sample (1st treatment)
7 = Tap Water Sample (1st treatment)
8 = Marker
Figure 11. Gel Electrophoresis Profiles of Dipped and Agitated Samples
As seen on Figure 11, dipping and agitating for 10 minutes could remove
microorganisms’ cells on all samples. Additional washing removed more cells on
acidic and alkaline samples with no results in tap water, chlorine and H2O2 samples.
3.2.3. Identification of Fungi up to Genera Level
The result of the identification of fungi genera found on samples throughout the study is shown on Table 8.
1 2 3 4 5 6 7 8
Base pair (bp) 250
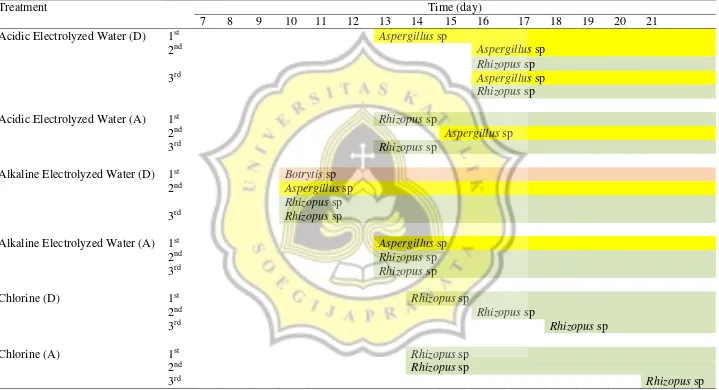
Table 8. Fungi Genera Identification Result
Treatment Time (day)
7 8 9 10 11 12 13 14 15 16 17 18 19 20 21
Acidic Electrolyzed Water (D) 1st Aspergillus sp
2nd Aspergillus sp
Rhizopus sp
3rd Aspergillus sp
Rhizopus sp
Acidic Electrolyzed Water (A) 1st Rhizopus sp
2nd Aspergillus sp
3rd Rhizopus sp
Alkaline Electrolyzed Water (D) 1st Botrytis sp
2nd Aspergillus sp
Rhizopus sp
3rd Rhizopus sp
Alkaline Electrolyzed Water (A) 1st Aspergillus sp
2nd Rhizopus sp
3rd Rhizopus sp
Chlorine (D) 1st Rhizopus sp
2nd Rhizopus sp
3rd Rhizopus sp
Chlorine (A) 1st Rhizopus sp
2nd Rhizopus sp
Table 8. Fungi Genera Identification Result (continued)
Treatment Time (day)
7 8 9 10 11 12 13 14 15 16 17 18 19 20 21
H2O2 (D) 1st Rhizopus sp
2nd Rhizopus sp
3rd Rhizopus sp
H2O2 (A) 1st Aspergillus sp
2nd Rhizopus sp
3rd Rhizopus sp
Tap Water (D) 1st Rhizopus sp
2nd Rhizopus sp
3rd Botrytis sp
Rhizopus sp
Tap Water (A) 1st Rhizopus sp
2nd Rhizopus sp 3rd Aspergillus sp
Rhizopus sp
Table 8 summarizes the types and appearances of fungi on samples. No fungi were found on samples on day 0 to day 6. The sample with the shortest shelf life was the samples dipped and agitated in tap water in which fungi grew on samples after 7 days. Most samples were overgrown by fungi after 14 days. Repetition of treatment was effective to prevent the growth of fungi on samples treated with acidic electrolyzed water, chlorine and H2O2. Meanwhile, agitation did not prolong the shelf life of most samples, with the exception of alkaline electrolyzed water samples. On tap water samples, agitation shortened the shelf life of samples.
There were 3 genus of fungi found on samples, namely Aspergillus sp, Rhizopus sp and
Botrytis sp. All 3 were found on tap water and alkaline electrolyzed water samples.
Aspergillus sp and Rhizopus sp were found on acidic electrolyzed water and H2O2 samples. The only fungi genera found on chlorine samples were Rhizopus sp. The strains were determined based on their appearance on fruit samples, plates and structure under the microscope. The microscope magnification was set on 10X for ocular lens and 40X for objective lens. The characteristics were noted and compared to Introduction to Food Borne Fungi (Lay, 1994). Aspergillus sp found on samples are shown on Figure 12(a), (b) and (c).
Aspergillus sp were identified by the thin stipe, swelled apex and present conidia head.
Rhizopus sp were identified by the presence of rhizoids. The appearance of Rhizopus sp under the microscope, on fruit sample and on plate are shown on Figure 13(a), (b) and (c).
Fungi
(a) (b) (c)
Figure 12. (a) Aspergillus sp on Fruit Sample (b) on Plate (c) Under the Microscope (10 x 40)
(a) (b) (c)
Figure 13. (a)Rhizopus sp on Fruit Sample (b) on Plate (c) Under the Microscope (10 x 40)
(a) (b) (c)
Figure 14. (a) Botrytis sp on Fruit Sample (b) on Plate (c) Under the Microscope (10 x 40) stipe conidia
vesicle
rhizoid
conidiophore s
Branched conidiosphore
Fungi