.I
I
S B
N:
978-E
B
2-ll+32
8-[-8
rR$CEEI}IT{G
Tk*
**t**x-rx*ttls:;r.*
I
€'*nfer*rrr
e
*
:m
&w******
*f*ti*ti
r.r
September,
16-
1
9th
2OI3
tlniversitas
Padj
ar{i
&ran
KampusJatinangor
ISBN:
978-E n2-14328-CI-8
;ry
t
$
PROCEEI'ING
rhe
hternationat
oonferenoe
OnApptled
Statistics
September,
16-1
8*,
2}lg
Universitas
P
adj adl
ar
an
The
Internatlonal
Conference
on
Arrplled
StaUstlcs
PAOCfEDING
ISBN:
978-6oz-
r4328-o-8
Reviewers:
Prof.Henk Folmer (RUG, The Netherlands) Prof. Bart Meuleman (KU Leuven, Belgium) Prof.lrene Gijbels (KU Leuven, Belgium)
Prof.Young J. Lee. {Seoul National University, South Korca) Prof.Engku Nazri (University Utara Malaysia, Malaysia) Dr.Danief Oberski (Tilburg University, The Netherlands)
Siew-pang Chan,Ph.D. (l-a Trobe Univercity, Australia) Editorc:
Septiadi Padmadisastra, Ph.D
Budhi Handoko, S.Si, M.Si
Anindya Apriliyanti P, S.Si, M.Si Defi Yusti F, S.Si, M.Si
Septemlrer,
I
Gl
Srn2Ol3
Department
of
Statistics
Faculty
of
itathematiof
an.l Nalrrral
ScJences
Unlversltas
Dadf
adJaran
l^
I
I
corrrerencc'*^"',ffT,fiffi:i
ffi
Drefaoe
Welcome to the Proceedings of the International Conference on Applied Statistics (ICAS
20\3).
This event was heldat
September, 16-18th 2013in
the beautiful Campus ofUniversitas Padiadiaran, ]atinangor-Sumedang, West ]ava Province, Indonesia. This Conference is organized by Department
of
Statistics, Facultyof
Mathematics andNatural Science, Universitas Padiadiaran in cooperation with Statistical Forum
for
Higher Education (FORSTATJ Indonesia.
The ICAS 2013 Conference was attended by 12 invited speakers, 60 researchers and academicians from B countries who were share their expertise and find out about the
latest
researchon
applied statistics.A
special thanks goesto
all
speakers and presenters as well as to the session chairpersons, who drove all the conference sessionson the right tract, keeping them in time while permitting enriching discussions.
Finally, we hope that these proceedings
will
serve as a valuable reference for securityresEarcher and academicians.
Best Wishes,
Dr. Toni Toharudin, M.Sc.
'*6
Proceedrng ofrcss--rtj7
trretnternati{fidr {rnrtrrtrxe
{*
rrE.l,'rrsrfl.ts,*crr:
Soekordi Hodlprobowo
Table
of
Contents
Preface
...,....
i
Table of
contents
...ii ECONOMETRICS <E> & REGRESSION
<R> <E.1>
FEMALE
FERTIL]ry
IN
ASEAN-I,
ANDASEAN-S: EVIDENCE FROM PAN E L CO I N TE GMTI ON AND CNATVCNN CAUSALITY TESTING
Thfrunoukorosu Subromoniom, Evefyn Devodoson, Nonlhokurnor
Logonolh on...,...1
<8.2>
THE SYNTHETI. REGRES'I'N
METH'D: HoW
THE INDIAN
'CEAN
TSUNAMT AFFECTS GRowrH
rne;rEomrs
Slono Hofim, tnggfU, Rldhotomo Stroiti Dorsth Oftemoesoe
<R.1>
...,....16ANALYSIS
OF
CHAMCTERISTICSAND
ATTRIBUTES AFFECTINGCONSUMERS IN FLIGHT SELECTION
USINC XESTED TOGIT
Arlon Dhlni, Sonyo Clorisso...
<R.2>
...25FOURIER SERIES EJTIMATOR
IN
NONPAMMETRIC MULTIVARIABLEREGRESSION AND ITS CMMCTTNISTidS
Rohmowoii pone, I ltyomon gudionlorq,
lsmqlnlZoin, Bombong W.
Otok..
... 34
EXPERIMENTAT DESIGN <ED> &
SMATL AREA ESTIMATTONS <SE>
<ED.1>
GENERALIZED DISTANCES OPTIMIZATION
FOR
MULTIRESPONSESURFACE MODEL OF MIXTURE
EXP;iiMENTAL DESIGNS
Ruslon, Yohyo l, Sohupofra n...,...,...
<ED.z>
...45YALIDITY THE APLICATION OF F TEST VERSUS FRIEDMAN'S TEST IN DATA ANALysrs oF
Two
FACToRcA
;'
<ED.3> 50
DESIMBILITY FUNCTION FOR MULTIPLE
RESPONSE PROBLEM
SrlWinorni.,.
<sE.1>
"".,...,.'.,62;li,r^tri,JNFoRMArroN
oF
NoN-sAMprED AREArN
SMALL AREARohmo Aniso, Anong Kurnio. Indohwofi...
<s8.2>
...'."..'-69ACCUMCY
AND
PRECISIONIN
HIEMCHICAL BAYES SMALL
AREA
ESTI MAT I ON C ORRELATT ON SPETTAiT
;VANIATES M ODEL slswontinlng,
Tt11n.,,....,.,.,
...,77
proceedincof
ffi
r,crferen(p.,'^o*,lii"Jff'illii'*#f
}TULTIVARIATE <M>& TIME SERIES <TS>
<M.1>
THE PROFILES AND GROWTH CURVE ANALYSIS AFTER MANOVA FOR
LONGITUDINAL DATA Enny Suportini...,...,...
<M.2>
FIRST
AND
SECONDLEVEL
OF
SIMILARITY
MEASURES IN HIERARCHICAL CLUSTERINGRB. FoJrlyo Hoklm, Donordono.
<M.3>
CLUSTERING AND MAPPING ON THE REGION OF SUB-DISTRICTS IN SUMEDANG REGENCY AS THE BASIS OF PROGMM SOCIO.ECONOMIC PROBLEMS SOLVING USING BAYESIAN HIERARCHICAL CLUSTERING
Budhl Hondoko, lrlondlo Ginonfor, Bertho Tonlulor
<TS.1>
SIMULATION STUDY FOR DETERMINING THE ACCUMCY RATE OF
ARFIMA MODELS BASED ON FORCASTING RESULT Gumgum Dormowon..
<TS.2>
SPC FOR TIME COMPLETION MEASUREMENT AND OPTIMIZATION ON PROJECT MANAGEMENT
Sri Enny Triwidiosfuti ... <TS.3>
B5
90
LO4
113
,f
12l
RICE DEMAND FORECASTING
WITH
SMAPEINTEGRATED PART OF
THE
FRAMEWORK FORERROR MEASURES
FORECASTING RICE
CRISES TIME IN BANDUNG-INDONESIA
Yuyun Hldoyot. lsmoll Bln Moh 130
SPATIAT <S> & BIOSTATISTICS <B> <s.1>
GEOGRAPHICALLY WEIGHTED REGRESSION MODELING ON CASES OF
MALNUTRITION IN EAST IAVA PROVINCE
ldo M. Huloborol, Asep Soefuddin. Hordinsyoh, Anlk Djuroldoh, I W Mongku <s.2>
MAXIMUM LIKELIHOOD ESTIMATION FOR TOBIT SPATIAL REGRESSION
Deli Yusli
Foidoh...,..,..
.'...--1.49<s.3>
ANSELIN
ON
SPATIALLAG
MODELOF
MAXIMUM LIKELIHOODESTIMATION
Restu Arlsontl 155
<8.1>
A COMPARISON OF MAXIMUM LIKELIHOOD AND EMPIRICAL BAYESIAN
ESTIMATION
OF
DISEASE R.ISKBY
MEANSOF
MONTE CARLOSIMULATION
L6Z I Gede Nyomon Mindra Joyo, Henk Folmer, Budi NurqniRuc
E
SOCIOMETNICS <SC> & STATISTICAL EDUCATION <SEd> <Sc.1>
THE OVERLOOKED LINKING ERROR IN TIMSS STUDY
Bokh Horyonlo, Kelvln Gregory
t73
<Sc.2>
STRUCTUML EQUATION MODELLING IN APPLICATION
M.Arifln. Liso Nesti <sEd.1>
DOES ACHIEVEMENT IN STATISTICS RELATED TO STUDENTS ATTITUDE
TOWARD STATISTIC? CASE OF
Fikl Arlyonti Abldln, Rotno Jqlniko STATISTICAL THEORY <ST>
<sr.1>
PSYCHOLOGY STUDENTS
CONFIDENCE BANDS FOR SURVIVOR FUNCTION OF TWO PAMMETERS EXPONENTIAL DISTRIBUTION UNDER MULTIPLE TYPE-II CENSORING
Akhmod Favry...,...
<sr.2>
INTERVAL ESTIMATION FOR SURVIVOR FUNCTION OF EXPONENTIAL DISTRIBUTI ON UNDER MULTIPLE TYPE-II CEN SORIN G ON SIMPLE CASE
Korliko Arl Susonfl, Akhmod Foury
<sT.3>
WINSORIZATION
ON
SMALL AREA INFERENCEWITH
POSITIVELY SKEWED DISTRIBUTIONSAnong Kurnlo, Dion Kusumoningrum, Piko Silvlonti, Dlon
Hondoyoni..'...
,""zLO<sT.4>
COMPARISON OF STATISTICAL MODELS FOR DETERMINATION OF RICE
FIELD PHOSPHORUS CRITICAL LEVEL
Mohommod MosJkur, Bogus Sqrtono, ond lloslq Dlno Sulvlontl
<sr.5>
2t7
MAXIMUM LIKELIHOOD AND SIMPLISMA TO ESTIMATE THE NUMBER
OF PURE COMPONENTS IN MIXTURES
Triyonl Hendrowoll, Erftoni, Yennl Angrolnl 225
iv
-PROCEEDING
The International Conference on Applied Statistics
September 16-19, 2013
THE SYNTHETIC REGRESSION METHOD: HOW THE INDIAN OCEAN TSUNAMI
AFFECTS GROWTH TRAJECTORIES
SianaHalim1, Inggrid2, Ridhotama Shanti D. Ottemoesoe2
1Industrial Engineering Department, Petra Christian University
Surabaya, Indonesia [email protected]
2Business and Management Department, Petra Christian University
Surabaya, Indonesia
[email protected], [email protected]
Abstract
In recent works, scholars have widely used the synthetic control method (SCM) for analyzing the effect of a catastrophic disaster on economic growth. Unlike the traditional SCM, we propose the so-called synthetic regression method to choose a suitable synthetic control group by employing a comparing series procedure. We then use the selected group to estimate our outcomes of interest. We apply the synthetic regression method to examine the causal effects of the 2004 Asian tsunami on economic growth in Aceh, the Indonesian province severely hit by the tsunami.
Our results show that the tsunami has an unintended effect on Aceh’s economic growth
performance. The findings of the paper lead us to a better method for analyzing the growth trajectories, particularly for Aceh after the 2004 tsunami
Keywords: Natural disasters, Economic growth, Synthetic control method, Comparing series, Synthetic regression method
.
1. INTRODUCTION
An influential stand of literature on the economics of natural disasters has been devoted to
assess the economic effects of such events. The standard taxonomy classifies damages caused by
disasters into three classes: direct damages that entail the loss of productive investments (e.g.
destruction of fixed assets and inventories), indirect damages that encompass the decline in the
production of goods and services, and secondary effects that involve the evolution of
macroeconomic variables (Peeling et al., 2002; ECLAC, 2003). This paper assesses the change in the
PROCEEDING
The International Conference on Applied Statistics
September 16-19, 2013
In practice, we adopt an experimental design in which the catastrophic natural disaster or
the treatment is supposed to generate a jump or an interrupted in the time series data. Previous
research studied the conditions before and after that interruption in different methods. Halim and
Jiang (2013) used the interrupted time series analysis with a segmented regression method for
analyzing the effect of operation 24 hours on reducing collision in the City of Edmonton. Hamed et
al. (1999) employed a diffusion model with jumps to investigate the impact of the Gulf crisis on
traffic collisions in Jordan. The interrupted time series and diffusion models will produce
satisfactory results if we are able to compare the before and after conditions for a single time series.
On the contrary, the synthetic control method (SCM) offers us the opportunity to select an
appropriate control group based on multiple time series, and it allows us to construct the synthetic
control unit from a group of untreated units. However, the SCM has several drawbacks. For
instance, in some cases, it may not even be possible to obtain a weighted combination of untreated
units such that some restrictions for constructing the SCM are satisfied. This condition will lead to a
poor fit. Even if there is a synthetic control unit that provides a good fit for the treated unit,
interpolation biases may be large if the simple linear model does not hold over the entire set of
regions in any particular sample (Abadie et al., 2010).
Therefore, in this paper, we propose the so-called synthetic regression method. Basically, it
is carried out in two steps. First, we use the comparing series method as Franke and Halim (2007)
to select a suitable control group. In our case, we need to choose a proper synthetic control group
for the Aceh Province. In the second stage, we use the selected group to estimate economic growth
that would have been observed for Aceh in the absence of the disaster. The economic growth is
estimated using linear regression.
2. METHODOLOGY
In this section, we give an overview of the two methods for studying the evolution of Aceh’s
economic growth after the tsunami. They are the synthetic control method and the synthetic
regression method.
2.1.Synthetic Control Method
We assume that the Indian Ocean tsunami in 2004 is an exogenous event, and it produces a
sizeable effect on the exposed province. The SCM constructs a counterfactual group whose
PROCEEDING
The International Conference on Applied Statistics
September 16-19, 2013
unexposed provinces that resemble Aceh in economic characteristics before the disaster took place.
After the occurrence of the disaster, we estimate the counterfactual situation of Aceh in the absence
of the tsunami through the outcomes of the synthetic group. We formalize this concept as follows.
We observe 26 provinces in Indonesia for the period . Let
be the Aceh Province, and be the other provinces. Here, we let be the year
when tsunami struck Aceh and be the outcome variable which evaluates the impact of the
tsunami on province at the time . Additionally, is the outcome variable that refers to the
tsunami and is the outcome variable when the tsunami did not occur. Our goal is to estimate the
effect of the tsunami on the economics of the Aceh Province during 2005-2011. This effect is
defined as the difference between the outcome variable that refers to the tsunami and when it did
not occur, or:
, (1)
However, the in those periods is unobserved. Therefore, this outcome will be estimated
synthetically using the SCM.
Following Abadie et al. (2010), to construct the synthetic control, we define a (25x1) vector
of weights such that for and . Abadie and
Gardeazabal (2003) and Abadie et al. (2010) choose such that
(2)
For calculating the synthetic control methods, we use R.3.0 with Synth-R. packages (Abadie et al.,
2011).
2.2.Synthetic Regression
The synthetic regression method is a simple linear regression model: , where Y
is the dependent variable, in this case is Aceh’s economic growth, g(.) is a linear function and X is the independent variables. Those independent variables are the synthetic regions whose
GRDP/Capital is similar to the growth rate of Aceh.
The synthetic regions are chosen by using a comparing series procedure, as explained in
the following section.
Comparing Series
We consider two series of the form (Franke and Halim, 2007)
PROCEEDING
The International Conference on Applied Statistics
September 16-19, 2013
where are independent with zero mean and finite variance, =
. are the general functions in which represent the series for Aceh and represent
the series other than Aceh. We want to find a synthetic region which has similar economic
characteristics as Aceh, i.e., we want to test the hypothesis . are arbitrary
functions. Because is equidistant, we can estimate by using the Priestley-Chao (1972)
kernel estimator as:
; (4)
where denotes a rescaled kernel function. is a probability density symmetric
around zero, is the bandwidth to control the smoothness of the estimated functions.
To perform the test, we measure the distance between the estimated functions and
. We reject the null hypothesis if that distance is too large. The distance itself is defined as:
(5)
In the same vein, we reject the null hypothesis at a level of if , where is approximated
by using a bootstrap procedure.
The bootstrap procedure is started by estimating the residuals:
; (6)
We then generate the bootstrap residuals and consider two bootstrap series which
are constructed as:
(7)
The bootstrap for the kernel estimators is then calculated by using:
(8)
The bootstrap test statistic can be constructed as:
(9)
To get a Monte Carlo approximation of quantile , we generate the realization of repeatedly
PROCEEDING
The International Conference on Applied Statistics
September 16-19, 2013
3. RESULTS AND DISCUSSION
We study the causal effect of catastrophic natural disasters on the short- and medium-term
economic growth. We take a direct case of the 2004 Asian tsunami in Indonesia. One day after
Christmas in 2004 at 00.59 GMT, a 9.0 Richter-magnitude earthquake struck the west coast of
Sumatra, a major island in the western part of Indonesia. It subsequently generated ferocious
tsunami waves in the Aceh Province of Sumatra. This catastrophic disaster is considered as one of
the worst tsunamis in human history. According to the official statistics, the death toll of the Aceh
tsunami was more than 165,000 people and over a half million people were displaced. The total
estimate of economic damages and losses was approximately US$ 4.5 billion corresponding to
97.4% of Aceh’s gross regional domestic product (GRDP) in 2003 (Athukorala and Resosudarmo, 2005; Athukorala, 2012).
3.1.Data
The data set was taken from the Indonesian Central Bureau of Statistics (BPS) and includes
26 Indonesian provinces1. The data set is annual and covers the period 1994-2011. All nominal
variables are converted in 2000 prices. The description of the variables is given below.
The outcome variable is economic growth. It is measured by the change in gross regional
domestic product (GRDP) per capita. The predictors of economic growth are:
- The sectoral value added consists of nine major sectors in the economy, that is, agriculture, mining and quarrying, manufacturing, construction, utilities, trade, hotel, and restaurant,
transportation and communication, finance, and services. They are also in growth rate.
- The variable of investment is defined as the growth rate of gross fixed capital formation.
- The growth rate of government consumption.
- The proxies for human capital are of the enrollment numbers of primary school, junior high, senior high school, and university. They are expressed in logarithms. The other variables are
adult literacy rate and years of schooling.
- Population density is measured as total population divided by land area in kilometer square.
1 Prior to the fall of the New Order Regime in 1998, Indonesia had 27 provinces. It turned to be 26 provinces
PROCEEDING
The International Conference on Applied Statistics
September 16-19, 2013
3.2.Results
3.2.1
Using Synthetic Regression MethodWe first compare the growth rate of the gross regional domestic product per capita (or
GRDP/Cap) of each of the 25 provinces to the Aceh Province by using the comparing series method.
We find that Riau, South Sumatra, Jogjakarta, East Nusa Tenggara, Central Kalimantan, and East
Kalimantan have similar GRDP/Cap characteristics as Aceh.
We then formulate a linear regression model with the GRDP/Cap of Aceh as the dependent
variable and the GRDP/Cap of the selected regions as the independent variables. The estimated
coefficients show that the GRDP/Cap of Aceh closely resembles Riau, East Nusa Tenggara, and East
Kalimantan.
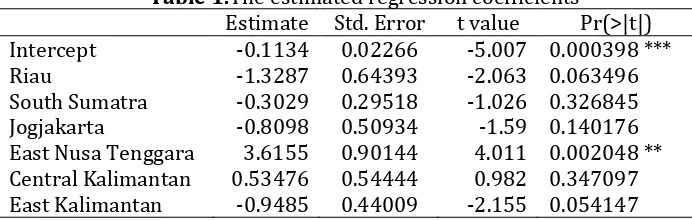
Table 1.The estimated regression coefficients
Estimate Std. Error t value Pr(>|t|)
Intercept -0.1134 0.02266 -5.007 0.000398 ***
Riau -1.3287 0.64393 -2.063 0.063496
South Sumatra -0.3029 0.29518 -1.026 0.326845
Jogjakarta -0.8098 0.50934 -1.59 0.140176
East Nusa Tenggara 3.6155 0.90144 4.011 0.002048 ** Central Kalimantan 0.53476 0.54444 0.982 0.347097 East Kalimantan -0.9485 0.44009 -2.155 0.054147
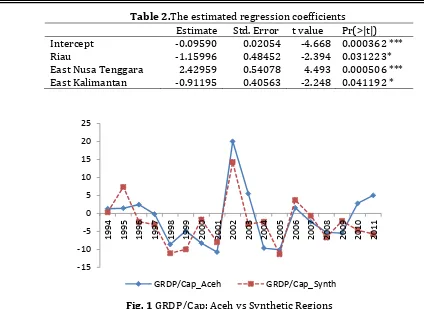
Using those three regions, we formulate the second linear model and plot the prediction of
that model as the GRDP/Cap of the synthetic region against the GRDP/Cap of Aceh (Fig. 1). From
that figure, we can see that the GRDP/Cap of Aceh and the synthetic group is very similar. The
figure also confirms that after 2004 (the year of the Asian tsunami), the GRDP/Cap of the synthetic
regions is higher than the Aceh Province. This finding lends support to the hypothesis that the
PROCEEDING
The International Conference on Applied Statistics
September 16-19, 2013
Table 2.The estimated regression coefficients
Estimate Std. Error t value Pr(>|t|)
Intercept -0.09590 0.02054 -4.668 0.000362 ***
Riau -1.15996 0.48452 -2.394 0.031223*
East Nusa Tenggara 2.42959 0.54078 4.493 0.000506 *** East Kalimantan -0.91195 0.40563 -2.248 0.041192 *
Fig. 1 GRDP/Cap: Aceh vs Synthetic Regions
3.2.2
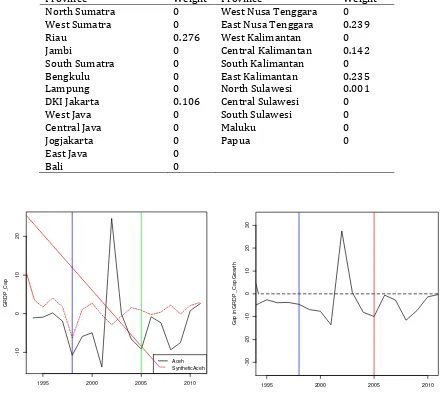
Using Synthetic Control MethodAccording to the synthetic control method (SCM), the Aceh’s growth trajectory prior to the
tsunami is best represented by a combination of DKI Jakarta, Riau, East Nusa Tenggara, Central
Kalimantan, and East Kalimantan, the provinces with positive weights (Table 3). It is important to
note that these synthetic control provinces are also captured in our proposed method, with the
exception of DKI Jakarta. However, we cast some doubts on the SCM results since the GRDP/Cap for
the synthetic regions is above the GDP/Cap for Aceh in most of the years, except in the year 2002
(Fig. 2, left). In addition, the GRDP/Cap gap of Aceh and the synthetic provinces is also negative,
apart from the year 2002 (Fig. 2, right).
PROCEEDING
The International Conference on Applied Statistics
September 16-19, 2013
Table 3.Synthetic Weight for Aceh
Province Weight Province Weight
North Sumatra 0 West Nusa Tenggara 0
West Sumatra 0 East Nusa Tenggara 0.239
Riau 0.276 West Kalimantan 0
Jambi 0 Central Kalimantan 0.142
South Sumatra 0 South Kalimantan 0
Bengkulu 0 East Kalimantan 0.235
Lampung 0 North Sulawesi 0.001
DKI Jakarta 0.106 Central Sulawesi 0
West Java 0 South Sulawesi 0
Central Java 0 Maluku 0
Jogjakarta 0 Papua 0
East Java 0
Bali 0
Fig. 2 GRDP/Cap: Aceh vs Synthetic Regions (left), GRDP/Cap Gap: Aceh vs Synthetic Regions (right)
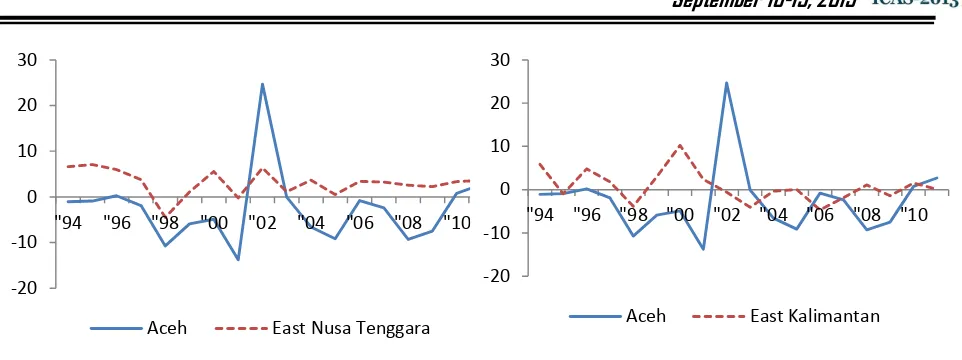
3.3 Discussion
It is well known that, in some instances, the synthetic control method (SCM) may result in
poor model fit. Under this condition, it is recommended for not using the SCM (Abadie et al., 2010).
In our case, the SCM does not give a reasonable choice of the synthetic regions, particularly for
choosing DKI Jakarta (the capital of Indonesia) as one of the synthetic regions for Aceh in terms of
the GRDP/Cap growth. The graphical plot of the GRDP/Cap yearly basis between Aceh vis-à-vis DKI
Jakarta shows that most of the time, the GRDP/Cap of DKI Jakarta is above Aceh, except in the year
1998 and 2002 (Fig. 3). With respect to the unusual trend in 1998, we argue that Aceh’s economy
grew stronger than the economy of DKI Jakarta even though the two provinces experienced worse
1995 2000 2005 2010
-1 0 0 10 20 year G R D P _ C a p Aceh SyntheticAceh
1995 2000 2005 2010
PROCEEDING
The International Conference on Applied Statistics
September 16-19, 2013
economic downturns as a result of the Asian financial crisis.2 This argument is fairly acceptable
since the crisis led to the deepest contractions in the industrial and service sectors, the two sectors
that dominated DKI Jakarta’s economy, whereas the main pillars of Aceh’s economy (i.e. the agricultural and oil and gas sectors) were less affected. As for the year 2002, high price levels for oil
and gas and a substantial amount of Special Autonomy Fund (Dana Otsus) from the central
government partly contributed to Aceh’s remarkable economic growth.
On the other side, both Aceh and the three synthetic regions that are chosen by our
proposed method seem to follow a similar economic growth path from year to year, except for the
year of 2002 (Fig. 3).3 Therefore, we highlight that our chosen method gives more reasonable
results as compared to the SCM. From the theoretical part, our findings suggest that the tsunami
disaster has a negative impact on regional economic growth. This evidence is consistent with
previous studies that employ the standard SCM, such as Noy (2009), Coffman and Noy (2012), and
Cavallo et al. (forthcoming).
2 In 1998, the Asian financial crisis severely hit Indonesia. It triggered a big riot in Jakarta and forced the Indonesian
President at that time (the late President Soeharto) to end his 32 years presidency in Indonesia.
3
With regard to the rapid growth of Aceh in 2002, we just provide two plausible explanations in the previous paragraph. -20 -10 0 10 20 30
"94 "96 "98 "00 "02 "04 "06 "08 "10
Aceh DKI Jakarta
PROCEEDING
The International Conference on Applied Statistics
September 16-19, 2013
Fig 3.GRDP/Cap: Aceh vs Synthetic Regions
4. CONCLUSION
We show that the synthetic regression method provides more convincing results as
compared to the traditional synthetic control method. As the heart of the synthetic regression
method, the comparing series procedures are able to choose the synthetic control provinces that
best resemble Aceh’s economic growth trajectory. Our results are in the right direction, but we have
not finished yet. Finding a well-defined approach to determine the weight of the synthetic regions
instead of using simple linear regression models opens up new avenues for our future work.
ACKNOWLEDGMENT
The authors gratefully acknowledge financial support for this research from the Indonesian
Directorate General of Higher Education (DIKTI).
5. REFERENCES
Abadie, A., Diamond, A. &Hainmueller, J. (2010). Synthetic Control Methods for Comparative Case Studies: Estimating the Effect of California's Tobacco Control Program. Journal of the American Statistical Association,Volume 105, 493–505.
Abadie, A., Diamond, A. &Hainmueller, J. (2011). Synth: An R Package for Synthetic Control Methods in Comparative Case Studies. Journal of Statistical Software,Volume42, 1-17.
Athukorala, P.-C.(2012). Indian Ocean Tsunami: Disaster, Generosity, and Recovery. Asian Economic Journal,Volume 26, 211-231.
Athukorala, P.-C.&Resosudarmo, B. P. (2005). The Indian Ocean Tsunami: Economic Impact, Disaster Management, and Lessons. Asian Economic Papers,Volume 4, 1-39.
Cavallo, E. A., Galiani, S., Noy, I. & Pantano, J. forthcoming. Catastrophic Natural Disasters and Economic Growth. The Review of Economics and Statistics.
-20 -10 0 10 20 30
"94 "96 "98 "00 "02 "04 "06 "08 "10
Aceh East Nusa Tenggara
-20 -10 0 10 20 30
"94 "96 "98 "00 "02 "04 "06 "08 "10
PROCEEDING
The International Conference on Applied Statistics
September 16-19, 2013
Coeffman, M. & Noy, I. (2012). Hurricane Iniki: Measuring the Long-term Economic Impact of a Natural Disaster Using Synthetic Control. Environment and Development Economics, Volume 17, 187-205.
Eclac(2003).Handbook for Estimating the Socio-Economic and Environmental Effects of Disasters, United Nations Economic Commission for Latin America and the Caribbean.
Franke, J., &Halim, S. (2007). Wild Bootstrap Tests: Regression Models for Comparing Signals and Images, IEEE Signal Processing Magazine July 2007, 31-37.
Halim, S. & Jiang, H. (2013). The Effect of Operation 24 Hours on Reducing Collision in the City of Edmonton, Accident Analysis and Prevention, Volume 58, 106-114.
Hamed, M.M, Al-Fideh, B.M., Al-Sharif, M.M.(1999). Traffic Accidents under the Effect of the Gulf Crisis, Safety Science, Volume 33, 59-68.
Noy, I. 2009.The Macroeconomic Consequences of Disasters.Journal of Development Economics,
Volume 88, 221-231.
Pelling, M., Ozerdem, A. &Barakat, S. (2002). The Macro-Economic Impact of Disasters.Progress in Development Studies,Volume 2, 283-305.