Editor in Chief
INDIRA PRABASARI
Universitas Muhammadiyah Yogyakarta
Editorial Board
AGUNG ASTUTI
Universitas Muhammadiyah Yogyakarta CHANDRA KURNIA SETIAWAN
Universitas Muhammadiyah Yogyakarta DINA WAHYU TRISNAWATI
Universitas Muhammadiyah Yogyakarta GUNAWAN BUDIYANTO
Universitas Muhammadiyah Yogyakarta INNAKA AGENG RINEKSANE
Universitas Muhammadiyah Yogyakarta
Alamat Redaksi
REDAKSI PLANTA TROPIKA Program Studi Agroteknologi
Fakultas Pertanian, Universitas Muhammadiyah Yogyakarta Jl. Ring Road Selatan, Tamantirto, Kasihan, Bantul
Telp (0274) 387646 psw 224. Email: [email protected]
Website: http://journal.umy.ac.id/index.php/pt
Agroteknologi, Fakultas Pertanian, Universitas Muhammadiyah Yogyakarta bekerjasama dengan Perkumpulan Agroteknologi/ Agroekoteknologi Indonesia (PAGI). Harga langganan satu tahun Rp. 250.000 / tahun.
70 - 78 Perbedaan Sifat Fisik, Kimia dan Sensoris Tepung Umbi Suweg (Amorphophallus campamulatus BI) pada Fase Dorman dan Vegetatif
Umar Hafidz Asy’ari Hasbullah dan Rini Umiyati Program Studi Teknologi Pangan, Universitas PGRI Semarang
79 - 87 Application of Jatropha Rind Compost as K Source in The Sweet Corn (Zea mays saccharata
Sturt.) Cultivation
Bagus Arrasyid, Gunawan Budiyanto, Titiek Widyastuti
Department of Agrotechnology, Faculty of Agriculture, Universitas Muhammadiyah Yogyakarta
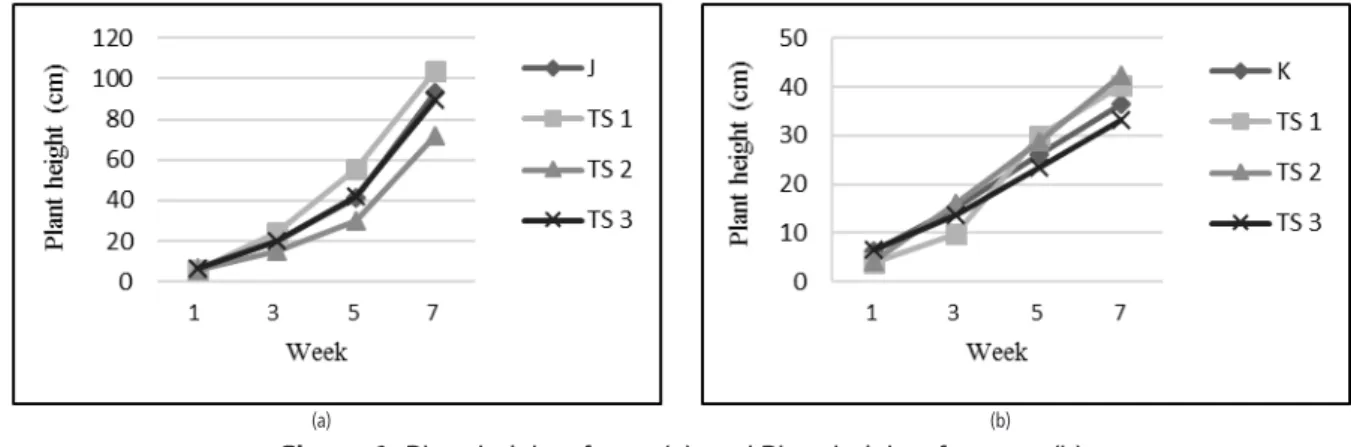
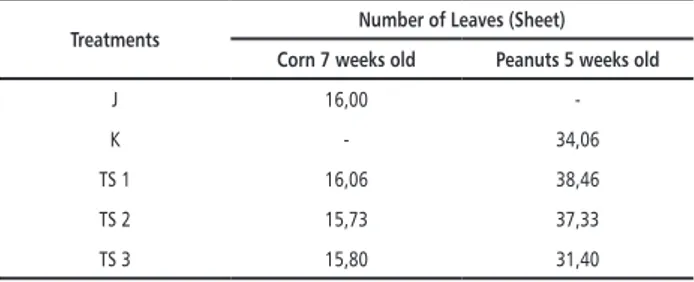
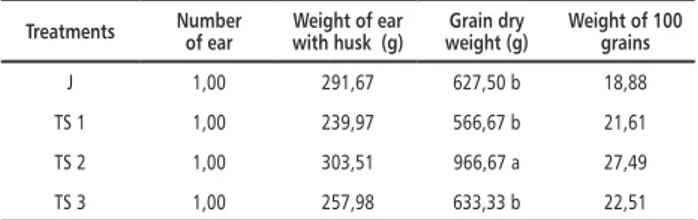
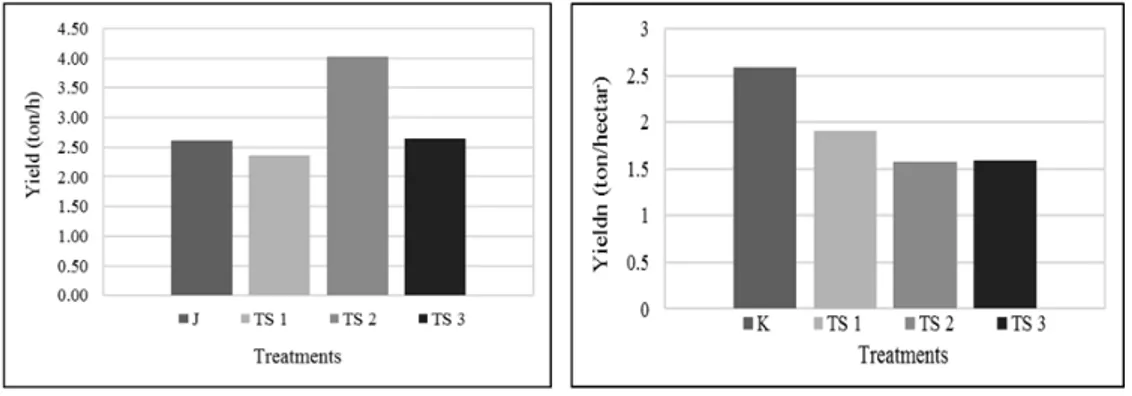
88 - 95 The Effect of Intercropping System of Corn (Zea mays, L.) and Peanut (Arachis hypogaea, L.) on Yield Production in Ungaran
Dharend Lingga Wibisana, Gunawan Budiyanto, Titiek Widyastuti
Department of Agrotechnology, Faculty of Agriculture, Universitas Muhammadiyah Yogyakarta
96 - 105 Application of Cow Rumen Liquid in Palm Sugar Waste Compost for Cultivating Sweet Corn in Coastal Sandy Soil of Samas Beach Bantul
Nadia Dwi Larasati, Gunawan Budiyanto, Titiek Widyastuti
Department of Agrotechnology, Faculty of Agriculture, Universitas Muhammadiyah Yogyakarta
106 - 109 Effect of Foliar Liquid Organic Fertilizer on Neera Production
Purwanto, Mujiono, Tarjoko
Departement of Agrotechnology, Faculty of Agriculture, Jenderal Soedirman University
110 - 115 Whitefly Infestation and Economic Comparison of Two Different Pest Control Methods on Soybean Production
Fitrah Murgianto and Purnama Hidayat
Department of Plant Protection, Faculty of Agriculture, Bogor Agricultural University
116 - 126 Phylogenetic Relationships of Nine Cultivars of Strawberries (Fragaria spp.) Based on Anatomical and Morphological Characters
Rina Sri Kasiamdari1, Ganies Riza Aristya2, Evi Inayati3
1Laboratory of Plant Systematics, Faculty of Biology, Universitas Gadjah Mada, 2Laboratory of Genetics and Breeding, Faculty of Biology, Universitas Gadjah Mada, 3Faculty of Biology, Universitas Gadjah Mada
127 - 131 Growth and Yield of Lettuce (Lactuca sativa L.) Under Organic Cultivation
Mujiono1, Suyono2, Purwanto1
1Agrotechnology Department, Faculty of Agriculture, Jenderal Soedirman University 2Agribusiness Departement, Faculty of Agriculture, Jenderal Soedirman University
Daftar Isi
Editorial
Jurnal Planta Tropika dengan P-ISSN 0216-499X dan E-ISSN 2528-7079 yang diterbitkan oleh Universi-tas Muhammadiyah Yogyakarta, merupakan jurnal yang berisi karya ilmiah di bidang ilmu-ilmu Pertanian (Journal of Agro Science). Dengan penuh rasa syukur ke hadirat Allat SWT telah terbit Volume 5 Nomor 2 untuk Tahun 2017.
Pada edisi ini terdapat perubahan susunan Dewan Editor yaitu Indira Prabarsari sebagai Editor in Chief,
Agung Astuti, Chandra Kurnia Setiawan, Dina Wahyu Trisnawati, Gunawan Budiyanto, Innaka Ageng
Rineksane sebagai Editorial Board.
Jurnal Planta Tropika menyajikan delapan artikel hasil penelitian di bidang Agrosains, mengenai sistem
budidaya tanaman, kandungan bahan aktif tanaman, metode penyediaan bibit dan mikrobia bermanfaat.
Karya ilmiah tersebut membahas tentang : (1) Perbedaan Sifat Fisik, Kimia dan Sensoris Tepung Umbi
Suweg (Amorphophallus campamulatus BI) pada Fase Dorman dan Vegetatif, (2) Application of Jatropha Rind Compost as K Source in The Sweet Corn (Zea mays saccharata Sturt.) Cultivation, (3) The Effect of Intercropping System of Corn (Zea mays, L.) and Peanut (Arachis hypogaea, L.) on Yield Production in Ungaran, (4) Application of Cow Rumen Liquid in Palm Sugar Waste Compost for Cultivating Sweet Corn in Coastal Sandy Soil of Samas Beach Bantul, (5) Effect of Foliar Liquid Organic Fertilizer on Neera Production, (6) Whitefly Infestation and Economic Comparison of Two Different Pest Control Methods on Soybean Production, (7) Phylogenetic Relationships of Nine Cultivars of Strawberries (Fragaria spp.) Based on Anatomical and Morphological Characters dan (8) Growth and Yield of Let-tuce (Lactuca sativa L.) Under Organic Cultivation.
Redaksi menyampaikan terima kasih kepada para penulis naskah, mitra bestari, editor pelaksana, pimpi-nan dan LP3M UMY atas partisipasi dan kerjasamanya. Harapan kami, jurnal ini dapat bermanfaat bagi pembaca atau menjadi referensi peneliti lain dan berguna untuk kemajuan dunia pertanian.
Pedoman Penulisan
BENTUK NASKAH
PLANTA TROPIKA menerima naskah berupa hasil penelitian (research papers) dalam Ba-hasa Indonesia atau BaBa-hasa Inggris. Naskah yang diajukan adalah naskah belum pernah diterbit-kan di jurnal atau terbitan lainnya.
CARA PENGIRIMAN NASKAH
Pengiriman naskah dilakukan melalui website http://journal.umy.ac.id/index.php/pt/index jurnal kami. Jika membutuhkan informasi ter-kait proses dan prosedur pengiriman naskah bisa dikirimkan ke email [email protected]. Alamat redaksi : Program Studi Agroteknologi, Fakultas Pertanian, Universitas Muhammadiyah Yogyakarta, Jl. Ring Road Selatan, Tamantirto, Kasihan, Bantul, Telp (0274) 387646 psw 224, ISSN: 2528-7079.
FORMAT NASKAH
Naskah yang dikirim terdiri atas 15-20 hala-man kwarto (A4) dengan jenis huruf Times New Roman berukuran 12 point, spasi 1,5 dengan margin kiri-kanan dan atas bawah kertas masing-masing 2,5 cm. Semua halaman naskah terma-suk gambar, tabel dan referensi harus diberi nomor urut halaman. Setiap tabel atau gambar diberi nomor urut dan judul.
Sistematika penulisan naskah adalah sebagai berikut:
JUDUL NASKAH : Ringkas dan informatif. Tidak kapital (Huruf awal tiap kata dibuat kapital), tebal, dan maksimal 14 kata.
NAMA SEMUA PENULIS : Tidak kapital, diurutkan dari penulis pertama diikuti peulis berikutnya dengan penanda institusi masing-masing penulis.
INSTITUSI SEMUA PENULIS : Tidak kapital, diurutkan sesuai dengan institusi masing-mas-ing penulis dengan penanda nomor
EMAIL : Cantumkan salah satu email penulis yang digunakan untuk korespondensi naskah ABSTRAK : Ditulis dalam Bahasa Indonesia. 1
spasi dalam satu paragraf, maksimal 200 kata. Berisi latar belakang, tujuan, metode, hasil penelitian, dan simpulan. Diikuti kata kunci maksimal 5 (lima) kata.
ABSTRACT : Ditulis dalam Bahasa Inggris, 1 spasi dalam satu paragraf, maksimal 200 kata. Diikuti kata kunci (key words), maksimal 5 (lima) kata.
PENDAHULUAN : Berisi latar belakang, peru-musan masalah dan tujuan penelitian .
BAHAN DAN METODE : Berisi detail bahan dan metode yang digunakan di dalam pene-litian, teknik pengumpulan data dan analisis data.
HASIL DAN PEMBAHASAN : Hasil penelitian harus jelas dan mengandung pernyataan ten-tang hasil yang dikumpulkan sesuai dengan data yang telah dianalisis. Pembahasan berisi tentang signifikansi dari hasil penelitian.
SIMPULAN : Penulis diharapkan untuk mem-berikan simpulan yang ringkas dan menjawab Tujuan Penelitian.
UCAPAN TERIMA KASIH (jika diperlukan) DAFTAR PUSTAKA : Satu spasi, sesuai contoh
panduan jurnal Planta Tropika
CONTOH PENULISAN DAFTAR PUSTAKA Penulisan daftar pustaka disusun alfabetis dengan pedoman penulisan sebagai berikut:
BUKU
Contoh:
Gardner, F.P., R.B. Pearce dan R.L. Mitchell. 1991. Fisiologi Tanaman Budidaya (Terjemahan Herawati Susilo). UI Press. Jakarta.
JURNAL
Contoh:
Parwata, I.G.M.A., D. Indradewa, P.Yudono dan B.Dj. Kertonegoro. 2010. Pengelompokan genotipe jarak pagar berdasarkan ketahanannya terhadap kekeringan pada fase pembibitan di lahan pasir pantai. J. Agron. Indonesia 38:156-162.
TESIS/DISERTASI
Contoh:
Churiah. 2006. Protein bioaktif dari bagian tanaman dan akar transgenic Cucurbitaceae serta aktivitas antiproliferasi galur sel kanker in vitro. Disertasi. Sekolah Pascasarjana. Institut Pertanian Bogor. Bogor.
ARTIKEL DALAM PROSIDING
Contoh:
Widaryanto dan Damanhuri. 1990. Pen-garuh cara pengendalian gulma dan pembe-rian mulsa jerami terhadap pertumbuhan dan produksi bawang putih (Allium sativum L.). Pro-siding Konferensi Nasional X HIGI hal. 376-384.
FORMAT GAMBAR
Pada setiap gambar harus diberikan Judul di
bawah gambar. Keterangan tambahan mengenai
gambar dituliskan dengan huruf kecil kecuali pada karakter pertama Huruf besar pada tiap ka-limat. Seluruh gambar harus diberi penomoran secara berurutan. Peletakan Gambar didekatkan dengan pembahasan mengenai gambar.
Contoh Gambar :
Gambar 1. Jumlah daun (helai) tanaman Jagung Keterangan :
A = 250 kg KCl/hektar + 0 kg KJP/hektar B = 125 kg KCl/hektar + 273,89 kg KJP/hektar C = 62,5 kg KCl/hektar + 410,84 kg KJP/hektar D = 0 kg KCl/hektar + 547,79 kg KJP/hektar
Gambar 2. Diameter (cm) batang tanaman Jagung Keterangan : A = 250 kg KCl/hektar + 0 kg KJP/hektar B = 125 kg KCl/hektar + 273,89 kg KJP/hektar C = 62,5 kgKCl/hektar + 410,84 kg KJP/hektar D = 0 kg KCl/hektar + 547,79 kg KJP/hektar
Gambar 1. Gambar 2. dan seterusnya, Guna-kan huruf besar hanya di awal nama gambar saja tanpa diakhiri titik dan Keterangan tambahan pada gambar harus terlihat di bawah gambar.
FORMAT TABEL
Tabel harus diberikan judul di atas tabel, judul tabel diawali dari tepi kiri (left alignment) tabel. Keterangan tambahan mengenai tabel diletakan dibawah tabel. Keterangan pada tabel juga ditulis dengan huruf besar di awal saja demikian juga dengan judul-judul dalam tabel. Peletakan Tabel didekatkan dengan pembahasan mengenai tabel.
Contoh Tabel :
Tabel 1. Hasil analisis kompos buah PARAMETER JARAK PAGAR SEBELUM
DIKOMPOSKAN JARAK PAGAR SETELAH DIKOMPOSKAN SNI KOMPOS KETERANGAN Kadar Air 22,49 % 45,79 % ≤ 50 % Sesuai
pH 7,05 8,02 4 - 8 Sesuai
Kadar C-Organik 10,01 5,11 9,8 - 32 % Belum sesuai Bahan Organik 17,42 % 8,81 % 27-58 Belum sesuai N-Total 0,97 % 2,69 % < 6 % Sesuai C / N Ratio 10,44 1,90 ≤ 20 Sesuai Kalium - 9,06 % < 6 % Sesuai Keterangan : **) Bahan bahan tertentu yang berasal dari bahan organik alami diperboleh-kan mengandung kadar P2O5 dan K2O > 6% (dibuktikan dengan hasil laboratorium).
PENDAHULUAN
Suweg (Amorphophallus campanulatus) meru-pakan salah satu jenis umbi yang tumbuh liar di berbagai daerah di Indonesia. Tanaman ini belum banyak dieksplorasi dan biasa tumbuh subur dibawah naungan tanaman lain. Tanaman suweg biasa bertunas diawal musim kemarau dan pada akhir tahun dimusim kemarau umbinya bisa dipanen (Kasno dkk., 2009). Produktivitas tanaman suweg berkisar 47,61 ton/hektar (Suja,
2013). Suweg mempunyai prospek untuk dikem-bangkan sebagai sumber pangan berupa tepung.
Tepung umbi suweg memiliki kandungan karbohidrat yang tinggi. Beberapa peneliti mel-aporkan kandungan karbohidratnya 70,75 % (Srivastava dkk., 2014), 83,18 % (Faridah, 2005), dan 85,82 % (Septiani dkk., 2005). Hal ini menunjukkan bahwa tepung suweg berpotensi sebagai sumber karbohidrat.
Perbedaan Sifat Fisik, Kimia dan Sensoris Tepung Umbi Suweg
(
Amorphophallus campamulatus
BI) pada Fase Dorman
dan Vegetatif
DOI: 10.18196/pt.2017.066.70-78
Umar Hafidz Asy’ari Hasbullah* dan Rini Umiyati
Program Studi Teknologi Pangan, Universitas PGRI Semarang,
Jalan Sidodadi Timur No. 24, Semarang Jawa Tengan 50125, Telp: +62 (024) 8316377, Fax: +62 (024) 8448217, *Corresponding author, e-mail: [email protected]/[email protected]
ABSTRAK
Penelitian ini bertujuan untuk mempelajari perbedaan sifat fisik, kimia dan sensoris tepung suweg dari fase dorman dan vegetatif. Parameter fisik yang diuji meliputi rendemen, edible portion, bulk density, derajat kecerahan, particle size index, indeks penyerapan air dan indeks kelarutan air. Parameter kimia yang diuji meliputi kadar air, abu, lemak, protein, karbohidrat, pati dan gula reduksi. Parameter sensoris yang diuji meliputi uji hedonik warna dan aroma serta uji deskriptif warna dan aroma. Hasil penelitian menunjukkan bahwa karakter fisik tepung suweg dari fase dorman dan fase vegetatif berbeda nyata pada semua parameter. Rendemen, edible portion, bulk density, derajat kecerahan, dan particle size index fase dorman lebih tinggi dari fase vegetatif. Karakter kimia tepung suweg dari fase dorman dan fase vegetatif berbeda nyata kecuali lemak dan karbohidrat. Pati fase dorman lebih besar dari fase vegetatif, sedangkan gula reduksinya berkebalikan. Karakter sensoris tepung suweg dari fase dorman dan fase vegetatif berbeda nyata pada parameter hedonik warna, deskriptif warna dan deskriptif aroma. Panelis menilai tepung suweg yang dihasilkan dari fase vegetatif memiliki warna lebih coklat dan berbau cenderung lebih kuat dibandingkan fase dorman sehingga lebih tidak disukai warna dan aromanya. Tepung suweg sebaiknya dipilih dari fase dorman. Pemanfaatan tepung suweg disarankan untuk produk seperti cookies dan biskuit yang bisa ditambankan bahan perisa untuk menutupi adanya warna coklat dan aroma khas tepung suweg.
Kata kunci: Amorphophallus campanulatus, Tepung umbi, Suweg, Fase dorman
ABSTRACT
This study aims to determine of differences in physical, chemical and sensory properties of suweg flour from the dormant and vegetative phases. Physical parameters include yield, edible portion, bulk density, brightness, particle size index, water absorption index and water solubility index. Chemical param
-eters include the moisture, ash, fat, protein, carbohydrates, starches and sugars reduction. Sensory param-eters include hedonic test of color and aroma as well as descriptive test of color and aroma. The results showed that the physical characteristics of flour suweg dormant phase and vegetative phase significantly different at all parameters. Yield, edible portion, bulk density, brightness, particle size index of dorman phase higher than vegetative phase. Chemical characteristics from dormant phase and vegetative phase were significantly different at all parameters, except fat and carbohydrate. Starch contain in dorman phase higher than vegetative phase. But in contrast to the sugar reduction contain. Panellists assess the suweg flour produced from the vegetative phase has a more brown color and smells stronger than the dormant phase so it is less preferred color and aroma. Suweg flour should be selected from the dormant phase. Utilization of flour suweg is recommended for products such as cookies and biscuits that can be grown ingredients to cover the presence of brown and off flavor.
Tananam suweg selama hidupnya mengalami dua fase kehidupan yaitu fase pertumbuhan vege-tatif dan fase dorman. Selama fase tersebut akan terjadi berbagai macam perubahan komponen di dalam tanaman ini, termasuk dalam umbinya (Pitojo, 2007). Supriyadi dkk., (2016) menyam-paikan bahwa pemanenan di musim penghujan memberikan dampak karakteristik tepung suweg berbeda dengan pemanenan di musim kemarau. Umbi suweg mengalami fase vegetatif ketika musim hujan dan akan mengalami fase dorman ketika musim kemarau. Hal ini akan berdampak pada tepung umbi yang dihasilkan. Perubahan karakter ini perlu diidentifikasi karena dalam aplikasinya akan berpengaruh pada produk akhir yang dihasilkan. Berdasarkan uraian tersebut maka perlu dilakukan studi yang bertujuan untuk mengetahui dampak adanya fase dormansi dan fase vegetatif pada tanaman suweg terha-dap sifat fisik, kimia dan sensoris tepung umbi suweg.
BAHAN DAN METODE
Bahan yang digunakan adalah umbi suweg yang di ambil ketika fase dormansi dan fase veg-etatif diperoleh dari Kecamatan Banjarmangu, Kabupaten Banjarnegara, Jawa Tengah. Umbi suweg fase dorman diperoleh ketika musim kemarau setelah tanaman mati dan tanah tempat tumbuh mengering, sedangkan umbi suweg fase vegetatif diperoleh ketika tanaman suweg ma-sih hidup dan berdaun hijau pada waktu akhir musim penghujan atau awal musim kemarau. Penelitian ini dilakukan menggunakan rancan-gan acak lengkap faktor tunggal yaitu fase hidup yang terdiri dari fase vegetatif dan fase dorman. Variabel terikat terdiri dari sifat fisik tepung, sifat kimia dan sifat sensoris.
Prosedur pembuatan tepung umbi suweg mengacu Septiani, dkk. (2015) yang dimodifikasi tanpa perendaman HCl dan CaCO3. Umbi suweg dikupas, diiris dengan ketebalan 2 cm, dan dicuci. Selanjutnya dikeringkan selama 5 jam pada suhu 60 °C. Kemudian ditepungkan dan diayak 60 mesh. Tepung suweg disimpan dalam plastik pada suhu kamar sampai sebelum dianalisis.
Analisis Sifat Fisik Tepung Suweg
Sifat fisik yang diukur dalam studi ini antara lain bulk density, warna tepung dianalisis inten-sitas kecerahan (L) dengan menggunakan chro-mameter (Konica Minolta Chrochro-mameter CR-400) (Faridah, 2005), rendemen dan edible portion
(Muchtadi dkk., 2013), indeks penyerapan air (IPA) dan indeks kelarutan air (IKA) dengan metode Anderson (Anderson dkk., 1969), dan
particle size index (Bejarano dkk., 2007).
Analisis Sifat Kimia Tepung Suweg
Kadar air, abu, lemak, protein dianalisis den-gan mengacu pada AOAC (2005). Karbohidrat by difference, kadar pati dan gula reduksi diukur menggunakan metode Sudarmadji dkk., (2010).
Analisis Sifat Sensoris Tepung Suweg
Sifat sensoris yang diamati adalah uji deskrip-tif dan uji hedonik terhadap parameter warna dan aroma. Pengujian deskriptif dilakukan dengan menggunakan panelis semi terlatih. Uji hedonik dilakukan oleh 25 panelis. Skor nilai warna deskriptif 1: tidak coklat, 2: agak coklat (coklat cerah), 3: cukup coklat (coklat muda), 4: coklat, 5: sangat coklat (coklat gelap). Skor nilai aroma deskriptif 1: tidak kuat, 2: agak kuat, 3: cukup kuat, 4: kuat, 5: sangat kuat. Skor nilai he-donik 1: sangat tidak suka, 2: tidak suka, 3: agak
suka, 4: netral, 5: agak suka, 6: suka, 7: sangat suka.
Data hasil pengujian dianalisis dengan t test. Apabila hasil analisis tersebut menunjukkan perbedaan antara perlakuan, maka dilanjutkan dengan uji Duncann multiple range test (DMRT)
pada taraf 5 %. Pengujian dilakukan dengan bantuan software SPSS versi 16.0 (2007).
HASIL DAN PEMBAHASAN
Sifat Fisik Tepung Suweg
Sifat fisik dari tepung suweg yang dihasilkan dari fase dorman dan fase vegetatif disajikan pada Tabel 1. Umbi suweg yang digunakan beru-kuran 1 - 1,5 kg untuk fase dorman dan 1 - 2 kg untuk fase vegetatif. Kadar air umbi suweg fase dorman 77,24 ± 1,13 %, sedangkan kadar air umbi suweg fase vegetatif 83,2 ± 0,63 %. Yadav dan Singh (2016) melaporkan bahwa kadar air umbi suweg 76,93 - 77,5 %, sedangkan Datta dkk. (2014) melaporkan 66,08 %. Berdasarkan Tabel 1, tepung suweg yang berasal dari fase dorman memiliki rendemen yang lebih besar dan berbeda nyata dengan fase vegetatif. Hal ini dapat terjadi karena selama fase dorman ter-jadi akumulasi pati sebagai cadangan makanan hasil metabolisme yang akan digunakan untuk tumbuh dan berkembang ketika membentuk tunas (Pitojo, 2007). Nilai rendemen tepung suweg berkisar antara 11-15 % dari berat bahan. Rendemen yang didapatkan dari studi ini masih dibawah nilai rendemen hasil penelitian Richana dan Sunarti (2004) yang menghasilkan nilai rendemen 18 %. Rendemen tepung suweg yang dihasilkan tidak jauh berbeda dengan umbi gan-yong (11,4 %), akan tetapi sangat jauh dibawah ubi kelapa (23,9 %) dan gembili (24,3 %) (Richa-na dan Su(Richa-narti, 2004).
Edible portion (EP) menunjukkan persentase bagian dari suatu bahan pangan yang dapat
dimakan (Muchtadi dkk., 2013; USFDA, 2014). Hasil penelitian menunjukkan bahwa nilai EP umbi suweg yang dihasilkan dari fase dorman lebih besar dan berbeda nyata dengan fase veg-etatif. Nilai EP berkisar antara 73-85 %. EP dari komoditas umbi-umbian sangat bervariasi. Hal tersebut bergantung dari ketebalan lapisan kulit gabus dan korteks yang mendasarinya (Elzebroek, 2008). Nilai EP suweg ini setara dengan EP ubi jalar (81 %), kentang (81 %) dan yam (86 %) (WHO, 2003).
Tabel 1. Sifat Fisik Tepung Umbi Suweg
Parameter Fase Dorman Fase Vegetatif
Rendemen (%) 14,83 ± 1,08 a 10,91 ± 0,46 b Edible portion (%) 84,64 ± 1,26 a 72,62 ± 7.82 b Bulk density (g/ml) 0,659 ± 0,05 a 0,580 ± 0,04 b Particle size index 0,5276 ± 0,04 a 0,4638 ± 0,03 b L 58,78 ± 1,95 a 53,79 ± 1,61 b IPA 0,52 ± 0,22 a 0,86 ± 0,03 b IKA 0,325 ± 0,17 a 0,071 ± 0,08 b Keterangan: Notasi huruf yang sama menunjukkan tidak beda nyata pada α = 0.05. Data disajikan ± standar deviasi.
Bulk density (BD) menunjukkan porositas dari suatu bahan yang menyatakan jumlah rongga yang terdapat diantara partikel bahan (Purnomo dkk., 2015). Nilai BD sangat penting berkai-tan dengan pengemasan, penyimpanan dan transportasi (Faridah, 2005). Hasil penelitian menunjukkan bahwa nilai BD tepung suweg yang diperoleh dari fase dorman berbeda nyata dengan fase vegetatif. BD fase dorman berkisar 0,659 g/ml, sedangkan fase vegetatif 0,58 g/ml. Hal ini dimungkinkan karena PSI tepung suweg fase dorman lebih besar dari fase vegetatif. Nilai BD tepung suweg ini lebih rendah dibandingkan dengan hasil penelitian Faridah (2005) yaitu 0,78 g/ml. Hasbullah dkk. (2017) melaporkan bahwa tepung suweg di beberapa kabupaten di Jawa Tengah memiliki nilai BD 0,38-0,65 g/ml. Apa-bila dibandingkan dengan tepung ubi jalar 6,83
g/ml (Adeleke dan Odedeji, 2010) maka tepung suweg memiliki nilai BD yang rendah.
Particle size index (PSI) menunjukkan tingkat kehalusan tepung, yaitu semakin tinggi nilai nya maka semakin tinggi juga tingkat kehalusan te-pung (Benjarano dkk, 2007). Hasil analisis ditun-jukkan dalam Tabel 1. Nilai PSI tepung suweg yang dihasilkan dari fase dorman berbeda nyata dengan fase vegetatif. Tepung suweg dari fase dorman memiliki PSI (52,76 %) yang lebih tinggi dibandingkan tepung suweg dari fase vegetatif (46,38 %). Hal ini menunjukkan bahwa tepung suweg fase dorman memiliki tingkat kehalusan lebih tinggi dibandingkan tepung suweg fase vegetatif. Semakin halus partikel tepung akan berdampak terhadap derajat kecerahan warnanya yang semakin tinggi.
Indeks penyerapan air (IPA) tepung suweg disajikan dalam Tabel 1. Hasil penelitian menun-jukkan bahwa nilai IPA tepung suweg dari fase dorman berbeda nyata dengan fase vegetatif. Ni-lai IPA fase dorman (0,65) lebih kecil dibanding-kan fase vegetatif (0,84). Hal ini menunjukdibanding-kan bahwa tepung suweg dari fase vegetatif memiliki kemampuan dalam menyerap air yang lebih tinggi dibandingkan dengan fase dorman. Hasil penelitian ini jauh lebih rendah dibandingkan dengan nilai IPA tepung suweg hasil penelitian Richana dan Sunarti (2004) yang sebesar 4,13 g/g. Nilai IPA ini juga masih lebih rendah dari beberapa tepung umbi lainnya seperti tepung umbi gembili 1,91 g/g, tepung umbi ubikelapa 2,51 g/g dan tepung umbi ganyong 3,33 g/g, tepung tape 5,3-6,3 ml/g (Richana dan Sunarti, 2004; Widowati dkk., 1998).
Indeks kelarutan air (IKA) tepung suweg disa-jikan dalam Tabel 1. Hasil penelitian menunjuk-kan bahwa nilai IKA tepung suweg yang dihasil-kan dari fase dorman berbeda nyata dengan fase vegetatif. Nilai IKA fase dorman lebih tinggi dari
pada fese vegetatif. Nilai IKA sangat berkaitan dengan kandungan amilosa dan amilopektin. Tepung dengan kadar amilosa yang tinggi akan memiliki IKA yang tinggi. Hal ini disebabkan amilosa lebih mudah larut dari pada amilopektin (Widowati dkk., 1998). Sehingga dimungkinkan kandungan amilosa tepung suweg dari fase dor-man lebih banyak dari pada fase vegetatif.
Derajat kecerahan (L) menunjukkan intensi-tas kecerahan gelap terang warna tepung suweg. Derajat kecerahan tepung dinyatakan sebagai nilai L pada chromameter. Nilai ini menunjuk-kan kemampuan memantulmenunjuk-kan cahaya yang mengenai permukaan suatu bahan. Semakin tinggi nilai L maka derajat kecerahan tepung suweg semakin tinggi. Data hasil analisis disa-jikan dalam Tabel 1. Nilai L tepung suweg dari fase dorman berbeda nyata dengan fase vegetatif. Nilai L tepung suweg fase dorman lebih tinggi dari pada fase vegetatif. Hal ini menunjukkan bahwa warna tepung suweg dari fase dorman lebih cerah dibandingkan fase vegetatif. Hal ini dimungkinkan terjadi karena ukuran partikel te-pung suweg fase dorman lebih halus dibanding-kan fase vegetatif. Ukuran partikel yang semakin halus dinyatakan dengan nilai PSI yang semakin tinggi. Selain itu dimungkinkan juga karena adanya browning pada tepung suweg oleh reaksi gula reduksi dan asam amino. Tepung suweg fase vegetatif memiliki kandungan gula reduksi dan protein lebih besar dari fase dorman (Tabel 2). Umumnya konsumen lebih menyukai tepung dengan derajat kecerahan lebih tinggi. Tepung suweg yang dihasilkan memiliki derajat kecera-han yang rendah, sehingga disarankan untuk diaplikasikan kedalam produk yang umumnya berwarna gelap. Nilai derajat kecerahan tepung suweg ini lebih kecil dari tepung suweg hasil penelitian Faridah (2005) yaitu 60,6. Hal ini dimungkinkan karena suhu pengeringan yang
digunakan Faridah (2005) lebih rendah 10 °C dari pada penelitian ini dan dengan waktu pen-geringan yang lebih lama yaitu 18 jam. Beberapa peneliti lainnya menyatakan kecerahan tepung suweg dengan color reader memiliki nilai 57,7 % (Septiani dkk., 2015) dan 39 % (Richana dan Sunarti, 2004). Septiani melakukan pengeringan dengan suhu 60 °C selama 5 jam. Sedangkan Richana dan Sunarti, (2004) melakukan penger-ingan dengan suhu 50 °C selama 24 jam.
Sifat Kimia Tepung Suweg
Analisis sifat kimia tepung suweg yang di-hasilkan dari fase dorman dan vegetatif disajikan dalam Tabel 2. Nilai kadar air tepung suweg yang dihasilkan dari fase dorman berbeda nyata dengan fase vegetatif (Tabel 2). Kadar air tepung suweg fase dorman (6,54 %) lebih besar dari pada fase vegetatif (5,48 %). Nilai kadar air tersebut lebih rendah dibandingkan hasil pene-litian Richana dan Sunarti (2004) yaitu 9,4 %. Sementara nilai kadar air tepung suweg menurut peneliti lainnya 6,57 % (Septiani dkk., 2015); 9,4 % (Mukhlis, 2003) dan 4,7 % (Faridah, 2005). Kadar air menjadi salah satu parameter penting dalam menentukan mutu tepung. Hal tersebut disebabkan risiko kerusakan tepung akan menin-gkat pada kadar air yang tinggi. Nilai kadar air te-pung suweg ini hampir sama dibandingkan den-gan tepung umbi lainnya seperti tepung umbi ganyong (6,69 %) dan tepung umbi gembili (6,44 %). Akan tetapi kadar air tepung suweg ini lebih rendah dibanding dengan tepung ubikelapa yaitu 11,06 % (Richana dan Sunarti, 2004).
Kadar abu tepung suweg disajikan dalam Tabel 2. Kadar abu menunjukkan kandungan mineral yang terdapat dalam bahan (Winarno, 1997). Hasil analisis menunjukkan bahwa kadar abu tepung suweg yang dihasilkan dari fase dor-man berbeda nyata dengan fase vegetatif. Nilai
kadar abu fase dorman lebih kecil dibandingkan fase vegetatif. Kadar abu tepung suweg ini lebih tinggi dibandingkan SNI untuk produk tepung terigu dimana batas maksimum kadar abu ialah 0,7 %. Hasil yang berbeda dilaporkan Richana dan Sunarti (2004) yang menyatakan kadar abu tepung suweg 3,8 %. Sementara Septiani dkk. (2015) melaporkan kadar abu tepung suweg 3,32 % dan Faridah (2005) melaporkan kadar abu tepung suweg 4,7 %. Kandungan mineral bahan segar asal tanaman sangat dipengaruhi oleh kondisi mineral tanah tempat tumbuhnya. Apabila dibandingkan dengan tepung dari jenis umbi yang lain maka kadar abu tepung suweg masih lebih tinggi. Tepung ganyong memiliki kadar abu 2,89 %, tepung ubikelapa memiliki kadar abu 3,56 %, dan tepung gembili memiliki kadar abu 2,87 % (Richana dan Sunarti, 2004).
Kadar lemak tepung suweg disajikan dalam Tabel 2. Hasil analisis menunjukkan bahwa ka-dar lemak tepung suweg yang dihasilkan ka-dari fase dorman tidak berbeda nyata dengan fase vegeta-tif. Nilai kadar lemak berkisar 1,02 – 1,09 %. Ka-dar lemak tepung suweg ini lebih tinggi diband-ingkan hasil penelitian Faridah (2005) sebesar 0,28 %, Richana dan Sunarti (2000) sebesar 1,64 %, Septiani dkk. (2015) sebesar 0,39 %.
Tabel 2. Sifat Kimia Tepung Umbi
Parameter Fase Dorman Fase Vegetatif
Air (%) 6,54 ± 0,13 a 5,48 ± 0,39 b Abu (%) 5,13 ± 0,42 a 5,69 ± 0,19 b Lemak (%) 1,02 ± 0,13 a 1,09 ± 0,15 a Protein (%) 6,45 ± 1,09 a 7,77 ± 1,35 b Karbohidrat by difference (%) 80,85 ± 1,05 a 79,97 ± 1,57 a Gula reduksi (%) 1,33 ± 0,15 a 1,83 ± 0,38 b Pati (%) 88,7 ± 3,28 a 70,31 ± 9,41 b Keterangan: Notasi huruf yang sama menunjukkan tidak beda nyata pada α = 0.05. Data disajikan ± standar deviasi.
Kadar protein tepung suweg disajikan dalam Tabel 2. Hasil analisis menunjukkan bahwa
tepung suweg yang dihasilkan dari fase dorman berbeda nyata dengan fase vegetatif. Nilai kadar protein tepung suweg fase dorman (6,45 %) lebih rendah dibandingkan dengan fase vegetatif (7,77 %). Hal ini dimungkinkan karena ketika fase dorman semua cadangan makanan dalam umbi disimpan dalam bentuk karbohidrat, sehingga ketika ditepungkan akan menyebabkan tingginya persen karbohidrat dan rendahnya protein. Se-lain itu ketika fase vegetatif masih dimungkinkan masih banyak terdapat enzim yang merupakan protein sehingga kadar proteinnya lebih tinggi dari fase dorman. Faridah (2005) melaporkan bahwa tepung umbi suweg memiliki kadar protein 7,2 %. Sementara Richana dan Sunarti (2000) melaporkan sebesar 5,22 %. Septiani dkk. (2015) melaporkan kadar protein tepung suweg sebesar 3,91 %.
Kandungan karbohidrat tepung suweg disaji-kan dalam Tabel 2. Hasil analisis menunjukdisaji-kan bahwa tepung suweg yang dihasilkan dari fase dorman tidak berbeda nyata dengan fase vegeta-tif. Nilai kandungan karbohidrat tepung suweg berkisar 79,97 - 80,85 %. Hal ini menunjukkan bahwa tepung suweg potensial menjadi sumber karbohidrat. Kadar karbohidrat tepung suweg ini masih lebih rendah dibandingkan hasil peneli-tian Faridah (2005) sebesar 83,18 % dan Seppeneli-tiani dkk. (2015) sebesar 85,82 %. Akan tetapi masih lebih tinggi dari hasil penelitian Ardhiyanti (2008) sebesar 77,81 % dan Yadav dan Singh (2016) sebesar 73,86 %.
Kandungan pati tepung suweg disajikan dalam Tabel 2. Kadar pati menjadi salah satu parameter mutu produk tepung untuk kebu-tuhan pangan dan non pangan. Hasil analisis menunjukkan bahwa kandungan pati tepung suweg yang dihasilkan dari fase dorman berbeda nyata dengan fase vegetatif. Nilai kandungan pati tepung suweg fase dorman lebih besar
dibandingkan fase vegetatif. Hal ini disebab-kan pati digunadisebab-kan sebagai cadangan madisebab-kanan selama fase dorman dan juga sebagai sumber makanan ketika awal masa pembentukan tunas dan pertumbuhan awal tanaman (Pitojo, 2007). Kadar pati tepung suweg ini jauh lebih banyak dari kadar pati tepung suweg hasil penelitian Richana dan Sunarti (2004) yaitu 39,36 %. Begitu pula dengan kadar pati tepung umbi lain-nya seperti ganyong (40,18 %), ubi kelapa (52,25 %) dan gembili (42,16 %). Santosa dkk. (2002) melaporkan bahwa kandungan pati umbi suweg 3,6-11,4 g/100 g berat basah. Kadar pati umbi dipengaruhi umur panen umbi. Kadar pati yang telah optimum akan dikonversi secara perlahan menjadi serat (Wahid dkk, 1992).
Kandungan gula reduksi tepung suweg disaji-kan dalam Tabel 2. Hasil analisis menunjukdisaji-kan bahwa gula reduksi tepung suweg yang dihasil-kan dari fase dorman berbeda nyata dengan fase vegetatif. Kandungan gule reduksi fase vegetatif lebih tinggi dibandingkan fase dorman. Gula reduksi yang rendah pada tepung suweg fase dorman dimungkinkan berdampak terhadap derajat kecerahan tepung yang lebih tinggi dari fase vegetatif. Gula reduksi akan menyebabkan
browning non enzimatis karena bereaksi dengan asam amino dari protein selama proses pengerin-gan. Nilai ini masih lebih tinggi bila dibanding-kan dengan dibanding-kandungan gula umbi suweg hasil penelitian Srivastava dkk. (2014) sebesar 1,16 % dan juga Suja (2013) sebesar 0,78 %. Kandungan gula reduksi tepung suweg ini masih lebih ren-dah dibandingkan hasil penelitian Lukitaningsih dkk. (2012) sebesar 4,34 %, sedangkan tepung ubi jalar ungu sebesar 3,15 % (Nindyarani dkk., 2011).
Sifat Sensoris
dihasilkan dari fase dorman dan vegetatif yang meliputi uji hedonik dan uji deskriptif disajikan dalam Tabel 3.
Sifat sensoris untuk uji hedonik (kesukaan) warna tepung suweg disajikan dalam Tabel 3. Hasil analisis menunjukkan bahwa skor hedonik warna tepung suweg yang dihasilkan dari fase dorman berbeda nyata dengan fase vegetatif. Pan-elis menyatakan bahawa tepung suweg dari fase dorman lebih disukai dibandingkan dengan fase vegetatif. Hal ini dimungkinkan karena warna tepung suweg fase vegetatif cenderung lebih coklat daripada fase dorman. Selain itu juga dimungkinkan karena derajat kecerahan tepung suweg fase dorman lebih tinggi yang ditunjukkan dengan nilai L yang lebih tinggi dari fase vegeta-tif.
Sifat sensoris untuk uji hedonik (kesukaan) aroma tepung suweg disajikan dalam Tabel 3. Hasil analisis menunjukkan bahwa skor hedonik aroma tepung suweg yang dihasilkan dari fase dorman tidak berbeda nyata dengan fase vegeta-tif. Panelis menyatakan bahawa tepung suweg dari fase dorman dan fase vegetatif cenderung kearah tidak disukai. Hal ini dimungkinkan karena tepung suweg memiliki aroma khas yang cenderung kuat. Hal ini bersesuaian dengan Has-bullah (2016) yang menyatakan bahwa tepung suweg yang dihasilkan dari beberapa kabupaten di Karesidenan Surakarta memiliki aroma yang cukup kuat sehingga menurunkan skor kesukaan panelis terhadap parameter aroma.
Sifat sensoris untuk uji deskriptif warna te-pung suweg disajikan dalam Tabel 3. Hasil anali-sis menunjukkan bahwa skor deskriptif warna tepung suweg yang dihasilkan dari fase dorman berbeda nyata dengan fase vegetatif. Panelis me-nyatakan bahawa tepung suweg dari fase vegetatif memiliki warna yang lebih coklat dibandingkan fase dorman. Warna coklat pada tepung suweg
ini diduga dipengaruhi kandungan fenol dalam umbi. Hal ini diperkuat oleh Ramalingam dkk (2010) dan Suja (2013) yang menyatakan bahwa dalam umbi suweg mengandung senyawa fenol. Panja dan Adhikary (2016) membuktikan beber-apa kultivar umbi suweg mengandung total fenol tinggi yaitu 50,44 mg/100g. Fenol akan menye-babkan terjadi reaksi pencoklatan enzimatis. Enzim fenol oksidase akan bereaksi dengan oksi-gen diudara yang akan mengubah fenol menjadi hidroksi quinon yang berwarna coklat. Enzim ini akan kontak langsung dengan substratnya yaitu fenol ketika proses pengupasan dan perajangan umbi (Muchtadi dkk., 2013). Disisi lain dimung-kinkan terjadi reaksi maillard selama proses pembuatan tepung. Reaksi maillard ini terjadi karena gugus reduksi gula reduksi bereaksi den-gan gugus amin dari protein dan denden-gan adanya panas selama pengeringan maupun penepungan sehingga menghasilkan warna coklat. Hal ini ber-sesuaian dengan adanya kandungan gula reduksi dan protein dalam tepung dan umbi suweg. Beberapa peneliti juga menyatakan adanya gula reduksi dan protein dalam suweg seperti Srivas-tava dkk. (2014), Suja (2013) dan Lukitaningsih dkk. (2012). Hal ini juga bersesuaian dengan Hasbullah (2016) yang menyatakan sebagian besar tepung suweg dari Karesidenan Surakarta mempunyai warna yang coklat.
Tabel 3. Sifat Sensoris Tepung Umbi Suweg
Parameter Fase Dorman Fase Vegetatif
Hedonik warna 4,54 ± 1,21 a 2,96 ± 0,69 b Hedonik aroma 3,67 ± 1,05 a 3,12 ± 1,15 a Deskriptif warna 2,17 ± 0,48 a 3,25 ± 0,44 b Deskriptif aroma 2,79 ± 0,67 a 3,92 ± 0,65 b Keterangan: Notasi huruf yang sama menunjukkan tidak beda nyata pada α = 0.05. Data disajikan ± standar deviasi. Semakin tinggi nilai skor hedonik menunjukkan kesukaan pan-elis semakin meningkat. Semakin tinggi skor nilai warna deskriptif menunjukkan semakin coklat tua. Semakin tinggi skor nilai aroma deskriptif menunjukkan aroma yang semakin kuat.
Sifat sensoris untuk uji deskriptif aroma te-pung suweg disajikan dalam Tabel 3. Hasil anali-sis menunjukkan bahwa skor deskriptif aroma tepung suweg yang dihasilkan dari fase dorman berbeda nyata dengan ase vegetatif. Panelis me-nyatakan bahawa tepung suweg dari fase vegetatif memiliki aroma yang lebih kuat dibandingkan fase dorman. Aroma tepung suweg ini sangat berkaitan dengan banyaknya senyawa volatil yang terdapat pada tepung. Proses pengeringan diduga memberikan kontribusi dalam faktor aroma tepung. Reaksi maillard yang diinisiasi panas akan menyebabkan gula-gula reduksi bereaksi dengan asam amino yang terdapat dalam umbi (Winarno, 1997). Hasil reaksi maillard ini akan menghasilkan senyawa volatil yang berkontribusi terhadap aroma tepung suweg. Selain itu juga dimungkinkan adanya asam-asam lemak yang turut berkontribusi terhadap aroma tersebut. Lukitaningsih dkk. (2012) menyatakan bahwa dalam umbi suweg terdapat asam linoleat dan asam palmitat. Asam linoleat ini lebih banyak jumlahnya dibandingkan asam palmitat. Asam-asam lemak khususnya Asam-asam linoleat merupakan prekusor senyawa volatil melalui reaksi oksidasi. Asam-asam lemak hasil pemecahan lemak dan produk oksidasi dari asam lemak berkontribusi terhadap perkembangan off flavor bahan pangan (Shahidi, 2000).
Berdasarkan semua data penelitian yang di-dapatkan maka dapat direkomendasikan bahwa waktu panen umbi suweg yang dianjurkan untuk diolah menjadi tepung ialah ketika fase dorman. Ketika fase dorman akan dihasilkan tepung su-weg dengan rendemen yang lebih banyak, derajat kecerahan yang lebih tinggi, kadar gula reduksi yang lebih rendah, kadar pati yang lebih tinggi dan intensitas aroma yang lebih rendah diband-ingkan fase vegetatif.
SIMPULAN
Perbedaan fase dorman dan vegetatif menye-babkan perbedaan sifat fisik, kimia dan sensoris tepung suweg yang dihasilkan. Tepung suweg fase dorman memiliki keunggulan dibandingkan fase vegetatif. Hal ini tercermin dari tingginya rende-men dan nilai L, rendahnya kadar gula reduksi dan aroma khas tepung suweg fase dorman daripada fase vegetatif. Tepung suweg direkomen-dasikan untuk digunakan sebagai bahan pangan seperti biskuit maupun cookies karena warna coklat dapat ditutup dengan penambahan coklat dan juga aroma khas dapat ditutup dengan pem-berian perisa.
UCAPAN TERIMAKASIH
Terima kasih kepada Lembaga Penelitian dan Pengabdian kepada Masyarakat (LPPM) Uni-versitas PGRI Semarang yang telah membiayai penelitian ini melalui program hibah penelitian dosen pemula.
DAFTAR PUSTAKA
Adeleke, R.O. dan J.O. Odedeji. 2010. Functional Properties of Wheat and Sweet Potato Flour Blends. Pakistan Journal of Nutrition 9(6): 535-538.
Anderson RA, HF. Conway, VF. Pfeifer, EL. 1969. Griffin. Gelati -nization of corn grits by roll and extrusion cooking. J. Cereal Science 14:4-12.
AOAC. 2005. Official of Analysis of Official Analytical Chemistry. AOAC inc. Arlington. USA.36 p.
Ardhiyanti, SD. 2008. Daya Hipokolesterolemik Tepung Umbi Su-weg (Amorphophallus campanulatus) pada Tikus Percobaan (Rattus norvegicus). Skripsi. Fakultas Teknologi Pertanian IPB. Bogor.
Bejarano, PIA, NMV. Montoya, EOC. Rodriguez, GM. Carillo, RM. Escobedo, JAL. Valenzuela, JAG. Tiznado, CR. Moreno. 2007. Tempeh Flour from Chickpeas (Cicer carietinum L.) Nutrition-al and PhysicochemicNutrition-al Properties. Food Chem 10(6):106-112.
Datta G., Basu S., Das M., Sen A., Choudhury UR. 2014. Analysis
of Complete Nutritional Profile of Amorphophallus Campanu-latus Tuber Cultivated in Howrah District of West Bengal, India. Asian J Pharm Clin Res 7(3):25-29.
Elzebroek, ATG. 2008. Guide to Cultivated Plants. CABI. USA. 50 p.
pallus campanulatus B1) dan Indeks Glikemiksnya. Jurnal. Teknol. dan Industri Pangan 8(3):254-259.
Hasbullah, UHA. 2016. Sifat Sensoris dan Principal Component Analysis Tepung Suweg di Karisidenan Surakarta. Jurnal Ilmiah Teknosains 2(2):107-111.
Hasbullah, UHA., F. Nurdyansyah, B. Supriyadi, R. Umiyati, dan RMD. Ujianti. 2017. Sifat Fisik dan Kimia Tepung Umbi Suweg (Amorphophallus campamulatus BI) di Jawa Tengah. Jurnal Pangan dan Gizi 7(1):59-65.
Kasno, A. 2009. Agribisnis Tanaman Suweg. Gema Pertapa. Jakarta. 24 hal.
Lukitaningsih, E., Rumiyati, I. Puspitasari, dan M. Christiana. 2012. Analysis of Macronutriencontent, Glycemic Index and Calcium Oxalate Elimination In Amorphophallus campanulatus
(Roxb.). Jurnal Natural 12(2):1-8.
Muchtadi, TR., Sugiyono, dan F. Ayustaningwarno. 2013. Ilmu Pengetahuan Bahan Pangan. Alfabeta. Bandung. 44 hal. Mukhis, F. 2003. Karakterisasi Sifat Fisikokimia Tepung dan Pati
Umbi Ganyong (Canna edulis Kerr.) dan Suweg ( Amorpho-phallus campanulatus Bl.) serta Sifat Penerimaan Amilase terhadap Pati. Skripsi. FakultasTeknologi Pertanian IPB. Bogor.
Nindyarani, AK., Sutardi, Suparmo. 2011. Karakteristik Kimia, Fisik dan Inderawi Tepung Ubi Jalar Ungu (Ipomoea batatas
Poiret) dan Produk Olahannya. Agritech 31(4):273-280. Panja, P. dan S. Adhikary. 2016. Diversity of Physical and
Bio-Chemical Properties in Some Elephant Foot Yam ( Amorpho-phallus Paeoniifolius) Cultivars at Harvest Fresh Stage. The Bioscan 11(2): 1193-1198.
Pitojo, S. 2007. Suweg. Penerbit Kanisius. Yogyakarta. 56 hal. Purnomo, EP., AN. Ginanjar, F. Kusnandar dan C. Andriani. 2015.
Karakteristik Sifat Fisikokimia Tepung Kacang Hitam dan Aplikasinya pada Brownies Panggang. Jurnal Mutu Pangan
2(1):26-33.
Ramalingam, R., KH. Bindu, BB. Madhavi, AR. Nath, D. Banji. 2010. Phyto Chemical and Anthelmintic Evaluation of Corm of Amorphophallus Campanulatus. International Journal of Pharma and Bio Sciences 6(2):1-9.
Richana, N dan T.C Sunarti, 2004. Karakterisasi Sifat Fisikokimia Tepung Umbi dan Tepung Pati dari Umbi Ganyong, Suweg, Ubi Kelapa, dan Gembili J. Pascapanen 1(1):29-37.
Santosa, E., N. Sugiyama, MA. Chozin, AP. Lontoh, S. Sudiatso, S. Kawabata, S. Hikosaka, Sutoro, A. Hidayat. 2002. Morpho-logical and Nutritional Characterization of Elephant Foot Yam in Indonesia. Japanese Journal of Tropical Agriculture
46(4):265-271.
Septiani, D., Y. Hendrawan dan R. Yulianingsih. 2005. Uji Kara-kteristik Fisik, Kimia Dan Organoleptik Pembuatan Tepung Umbi Suweg (Amorphophallus campanulatus B) Sebagai Bahan Pangan Alternatif. Jurnal Bioproses Komoditas Tropis
3(1): 11-18.
Shahidi, F. 2000. Lipids in Flavor Formation in Flavor Chemistry.
ACS Symposium Series. 756 (3): 24–43. doi: 10.1021/bk-2000-0756.ch003.
dan AKS. Rawat. 2014. Phytochemical and Nutritional Evalu-ation of Amorphophallus campanulatus (Roxb.) Blume Corm. J Nutr Food Sci 4(3): 274. doi: 10.4172/2155-9600.1000274. Sudarmadji, S., B. Haryono dan Suhardi. 2010. Prosedur Analisa
untuk Bahan Makanan dan Pertanian. Liberty. Yogyakarta. 160 hal.
Suja, G. 2013. Comparison of Tuber Yield, Nutritional Quality and Soil Health Under Organic Versus Conventional Production in Tuberous Vegetables. Indian Journal of Agricultural Sciences
83(11): 1153–1158.
USFDA. 2014. Elemental Analysis Manual (EAM) for Food and Related Products. Diakses 10 Februari 2017. http://www. fda.gov/Food/FoodScienceResearch/LaboratoryMethods/ ucm2006954.htm.
Utami, PU. 2009. Peningkatan Mutu Pati Ganyong (Canna edulis
Ker) melalui Perbaikan Proses Produksi. Skripsi. Fakultas Teknologi Pertanian IPB. Bogor.
Wahid AS, N Richana dan Djamaluddin C. 1992. Pengaruh Umur Panen dan Pemupukan Terhadap Hasil dan Kualitas Ubi Kayu Varietas Gading dan Adira-4. Titian Agronomi. Bul. Pen. Agr. 1: 11 – 15.
WHO. 2003. Unit weight edible portion. Diakses 10 Februari 2017. http://www.who.int/foodsafety/chem/acute_haz-ard_db3.pdf.
Widowati, S., AB. Ahza dan MEW. Umaryadi. 1998. Evaluasi sifat
fisiko-kimia tepung tape ubi kayu. Prosiding Seminar Nasi-onal Teknologi Pangan dan Gizi. PATPI. 32-41.
Winarno, F.G. 1997. Kimia Pangan dan Gizi. PT Gramedia Pustaka Utama. Jakarta. 253 hal.
Yadav, A. dan S. Singh. 2016. Physicochemical Properties of Selected Varieties of Elephant Foot Yam (Amorphophallus paeoniifolius).
INTRODUCTION
Nutrient is one of the factors that influence plants growth and development. Potassium is one of important soil nutrients. Based on the crop needs nutrients, potassium is third element that is important after nitrogen and phospho-rus. However, the cessation of chemical fertilizer subsidy by the government causes the increase of fertilizer price. Due to the high price of potas-sium fertilizer, farmers are forced to reduce, even not apply potassium fertilizer at all It leads to the
efforts to increase crop production. Alternative fertilizer that can be substitution for chemical fertilizer with low prices and easy to be obtained is the crop residues (waste).
Jatropha is one of oil producing plants. It gained the government and experts attention in supporting energy policies through the develop-ment of fuel. The obstacles in developing jatro-pha include the low productivity, so that when farmers only use the oil, the income from
jatro-Application of Jatropha Rind Compost as K Source in The
Sweet Corn (
Zea mays saccharata
Sturt.) Cultivation
DOI: 10.18196/pt.2017.067.79-87
Bagus Arrasyid*, Gunawan Budiyanto, Titiek Widyastuti
Department of Agrotechnology, Faculty of Agriculture, Universitas Muhammadiyah Yogyakarta, Jl. Lingkar Selatan, Kasihan, Bantul, Yogyakarta 55183, Indonesia Telp. 0274 387656,
*Corresponding author, email: [email protected]
ABSTRACT
Potassium is one of important soil nutrients. The content of potassium in the jatropha rind compost is quite high reaching 11.36%. The high content of
potassium in the jatropha rind has potential to increase the productivity and fulfill the needs of soil nutrients in the cultivation process. The research aims to study the influence of jatropha rind compost as substitute KCl fertilizer on sweet corn (Zea mays saccharata Sturt.), and get the proper rate of the
compost for increasing the growth and yield of sweet corn. This research was conducted using an experimental method with a single factor that was arranged in a completely randomized design. Treatments were combination of jatropha rind compost and KCl rate, consisting of four levels, 250 kg KCl/ hectare + 0 KJP kg/hectare, 125 kg KCl/hectare + KJP 273.89 kg/hectare, 62.5 kg KCl/hectare + KJP 410.84 kg/hectare, 0 kg KCl/hectare + KJP 547.79 kg/ hectare. Each treatment was replicated 3 times so that there were 12 experimental units and each unit consisting of three plants trial so that there were 36 plants. Each plot of the experimental unit was fertilized using manure 20 ton/hectare, urea 400 kg/hectare which was applied 2 times and SP-36 300 kg/hectare. Results indicate that the treatment of mix dose of compost rind jatropha and KCl does not affect significantly on growth and yield of sweet corn. Sweet corn plants fertilized with jatropha rind compost with the dose of 547.79 kg/ha had the same growth and yield those of 250 kg/ha KCl. The study concluded that jatropha rind compost can replace KCl fertilizer.
Keywords: Jatropha rind, Compost, Potassium, Sweet corn, Zea mays saccharata Sturt.
ABSTRAK
Kalium merupakan salah satu unsur hara yang sangat penting bagi tanaman. Kandungan kalium pada kompos kulit buah jarak pagar cukup tinggi yaitu sebesar 11,36 %. Tingginya kandungan kalium pada kulit buah jarak pagar sangat berpotensi untuk meningkatkan produktivitas tanah dan dapat memenuhi kebutuhan unsur hara pada proses budidaya. Penelitian ini bertujuan untuk mengkaji pengaruh kompos kulit buah jarak pagar sebagai penganti pupuk K terhadap tanaman jagung manis dan mendapatkan dosis kompos kulit buah jarak pagar yang tepat dalam meningkatkan pertumbuhan dan hasil tanaman jagung manis. Penelitian dilaksanakan menggunakan metode eksperimental dengan faktor tunggal yang disusun dalam rancangan acak lengkap. Perlakuan yang diujikan yaitu dosis kompos kulit buah jarak pagar (KJP) yang terdiri dari 4 aras yaitu, 250 kg KCl/hektar + 0 kg KJP/hektar, 125 kg KCl/hektar + 273,89 kg KJP/hektar, 62,5 kg KCl/hektar + 410,84 kg KJP/hektar, 0 kg KCl/hektar + 547,79 kg KJP/hektar. Setiap perlakuan diulang 3 kali sehingga terdapat 12 unit percobaan, setiap unit percobaan terdiri dari 3 tanaman sehingga terdapat 36 tanaman. Semua perlakuan masih diberikan pupuk kandang dengan dosis 20 ton/hektar, Urea 400 kg/hektar diberikan 2 kali, SP-36 300 kg/hektar. Hasil penelitian ini menunjukkan bahwa perlakuan dosis campuran kompos kulit buah jarak dan KCl tidak memberikan pengaruh yang berbeda terhadap semua parameter pertumbuhan dan hasil tanaman jagung manis. Penelitian ini dapat disimpulkan bahwa kompos kulit jarak pagar dapat menggantikan pupuk KCL.
pha is very limited. In fact, the yield of jatropha biomass is relatively abundant. K elements in each material varies depending on the origin of the material. The content of potassium in the jatropha rind compost is quite high at 11.36% (Muhammad et al., 2009). The high content of potassium in jatropha rind has potential to increase the productivity and fulfill the needs of soil nutrients in the cultivation process.
Corn is a food or feed crops that are quite important for human and animal. Corn has a crude fiber content of nutrients and adequate as a staple food instead of rice. Besides as staple food, corn also can be used as feedstock. Based on the increasing level of consumption per capita per year and the increasing of the population in Indonesia, the demand for corn in Indonesia continues to rise. According to the data from the Central Statistics Agency (BPS), Indone-sia, the corn production in 2012 was originally 19,387,022 tons and decreased to 19,032,667 tons in 2013 and 2014. Therefore, it is neces-sary to increase the corn production so that the demand for corn could be fulfilled.
It is recommended to use organic fertilizer (manure or compost) as much as 20 tons/hectare in corn crop cultivation. As for inorganic fertil-izers, it is prompted to apply urea 400 kg/hect-are, SP-36 300 kg/hectkg/hect-are, KCI 250 kg/hectare. While the recommended basic fertilizer is 20 tons/hectare of organic fertilizer before planting, 200 kg/hectare of urea, 300 kg/hectare SP-36, and 250 kg/hectare KCl which were applied two weeks after planting. Supplementary fertilizer needs to be applied 3-4 weeks after planting in the form of urea 200 kg/hectare (Bilman et al., 2002). Since the requirements of KCl fertilizer in the cultivation of corn is high, jatropha rind compost with K has high potential to reduce the use of potassium fertilizers. It can also help
farm-ers reduce the production costs. Compost also improve physical, chemical and biological proper-ties of soil, does not lower the pH, and can make soil crumbly.
The research aims to study whether jatropha rind compost can reduce or substitute the role of KCl fertilizer in sweet corn (Zea mays saccharata
Sturt.) and get a proper rate of the compost in increasing the growth and yield of sweet corn.
MATERIALS AND METHODS
This research was conducted at the Soil Research Laboratory and Experimental Farm of Faculty of Agriculture, Universitas Muhammadi-yah Yogyakarta, Tamantirto Village, Kasihan, Bantul, Yogyakarta from October 2015 to March 2016. The experiment was arranged with single factor in a completely randomized design. The treatment tested was the various doses of jatro-pha rind compost (KJP) consisting of four levels: 250 kg KCl/hectare + 0 KJP kg/hectare; 125 kg KCl/hectare + KJP 273.89 kg / ha; 62.5 kg KCl/ hectare + KJP 410.84 kg/hectare; 0 kg KCl/hect-are + KJP 547.79 kg/hectKCl/hect-are. Each treatment was replicated 3 times so there were 12 experimental units, each unit consisting of three plants so that there were 36 plants. All treatment were supple-mented with manure (20 tons/hectare), Urea (400 kg/hectare which was given 2 times), and SP-36 (300 kg/hectare).
This research was conducted through the 10 stages: making jatropha rind into little pieces and preparing activator, composting jatropha rind, in-cubating compost, observing compost, building shade, testing germination, preparing planting medium, planting and applying compost, mainte-nance (watering, thinning and replanting, fertil-izing, shading, and controlling pest), harvesting and analyzing data.
pH using a pH meter, levels of C-Organic us-ing the method of Walkley and Black, levels of N-total with Kejdahl method. Sweet Corn crops analysis included measurement of plant height (cm), number of leaves, stem diameter (cm), crop fresh weight (gram), crop dry weight (gram), roots fresh weights (gram), roots dry weight (gram), the fresh weight of ear with husk (gram), the fresh weight of ear without husk (g) and ear diameter (cm).
The data analyzed using ANOVA at 5% error level, and then subjected to Duncan’s multiple range test with 5% error level.
RESULTS AND DISCUSSIONS Jatropha Rind Compost
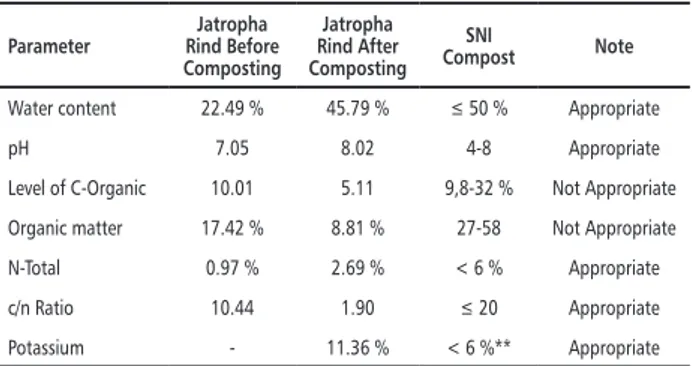
Water content is the percentage of water content of a material that can be expressed based on the weight of fresh or dry weight (Budi et al., 2015). Water content influences the activity of microorganisms in decomposing organic matter. If the moisture content is below 30%, the biolog-ical reactions will run slower and reduce because of the limited available habitat. The increased moisture in jatropha rind compost shows that the compost can improve soil structure when applied, especially water storage capacity needed by crops in the process of absorption of nutrients so that the process of plant growth and develop-ment goes well. The analysis results of compost in showed that water content of the compost is in conformity with SNI compost (Table 1). The data were resulted from compost analysis con-ducted in the laboratory same as Muhammad et. al. (2009) reported that jatropha compost had potassium content of 11.36% (Table 1).
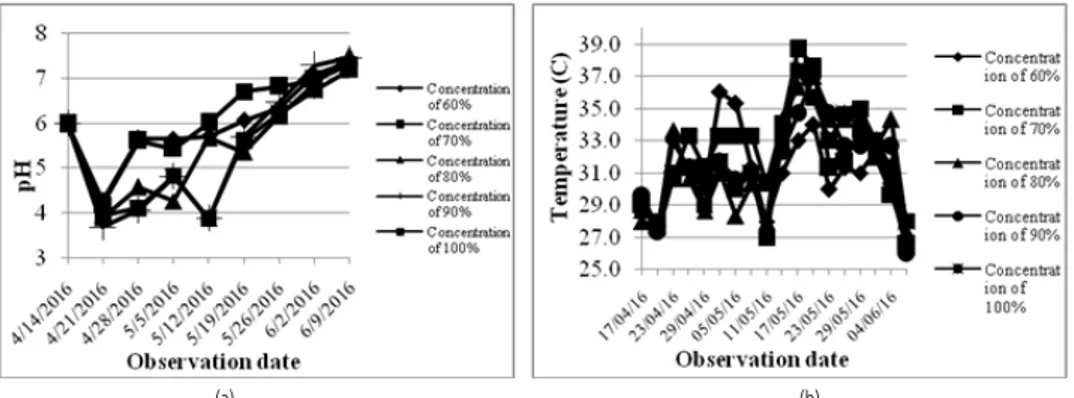
The level of acidity or pH is one of the criti-cal factors for the growth of microorganisms involved in the composting process. Compost analysis serves as an indicator of the
decomposi-tion process of the compost. On the first week, jatropha rind had neutral pH because the mate-rial was still fresh and had not been decomposed by microbes. Start from the first week to the third week the pH increased which was caused by the addition of lime at the start of composting. Then in the fourth week and fifth week there was a decrease in pH because there was an over-haul process of organic materials into organic acids by microbes, causing the pH to decrease. The same thing occurred on the sixth week and seventh week in which the pH increased because the decomposition activity was reduced, nitrogen was decreased and most of the microorganisms were dead. According to Ruskandi (2006) in Fahruddin and Abdullah (2010), pH which is too alkaline will release unpleasant ammonia smell. Too much alkaline or acidic odors will invite flies. In this process, the expected biological activity was reduced, nitrogen was reduced and most of the microorganisms were dead.
Table 1. Analysis Results of Jatropha Rind Compost
Parameter Rind Before Jatropha Composting Jatropha Rind After Composting SNI Compost Note
Water content 22.49 % 45.79 % ≤ 50 % Appropriate pH 7.05 8.02 4-8 Appropriate Level of C-Organic 10.01 5.11 9,8-32 % Not Appropriate Organic matter 17.42 % 8.81 % 27-58 Not Appropriate N-Total 0.97 % 2.69 % < 6 % Appropriate c/n Ratio 10.44 1.90 ≤ 20 Appropriate Potassium - 11.36 % < 6 %** Appropriate Note: **) Certain material substances derived from organic matter are allowed to contain levels of P2O5 and K2O > 6% (as evidenced by the results from laboratory).
On the ninth week the pH became neutral, because the organic acids produced in the previ-ous phase was consumed by the microorganisms, thus pH became neutral until the compost was mature. The final pH of jatropha rind compost had become neutral, and it was in accordance with the SNI stating that the pH range for
organ-ic fertilizer was 6-8, so that the jatropha compost was ready or safe for use.
Organic matter contained in the compost which is used by crops as nutrients for growth will improve soil structure. According to Mirwan (2015) C-Organic is an indicator of the occur-rence of decomposition process in composting and compost maturity. In the process of decom-position, the carbon is used as an energy source for preparing cellular material of microbial cells by releasing CO2 and other substances that evaporate. The addition of an activator encour-ages the decomposition process organic matter to run fast causing a decrease in the carbon con-tent. The results of the analysis of the content of C-organic matter and organic jatropha compost were not in accordance with SNI presented in Table 1.
Total nitrogen content was related to levels of carbon compost. Both of these contents will determine the levels of C / N ratio of compost. According to Yuli et. al. (2008), total N elements of the compost obtained from the composting of organic matter degraded by microorganisms degrading compost substance. Total N of jatro-pha rind compost increased the levels of N from 0.97% to 2.69%. The content of N total was in accordance with the SNI for compost.
The principle of composting is to reduce the ratio of C/N of organic matter to the same ratio C/N of soil (<20) (Dewi and Tresnowati, 2012). The speed of reduction in C/N ratio is highly de-pendent on the content of C and N matter to be composted. The analysis results of C/N ratio of Jatropha rind compost showed a decrease from 10.44 to 1.90. The decrease of the carbon (C) elements was because the organic carbon com-pounds were used as a source of energy for the organism and then the carbon was lost as CO2. C/N ratio of the Jatropha compost used in this
research was in accordance with SNI for compost (Table 1).
The result showed that the proportion of the rind of jatropha fruits is 29 - 32%, while that of beans is 71%, 36.5 to 44.9% for eggshell 58.0 to 65.7% for kernel (Martinez et al., 2006). The content of K substance in every material depends on the origin of the material. Cow manure shows the K content of 0.10%, while sheep and goats manure has higher content reaching 0.45% and 0.40%, respectively. Based on the research results of Muhammad et al (2009), the K content of jatropha rind was 11.36%, while according to the research results of Suwarno (2011), the potas-sium content in the jatropha rind compost was 5.89 to 11.36%.
High potassium substance in jatropha rind compost was because the compost material used contained fiber and high lignin. Besides, the content of potassium was abundant in stems and fruits on a plant. This is in accordance with Afandie and Nasih (2002) who states that the functions of potassium is to the develop cells and regulate the osmotic pressure. Parts of plants which are in desperate need of potassium during the growth process are the stem and fruit, thus content of potassium in jatropha fruit was higher compared to other organic matter.
Vegetative Growth of Sweet Corn Crop
Analysis of variance performed 8 weeks after planting showed that the substitution of KCl us-ing jatropha rind compost does not give different effects on the plant height. This showed that the potassium substance in jatropha rind compost also stimulated the development of root. Since root is the part of plant that is used to absorb nutrients, with the formation of a good root, then the function of the roots will be optimal in absorbing the nutrients provided. With the
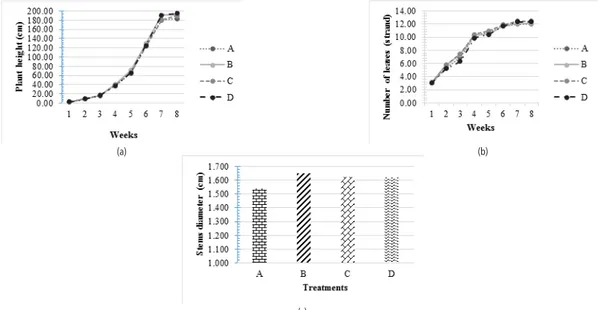
improvements of the roots function, the growth process will be better especially the plant height. The average plant height of sweet corn crops every week are presented in Figure 1a.
Figure 1a shows that the effects of the com-post doses on the plant height are relatively the same, but in the beginning of the 7th week,
application of jatropha rind compost especially at doses KJP 547.79 kg/hectare showed bet-ter plant height. In addition to potassium, the jatropha rind compost is applied also has a value of C/N ratio < 20 leading to the release of N from organic matter into the soil. Hamoda et. al. (1998) revealed that the value of C/N ratio of 25 - 35 was considered to be within the limits of feasibility. Responses to jatropha compost doses on plant height showed that during vegetative growth, the compost provided the important nutrient for plant growth.
The efficient use of jatropha rind compost that are slow release tends to be able to sup-ply the needs of nutrients, especially K for the growth of sweet corn crops and substitute inor-ganic potash fertilizer derived from KCl and ZK commonly used by farmers in the cultivation of
sweet corn.
Table 2. Plant Height, Stem Diameter and Number of Leaves of Sweet Corn
Treatments Height Plant (cm) Number of Leaves Stem Diameter (cm) A = 250 kg KCl/hectare + 0 kg KJP/hectare 183,23 12,00 1,542 B = 125 kg KCl/hectare + 273,89 kg KJP/hectare 192,18 12,11 1,650 C = 62,5 kg KCl/hectare + 410,84 kg KJP/hectare 189,56 12,44 1,622 D = 0 kg KCl/hectare + 547,79 kg KJP/hectare 195,48 12,33 1,620
Note: The numbers in the table indicate no significant difference based on the analysis of variance of at 5%.
Analysis of variance showed that the substitu-tion of KCl using Jatropha rind compost does not give different effects on the number of leaves of sweet corn plants. The number of leaves increased with the increasing of plant height and the rate of leaf formation increased with the increasing age of the crops. Figure 1b shows that the number of leaves increased from the 1st week
to the 7th week and stopped increasing on the 8th.
This is because sweet corn crop is classified as de-terminate plants where the vegetative period will be halted or stagnant when the plant has entered a period of generative growth, usually marked by the appearance of flowers. Based on table 2, it
(a) (b)
(c)
Figure 1. Sweet corn plant height (a), Sweet corn plant number of leaves (b), and Sweet corn plant stem diameter (c)
Note : A = 250 kg KCl/hectare + 0 kg KJP/hectare B = 125 kg KCl/hectare + 273.89 kg KJP/hectare C = 62.5 kg KCl/hectare + 410.84 kg KJP/hectare D = 0 kg KCl/hectare + 547.79 kg KJP/hectare
is better to use jatropha rind compost on sweet corn cultivation because the requirement for potassium which is usually fulfilled by inorganic fertilizer that is KCl and ZK has been able to be met by jatropha rind compost.
Analysis of variance showed that the substitu-tion of KCl using Jatropha rind compost does not give different effects on the stem diameter. This is because the doses of jatropha rind com-post containing potassium highly influenced the development of stem diameter. Figure 1c shows that the effects of the jatropha rind compost doses on the stem diameter are relatively the same. Various doses of compost applied to the plants showed that potassium in the compost and inorganic potassium were utilized optimally by the corn plant. Organic matter causes the effi-ciency of nutrients absorption by plants. Besides, potassium played important roles in the harden-ing of straw and parts of woody plants (Mul Mu-lyani, 2002). The addition of organic matter in the form of Jatropha rind compost into the soil aimed to add macro and micro nutrients needed by plants, so that fertilization with inorganic fertilizer commonly done by farmers may be reduced in quantity because some requirements are met by organic material in sufficient quantity. Generative Growth of Sweet Corn Crop
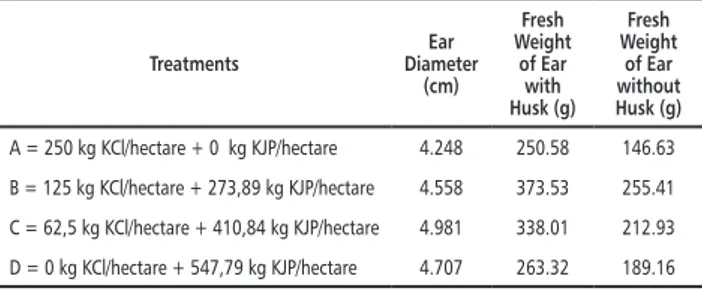
Analysis of variance showed that the substitu-tion of KCl using jatropha rind compost does not give different effects on the diameter of ear (Table 3). This indicates that the organic mat-ter provided nutrients for plants. Direct role of organic matter such as jatropha rind compost can provide nutrients for crops. Afandie and Na-sih (2002) explained that Potassium (K) play an important role in the formation of carbohydrates and enzyme activity. Besides, K substance also increased the size and weight of the grains.
Potas-sium nutrient deficiencies in plants will lead to the slump production, although the symptoms are often not shown. Potassium deficiency reduced carbohydrate content and sweetness of fruit.
The developed ears were affected by the amount of cell division that occurs in the ear itself. Nutrients in jatropha rind compost includ-ing potassium and other nutrients will meet the needs of the cell for the cell division process. The same results were observed on all doses given. Thus, it is better to use jatropha rind compost with the dose of 547.79 kg/hectare, because the needs for potassium during the vegetative and generative phase have been fulfilled with the dose.
Table 3. Ear Diameter, Fresh Weight of Ear with Husk, and Fresh Weight of Ear without Husk
Treatments Diameter Ear (cm) Fresh Weight of Ear with Husk (g) Fresh Weight of Ear without Husk (g) A = 250 kg KCl/hectare + 0 kg KJP/hectare 4.248 250.58 146.63 B = 125 kg KCl/hectare + 273,89 kg KJP/hectare 4.558 373.53 255.41 C = 62,5 kg KCl/hectare + 410,84 kg KJP/hectare 4.981 338.01 212.93 D = 0 kg KCl/hectare + 547,79 kg KJP/hectare 4.707 263.32 189.16 Note: The numbers in the table indicate no significant difference based on the analysis of variance of at 5%.
Analysis of variance showed that the substitu-tion of KCl using jatropha rind compost does not give different effects on the fresh weight of ear with husk (Figure 2a, Table 3). This is be-cause jatropha rind compost is capable of creat-ing optimum growcreat-ing environment for plants, especially in the provision of water and nutrients needed by the plants, especially elements of K functioning in the formation of ear and grain. Therefore, the use of inorganic KCl fertilizer used by farmers can be substituted by jatropha rind compost. Potassium given by the nutrients caused the accumulation of carbohydrates and
increased starch in the ears. Figure 2b shows that the effects of the doses of jatropha rind compost on the fresh weight of ear with husk are relatively the same, but at the dose of 125 kg KCl/hectare + KJP 273.89 kg/hectare produced the potential yield of ears with husk that was in accordance with Gendis variety description
Analysis of variance showed that the substitu-tion of KCl using jatropha rind compost does not give different effects on the fresh weight of ear without husk (Table 3). Figure 2c shows that the effects of the doses of jatropha rind compost on the fresh weight of ear without husk are rela-tively the same, but at the dose of 125 kg KCl/ hectare + KJP 273.89 kg/hectare produced the potential yield of ears without husk approaching the yield of ears without husk of Gendis variety. According to Adri and Veronica (2009), potas-sium (K) fertilizer including nitrogen (N) and phosphorus (P) is balanced in sweet corn plants to make better plant growth and hold of lodging. In addition, the efficiency of potassium fertilizer is also noteworthy. The use of inorganic potas-sium (KCl and ZK) can be substituted by using
jatropha rind compost to make better chemical structure and biology of soil.
Growth Accumulation of Sweet Corn Crop
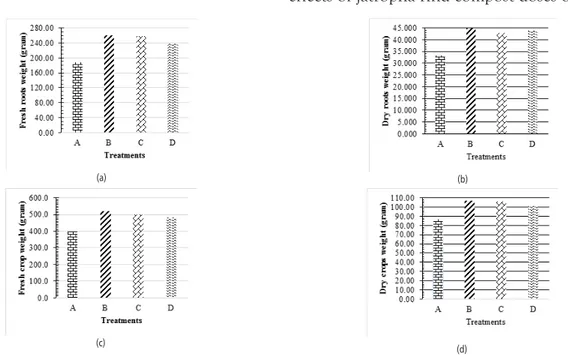
Analysis of variance showed that the substitu-tion of KCl using jatropha rind compost does not give different effects on the fresh weight of the roots of sweet corn crop (Table 4). This indicated that the fresh weight of the roots was associated with the higher ability of roots to absorb water and nutrients. The amount of water absorption and nutrients uptake, especially potassium, led to the development of the ears. Figure 3a shows that the effects of the doses of jatropha rind compost on the roots fresh weight are relatively same. According to Gardner et al (1991), the absorption of water and minerals primarily occurs through the root tip and root hairs. Roots fresh weight show the influence that is consistent with of the fresh weight of ears with husk and without husk. The higher weight of fresh root caused nutrients absorption, especially potassium, become s more optimal so that the size and weight of the ears were increased.
(a) (b)
(c)
Figure 2. Diameter of Ear (a), Fresh Weight of Ear with Husk (b), and Fresh Weight of Ear without Husk (c)
Note : A = 250 kg KCl/hectare + 0 kg KJP/hectare B = 125 kg KCl/hectare + 273.89 kg KJP/hectare C = 62.5 kg KCl/hectare + 410.84 kg KJP/hectare D = 0 kg KCl/hectare + 547.79 kg KJP/hectare
The availability of water in the soil will be able to maximize the crop growth and increase the crop weight, especially the roots. Figure 3b shows that the effects of the doses jatropha rind compost on the roots dry weight of sweet corn crops are relatively the same. Water absorbed by the roots was translocated throughout the plant organs (Handoyo, 2010). Analysis of variance showed that the doses of jatropha rind compost does not give different effects on the roots dry weight of sweet corn crops. This shows that the roots dry weight was associated with to the ability of roots to absorb more water and nutrients. The amount of absorption of water and nutrients, es-pecially potassium, led to the formation of ears.
Analysis of variance showed that the substitu-tion of KCl using Jatropha rind compost does not give different effects on the fresh weight of the crops (Figure 3c). The same things happened to the parameters of stem diameter and fresh weight of roots which showed relatively similar response. The yield synthesized and stored in the photosynthesis process can be determined by knowing the fresh weight of the crops. One of
the conditions for photosynthesis that is good for plants is sufficient water for the plants absorbed through the roots. Sunaryo (2009) explained that the fresh weight of a crops canopy depends on the water contained in the plant organs such as stems, leaves and roots, so that the amount of water content can increase the fresh weight of the crops canopy.
Table 4. Fresh and Dry Weight of Crops and Roots
Treatments Roots Fresh Weight (g) Roots Dry Weight (g) Crop Fresh Weight (g) Crop Dry Weight (g) A = 250 kg KCl/hectare + 0 kg KJP/hectare 4.248 250.58 146.63 87,09 B = 125 kg KCl/hectare + 273,89 kg KJP/hectare 4.558 373.53 255.41 107,16 C = 62,5 kg KCl/hectare + 410,84 kg KJP/hectare 4.981 338.01 212.93 105,89 D = 0 kg KCl/hectare + 547,79 kg KJP/hectare 4.707 263.32 189.16 100,77
Note: The numbers in the table indicate no significant difference based on the analysis of variance of at 5%.
Analysis of variance showed that the substitu-tion of KCl using Jatropha rind compost does not give different effects on the dry weight of the crops (Table 4). Figure 3d shows that the effects of jatropha rind compost doses on the dry
(a) (b)
(c) (d)
Figure 3. Sweet corn Fresh roots weight (a), Sweet corn Dry roots weight (b), Sweet corn Fresh crops weight (c), and Sweet corn Dry crops weight (d)
Note : A = 250 kg KCl/hectare + 0 kg KJP/hectare B = 125 kg KCl/hectare + 273.89 kg KJP/hectare C = 62.5 kg KCl/hectare + 410.84 kg KJP/hectare D = 0 kg KCl/hectare + 547.79 kg KJP/hectare