THE EFFECT OF THE TAX PLANNING TO FIRM
VALUE WITH MODERATING BOARD DIVERSITY
Tax Planning , Firm Value and Board Diversity
NANIK LESTARI. 4/10/2014
ABSTRACT
The purpose of this research is to analyze the impact activities tax planning to firm value with board diversity as moderating variable. The research was conducted for non-banking and financial firms in Indonesia Stock Exchange for 2010 to 2011. The results of this study are: Firstly, we found evidence of positive relationship between tax planning and firm value. Secondly, we found evidence that board diversity (AGE and BSTUDY of member director) could increase the positive influence of tax planning into firm value, except for MINORITY could decrease the positive influence of tax planning into firm value. Finally, the results of the sensitivity test with the full model and the full sample suggested that tax planning had robust positive effect in increasing firm value, then the moderating influence of board diversity (BSTUDY and MINORITY) on the relationship between tax planning and firm value was consistent but other variables of board diversity (AGE) are not consistent.
THE EFFECT OF THE TAX PLANNING TO FIRM VALUE WITH MODERATING BOARD DIVERSITY
NANIK LESTARI
Business Management – Accounting Department-Batam State Polytechnic Parkway Street Batam Center, Batam, Indonesia
Email: [email protected] or [email protected]
INTRODUCTIONS
This study is committed to investigate the relationship between tax planning and firm
value with board diversity as moderating variable on Indonesia companies’ context. Wahab
& Holland (2012) examines relationship between shareholders valuation of corporate income
and tax planning with corporate governance (CG) as moderating variable in U.K contexts.
The authors documents are: first, they found evidence of negative significant relationship
between the level of tax planning and firm value which is robust to controlling for corporate
governance. Second, they used the two moderating variables corporate governance were
Institutional ownership (IOWN) and Non-Executive Ownership (NED) to examine whether
the relationship between firm value and tax planning. They found no significantly CG as
moderating the relationship between firm value and tax planning.
Ernest & Young (2009) stated that a group with heterognenity (diversity) is more
likely to have better performance rather than a group with the homogeneous, although those
more profecient in its. In line these studies,that the group is diverse when managed properly
will result more likely innovative business decisions rather than homogeneous groups
(Catalyst, 2005). Another stream of research indicates that board diversity from mechanism
corporate governance. Empirical evidence that many researchers have examined boards
Darmadi, 2010; Kusumastuti, Supatmi, & Satra, 2007) and tax planning (Aliani & Zarai,
2012a).
Carter, Simkins, & Simpson (2003) that examined the relationship board diversity
between firm values for Fortune 1000 firms in context of US. They found significant positive
relationship between the fraction of women and minorities on the board (as proxy from board
diversity) and firm value, thus result consistency with Darmadi (2010), Kusumastuti,
Supatmi, & Satra (2007) in context of Indonesia firms. The empirical studies about board
diversity in the context of tax planning first time were done Aliani & Zarai (2012a). Aliani &
Zarai (2012a) examined the effect of demographic gender diversity on corporate tax planning
in American firms of context. They found that gender diversity on the board was not
significant and did not affect the tax planning in context of American firms. In the contrast in
Tunisia firms context, the authors documented diversity on the board of directors
significantly positive influence tax planning (Aliani & Zarai, 2012b).
Based on the previous studies Wahab & Holland (2012), Aliani & Zarai2 (2012a,
2012b), Carter, Simkins, & Simpson (2003), Darmadi (2010), Kusumastuti, Supatmi, & Satra
(2007) have not been reseacrhed yet past study used board diversity as moderating variable
on the relationship between tax planning and firm value. Thus, the current study aims to fill
gap research by focusing on boad diversity from corporate governance mechanism as
moderating on the relationship between tax planning and firm value in Indonesia firm of
context. We used three charactestic of the board directors members as measured board
diversity are Age, Minority (Ethnics Chiense/Tionghoa), Background education/study
(BSTUDY). We also use method applied by Wahab & Holland (2012) for measurements firm
value and tax planning variables.
This study has fourth contributes. Firstly, the extant literature that behaviors tax
mechanism literature by shown the potential moderating impact of the board diversity in the
association between tax planning to firm value, which strategic tax decision related to
minimum tax burdens. Thirdly, for our knowledge, we investigate relationship between tax
planning and firm value with board diversity as moderating variable, which have not been
reseacrhed yet in the past study. Prior researches Aliani & Zarai2 (2012a, 2012b), Carter,
Simkins, & Simpson (2003), Kusumastuti, Supatmi, & Satra (2007), Darmadi (2010) only
examined direct relationship between board diversity with firm performance or tax planning.
Board diversity is interesting which characteristic people with multi ethnic, religious, culture.
Finally, we alternative measurement board diversity with new perspectives, which board
diversity are measured from board director (board of management), while Indonesia is
corporate law adopts two tiers board structures. According to law, corporate shall have two
boards in their organizational structures, namely “dewan komisaris” (Board of
Commissioners/BOC) and “dewan direksi” (Board of Management/BOM). Members of BOC
and BOM are elected by shareholders in the shareholders general meeting ((Darmadi, 2010).
The earlier studies diversity view point from characteristic BOM as proxy board diversity
such Darmadi (2010), Kusumastuti, Supatmi, & Satra (2007). This study is measured board
diversity from BOM caused tax planning related operational activities decision making
strategies of BOM which to minimum tax burdens.
Our study used panel balance data of 442 firms listed on the Indonesia Stock
Exchange (IDX) from 2010 to 2011. The statistical results provided from this study are:
firstly, we found evidence of positive relationship between tax planning and firm value.
Secondly, we found evidence that board diversity (AGE and BSTUDY of member director)
could increase the positive influence of tax planning into firm value, but for MINORITY
could decrease the positive influence of tax planning into firm value. Finally, the results of
robust positive effect in increasing firm value, then the moderating influence of board
diversity (BSTUDY and MINORITY) on the relationship between tax planning and firm
value was consistent but other variables of board diversity (AGE) are not consistent.
The remainder of the paper consists of the following six sections. Section two
provides previous research and hypotheses development. Section three describes our research
model and research sample and other data used in our analysis. A description of the research
results is presented in the fourth section. The fifth section provides the sensitivity analysis.
Conclusions and suggestions from the research are set out in section six.
PREVIOUS RESEARCH AND DEVELOPMENT HYPHOTHESIS
Association between Tax Planning and Firm Value
The previous research of tax planning has been viewed two perspective differences.
Firstly, the traditional theory perspective view of the tax planning (or tax avoidance) is seen
as leading to increase after tax earnings and therefore to be in the interest of shareholders, this
is typically taken in valuation model/firm value (Desai & Dharmapala, 2009; Wahab &
Holland, 2012; Desai & Dharmapala, 2006). Tax planning activities that reduce transfer
resources from shareholders to government should generally enhance shareholders
wealth/firm value. Secondly, the agency theory perspective views of the tax planning suggest
that tax planning can be complex and opaque and can possibly allow for managerial
opportunism. Tax planning can lead to a reduction in firm value when managers have both
the opportunity to understate reported accounting profit and the incentive to reduce corporate
income tax liability by understating taxable income or less transparency (Desai &
Dharmapala, 2009; Wahab & Holland, 2012; Minnick & Noga, 2010; Desai & Dharmapala,
2006). The role of Corporate Governance (CG) mechanism in tax planning thus can become
Wahab & Holland (2012) conducted research relationship between shareholders
valuation of corporate income and tax planning with corporate governance (CG) as
moderating variable in U.K contexts. The authors used the difference between a firm’s
current tax provision as disclosed in its annual financial statements and the (national) level of
tax that would be payable if its profit before tax was subject to tax at the UK statutory rate to
measure tax planning. They used two moderating variable CG mechanisms are Institutional
ownership (IOWN) and Non-Executive Ownership (NED) to examine whether affect the
moderating variable CG of the relationship between tax planning and firm value. The authors
have two empirical results: first, they found evidence of negative significant relationship
between the level of tax planning and firm value which is robust to controlling for corporate
governance. Second, the author found no significantly CG as moderating the relationship
between firm value and tax planning. This result supported by Desai & Dharmapala (2009) in
contexts US firms. Desai & Dharmapala (2009) used institutional ownership as measured
corporate governance.
Desai & Dharmapala (2009), investigating the relationship between tax avoidance
activities and firms value using a sample 862 U.S. firms. In the research, tax avoidance is
measured by book-tax gap while Tobin’s Q is the proxy for the firm value. The authors used
institutional ownership as measured corporate governance. They found no direct significant
relationship between tax avoidance activities and firm value. Further analysis the authors are
split for the measuring of corporate governance which is based on fraction of a company’s
share owned by institutional investors in which ratios of more than 60 percent are indicate of
stronger governance institutions “high” and less than 60 percent are indicate weak
governance institutions “Low”. They found a significant positive effect of tax avoidance on
be correlated with firms’ corporate governance. Therefore, the paper suggests that
shareholders value tax planning activities by reference to both their magnitude and risk.
Wang (2010) examines the relation among tax avoidance, corporate transparency and
firm value. The authors used cash effective rates and permanent book-tax difference to
measure tax avoidance, which firm value as proxy by Tobin’s Q using sample S&P 1500
firms in the period 1994 to 2001. They found positive significant relationship between tax
avoidance and firm value.
Therefore, as there is general lack of published research that studies these relationship
in Indonesia setting. Further research needs to be conducted to confirm the relationship using
Indonesia data such (Chasbiandani & Martani, 2012; Permatasari & Martani, 2012).
Chasbiandani & Martani (2012) commited research relationship between long run tax
avoidance behavior and firm value. The authors used sample non-banking and financial firms
in Indonesia stock exchange for period 2010 to 2011. The authors used similary method by
Dyreng, Hanlon, & Maydew (2008) who measured long run tax avoidance, and firm value is
proxed by Tobins’ Q. They found that long run tax avoidance has a negative significant
relationship between long run tax avoidance and firm value, this study suggest that firm with
lower ETR, has higher firm value.
Permatasari & Martani (2012) investigate the relationship between earnings
management and tax planning practies toward earning informativeness. The authors used
similary method applied by Ayers, Jiang, & Laplante (2009) who measure tax planning by
current effective tax rate (CurrETR). Current ETR is obtained from distribution of current tax
(current tax expense) and income before tax (pre tax book income). This researchers used
samples of manufacturing companies listed in Indonesia Stock Exchange for the year 2004 to
become less informative when it is compared to other companies which do not perform the
tax planning.
The above previous studies concentrate on U.S. or U.K setting and the document
mixed the directions of the association between tax planning activities with firm value.
Therefore, based on the above – mentioned mixed findings of previous studies, the extent of
tax planning is presumed to be related to firm value in unpredicted directions. Thus, it is
hypothesized (in alternative form) that:
Hypothesis 1 (H1): There is an association between tax planning activities and firm value.
The Relationship Between Tax Planning and Firm Value by Moderating Board Diversity
Based on literatures of the previous studies, diversity follows two fundamental
distinctions: the demographic and cognitive (Erhardt, Werbel, & Sharder, 2003; Aliani &
Zarai, 2012a). The research literature about group diversity can be viewed from two
perspectives. First perspectives can be observable or measureable attributes of individuals as
demographic characteristics, proxy variables such gender, age, race, ethnicity, minority, and
nationality. Second perspective is non observable variable or underlying attributes cognitive
characteristics, proxy variables such as attitudes, values, beliefs (Kilduff, Angelmar, &
Mehra, 2000; Aliani & Zarai, 2012a).
The previous studies about board diversity can be classified into two major stream of
literatures. The first field of research focuses on studying the relationship between board
diversity and firm performance or firm value. Several reseachers were committed to examine
favorable characteristic board diversity to firm value or firm performance such gender,
minority, race/ethnic, age, nationality as measured diversity (Carter, Simkins, & Simpson,
2003; Darmadi, 2010; Erhardt, Werbel, & Sharder, 2003; Kusumastuti, Supatmi, & Satra,
of diversity to tax planning (Aliani & Zarai, 2012a; Aliani & Zarai, 2012b) or tax compliance
(Torgler, 2006).
Carter, Simkins, & Simpson (2003) committed research on the relationship between
board diversity and firm value for Fortune 1000 firms. The author defined board diversity as
the percentage of women, African, American, Asians, and Hispanics on the board of
directors. They used Tobin’s Q as measured firm value, thus also used control variables are
size, industry and corporate governance. They found significant positive relationships
between the fraction of women or minorities on the board and firm value. The authors also
found that the proportion of women and minorities on boards increases with firm size and
board size, but decreases as the number of insiders’ increases. Similar those results by
Erhardt, Werbel, & Sharder (2003), found that the precentage of minority directors ethnic
positively related to firm performace. Therefore, Kilduff, Angelmar, & Mehra (2000) found
that positive significant association between age heterogeneity and marketing performance.
In Indonesia case, the investigation of the relationship between board diversity and
firm value or firm performance have been done by Kusumastuti, Supatmi, & Satra (2007) and
Darmadi (2010). Kusumastuti, Supatmi, & Satra (2007) examined the relationship between
board diversity and firm value, using sample of 48 manufacturing companies listed at
Indonesia Stock Exchange in 2005. The author used five variables as measured board
diversity, there are: women in board, minority race availability (Chinese/Tionghoa ethics),
outsider directors, age and educational background from the member of directors. They
defined age as the proportion of directors member whose age is 40 years or older.
Educational background as proxy by the proportion of director member has background study
the economics and business. Thus firm value is measured by Tobin’s Q. The authors found
negative significant association between minority race availability (Chinese/Tionghoa ethics)
outsider directors, age and educational background from the member of directors are not
significant related to firm value. They suggest that negative minority race availability
(Chinese/Tionghoa ethics) related characteristic ethics Chinese are more likely Families than
firm value.
Darmadi (2010) examine the realtionship between diversity of board members and
financial performance, using sample of 169 firms listed on the Indonesia Stock Exchange
(IDX). The author used three variable as the proxy board diversity, such gender, age and
nationality. The author used the proportion of women, foreign nationals (nationalty) and
board members of no more than 50 years old called “young member”. Firm performance are
measurement Tobins’ Q and ROA (Return on Asset). They found three results: first, there is
negative significant association between gender on board diversity and firm performance.
Second, they found positive significant of the relationship between young member of board
diversity and firm performance. Finally, they found no significant nationality association
between nationality and firm performance.
Another stream committed research that the effect board diversity to tax planning or
tax compliance. Aliani & Zarai (2012a), examined the effect of demographic gender diversity
on corporate tax planning, using a sample 300 firms (S&P 500) on American firms for period
1996 to 2009. The author used gender as proxy demographic diversity, thus tax planning
measured by effective tax rate (ETR). They found that gender diversity on the board was not
significant and did not have effect on tax planning. Aliani & Zarai (2012b) also investigated
whether board directors attributes have an impact on corporate tax planning in developing
countries, using sample of 32 companies listed on the Tunisia Stock Exchange. The author
used four variable as measured board directors attributes are duality CEO, diversity on the
board of directors (percentace of women directors), Independen director and board size. They
planning. Duality showed a negative relationship between effective tax rate as measured tax
planning. Therefore, diversity as measured by gender on the board of directors showed
positive association.
Togler (2006) committed research to examine religiosity as a factor that potencially
affect tax morale, using the world values survey period 1995 – 1997 covering more than 30
countries at the invidual level. The authors used several variables such age, education level or
background, gender, matrial status and employement status. They argues that older people are
more sensitive to the threats of sanctions and over the years have acquared greater social
stakes. Some previous studies found that age increases the level of tax compliance (Vogel,
1974; Torgler, 2006). Education is related to tax payer’s knowledge about the tax law. Better
education tax payer are supposed to know how to assess the degree of complaince (see Lewis,
1982; Torgler, 2006). They found that positive significant association between more older
people and tax compliance.
Several previous literatures such Desai & Dharmapala, 2009; Wahab & Holland,
2012, found inclusion that the impact corporate governance mechanism as moderating
variable on the realtionship between tax planning (or tax avoidance) and firm value. This
current study will be used as new prespective form corporate governcance mechanism with
board diversity. Accroding to Catalyst (2005); Ernest & Young (2009) that diversity helped
corporations lead and manage sustainable, effective business strategies, role model employee
opportunities, and enhance their reputation. If an organization is managed effectively, this
diversity offers the flexibility and creativity we need to recover from the economic crisis and
confront the many forces challenging.
The literatures presented above show the diversity that tends to generate new
knowledge / innovation, the quality of decision-making board of directors, therefore this
related to tax planning acts. By knowing the characteristics of the board of directors, it is
expected that they are more efficient in tax planning so that it gives impact on the increase in
firm value. Board diversity is proxies by the proportion of the members board directors of
40-50 years old (AGE), the proportion of the member board directors of the Chinese ethnics
(MINORITY) and the proportion of the member board directors which educational
background (BSTUDY) majoring economics and business of the context of tax planning
Indonesia; we test a new framework to examine the effect of these studies on the relationship
between tax planning and firm value when moderated by board diversity. To test the
hypotheses related to the moderating effect of board diversity on the relationship between tax
planning activities and firm value, the following hypotheses are be tested (in alternative
form):
Hypothesis 2 (H2a): The effects of positive (negative) tax planning and firm value would be strengthened (weakened) by the magnitude of the proportion of the board member
directors of 40 – 50 years old.
Hypotheses 2b (H2b): The effects of positive (negative) tax planning and firm value would be
strengthened (weakened) by the large of the proportion of the board members directors
of the Chinese ethnics in the company.
Hypotheses 2c (H2c): The effects of positive (negative) tax planning and firm value would be
strengthened (weakened) by the magnitude of the proportion of the board members
RESEARCH METHODOLOGY Empirical Model
The empirical analysis of this study based on previous studies (Wahab & Holland,
2012; Aliani & Zarai, 2012a; Darmadi, 2010; Kusumastuti, Supatmi, & Satra, 2007; Carter,
Simkins, & Simpson, 2003). The initial model I is to test the hypothesis examining the
association between tax planning and firm value and related variable control. We estimate the
following regression model I.
! " # $ (Model I)
Model II is to examine the association between tax planning and firm value and
related variable control test including board diversity (AGE, MINORITY and BSTUDY). We
estimate regression model II:
% &' ( " (
! ) " # $ (Model II)
The third model III tests whether the relationship between firm value and tax planning
are moderated by board diversity. Model III is extended by inclusiring/inclusion the three
moderating variables, AGE*TP, MINORITY*TP and BSTUDY*TP constructed by
multiplying a firms tax planning variable by AGE, MINORITY and BSTUDY variables
respectively.
% &' ( " ( % *
&' ( * " ( * ! )
" # + $ (Model II)
Similar to applied method in the previous study by Wahab & Holland (2012) who
used the opening book value of equity as deflated for each of the three models. The models
were estimated using EVIEWS economics software. We used panel data; therefore
model of estimation. We have to test for the presence of individual effect of Indonesia firms.
In the second steps, we checked whether the fixed effect or the random effect should be
considered in estimating model parameters. The last step consists on estimating the
coefficients of our variables. We also checked the heteroscedasticity by general least square
or white heteroscidacity and check the multicolinearity by variance inflation factors (VIF).
Measurement variables
Dependent variable is firm value. Firm value is proxy with market value equity
(MVEt+3month) consistency with Wahab & Holland (2012). Market value equity is measured
three months after accounting year end to reflect the lag in disclosing annual financial
statements to shareholders (Horton, 2008; O’Hanlon & Taylor, 2007; Wahab & Holland ,
2012). Share price used is closing price share the end of March period year sample.
Independent variable is tax planning (TP). Similar to Wahab & Holland (2012), tax
planning is measurement in three steps : first, ETR (Effective tax rate) was current tax
expense (CTE) exclude deferred tax expense (Dyreng, Hanlon, & Maydew, 2008) with pre
book tax income (PBTI). Second, government tax rate (25%) minus ERT firms with PBTI.
Finally, TP scaled with book value equity t-1 or opening book value equity.
Moderating variable has three proxies of diversity of board consists: firstly,
proportion of the board of director member of 40 – 50 years old (AGE). We defined age of
member directors as that 40 – 50 year old as on 31 December 2012. In Indonesia cases those
age (40 – 50 years) are productive ages, this is a period of people to achieve and maintain
satisfaction in their careers. We argue earlier studies that older people are more likely
sensitive to the threats of sanctions and over the years have acquired greater social stakes.
However, many studies have found that age increases the level related with tax morale and
firm performance (Torgler, 2006; Kusumastuti, Supatmi, & Satra, 2007; Darmadi, 2010).
Secondly, Chinese /Tionghoa ethnics (MINORITY) are proportion of the board of
director. The earlier studies show that minority is related to firm performance (Carter,
Simkins, & Simpson, 2003; Erhardt, Werbel, & Sharder, 2003; Kusumastuti, Supatmi, &
Satra, 2007). In Indonesia cases Chinese or Tionghoa ethnics is minority race but have a big
influence in the business. According to Suryadinata (2008), there are several factors to make
Chinese ethnic successful in business; the success of the Chinese ethnic is driven by working
ethos and high distinctive spirit of minorities. Thriftiness and the discipline are at the core of
this philosophy. Business is also became a hallmark of life citizens of Chinese. Chinese as an
ethnic minority have culture, which has been held in high esteem, it allows them to stand and
succeed in running a business.
Finally, proportions of the board of directors have education/study background
majoring economics and business (BSTUDY). We argue that education was related to tax
payer’s knowledge about tax law (Torgler, 2006). The knowledge/science of tax/taxation is
commonly obtained from the school of economics and business. If members of the board of
directors have education background economics and business are expected to be better in
managing company effectively and efficiently especially in tax planning activities.
Base on the findings previous studies (Wahab & Holland, 2012; Aliani & Zarai,
2012a; Aliani & Zarai, 2012b; Desai & Dharmapala, 2009; Carter, Simkins, & Simpson,
2003; Darmadi, 2010; Kusumastuti, Supatmi, & Satra, 2007) we also used seven control
variable are Book Value Equity (BVE), Pre Book Tax Income (PBTI), earnings Management
(EM) is , Leverage (LEV), Capital Intensity (CAPINT), Board Directors Size (BDS) and
Lastly, dummy variable for control specific industry (DUM_Ind). The measurements above
Table 1 Mesurement Variables 1 ... Error! Bookmark not defined.
Sample Data and Data Sources
This study employs a panel dataset of large sample listed on the Indonesia Stock
Exchange (IDX) during two years period 2010 to 2011 restricted to non-banking firms and
financial firms. The initial samples are 443 firms, but exclude banking and financial firms (81
firms), negative book value equity is (15 firms), negative pre book tax income (PBTI) is (61
firms) consistency with Wahab & Holland (2012). While, the sample exclude, Initial Public
Offering (IPO) is 23 firms, financial reporting with other Rupiah currency is 21 firms. We
also exclude firms is merger, takeover and accounting report more than 12 months are 8
firms, then annual report not complete are 6 firms. The final samples are 221 firms, and give
a balance panel of 442 year end observations over the two years (2010 to 2011).
Financial statement and annual report data used are gathered from Data-stream and
the Indonesia Stock Exchange (IDX). Industry classification used from the classification of
industries base on Indonesia Capital Market Directory (ICMD). Board diversity is collected
manually from annual report.
RESULTS AND DISCUSIION Statistic Descriptive Analysis
Descriptive analysis for variables used in the study can be seen in appendix of table 1.
Resulted is table 2 after winsorizing about variable outlier consist range ± 3 standard deviation consistency with Beatty and Weber (2003). Based on Table 2 the mean value for
each variable includes its mean, maximum, minimum and standard deviation value. For
instance, the mean of firm value or market value equity of 9.060 billion rupiah currency and
mean of tax planning of 11.80 billion rupiah currency. Tax planning (TP) can be firstly
ETR is below government rate (25%). The board diversity characteristics of the sample can
be summarized as follows: the mean age of 53% (proportion age of board directors 40 – 50
years), minority of 48% (proportion Chinese/Tionghoa ethnics on board director member)
and BSTUDY of 54%, it shows that the average education background of board directors
members are economics or business.
******Insert Table 2 and Table 3*******
Empirical Result
The results of the three models are reported in Table 4 and 5. The first two models show a significant positive relationship between firm value and tax planning which is robust
to controlling for board diversity in model II (see Table 4). The result supported hypothesis 1 and consistent to previous study which found significant positive association between tax planning activities or tax avoidance and firm value (Wang, 2010; Chasbiandani & Martani,
2012). We found positive relationship between firm value and tax planning in line with
traditional perspectives. The significant variable controls are signed positive; it consists of
Book value equity (BVE) and pre book tax income (PBTI). The variables control EM, LEV
and BDS are negative significant, therefore variable control CAPINT and Dum_IND are not
significantly. Thus, board diversity as variable control, we found MINORIY is negative
significant the relationship between firm value, and the others variable AGE and BSTUDY
are not significant, supported (Kusumastuti, Supatmi, & Satra, 2007).
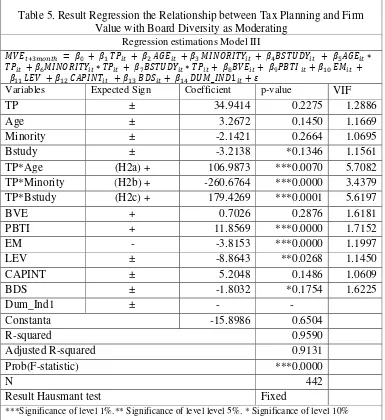
The model III incorporates three moderating variables AGE*TP, MINORITY*TP and
BSTUDY*TP to investigates the relationship between tax planning and firm value. The
previous result shows positive significant relationship between tax planning and firm value.
The interaction variable AGE*TP and BSTUDY*TP shows positive significant relationship
between tax planning and firm value, the result is not support hypothesis 2b. The found negative can be explaining with characteristic ethnics Chinese which are Bjerke (2000);
Setyawan (2005); Suryadinata (2008): firstly, power and autocracy, management Chinese
ethnics tend autocracy and centralization of single man. Secondly, Families’, Chinese ethnics
tend to be stronger families for hire employee or business networking. Finally, networking
(Guanxi), Chinese ethnics are more likely to put networking on business as important them.
******Insert Table 4and Table 5*******
Sensitivity Analysis
The primary model I,II and III used market value equity as measured firm value, we
used alternative proxy by Tobin’s Q, it has been used in some studies (Carter, Simkins, &
Simpson, 2003; Chasbiandani & Martani, 2012; Desai & Dharmapala, 2009; Darmadi, 2010;
Kusumastuti, Supatmi, & Satra, 2007). The Tobin’s Q is computed by deflating, the amount
of assets plus market value of common stock minus book value of common stock minus
deferred tax expense, by book value of assets.
We used full sample and full model for analyzing sensitivity; meanwhile only model I
and II were consistent with primary model (see Table 6). Therefore, there is significant positive relationship between tax planning and firm value which robust the controlling board
diversity. When using Tobin’s Q to examine model III, we found the moderating influence of
board diversity on the relationship between tax planning and firm value was inconsistent.
******Insert Table 6 *******
CONCLUCIONS
The purpose of this research is to analyze the impact activities of tax planning to firm
value with board diversity as moderating variable. The research is conducted for non-banking
are: firstly, we found evidence of positive relationship between tax planning and firm value.
Secondly, we found evidence that board diversity (AGE and BSTUDY of member director)
could increase the positive influence of tax planning into firm value, except for MINORITY
could decrease the positive influence of tax planning into firm value. Finally, the results of
the sensitivity test with the full model and the full sample suggested that tax planning had
robust positive effect in increasing firm value, then the moderating influence of board
diversity (BSTUDY and MINORITY) on the relationship between tax planning and firm
value was consistent but other variables of board diversity (AGE) are not consistent.
This study is several shortcomings and opens up opportunities for other researchers to
develop this further research. There are several caveats that can be overcome by further
research. First, the sample population is still limited to the years of 2010 – 2011. Future
studies may expand the sample by extending span time of sample taking. Therefore, further
studies are needed to compare the condition existing Indonesia with other countries that have
better business climate. Second, the variables used in this study cannot fully explain tax
planning. Therefore, further research can explore tax planning component such permanent
and temporary differences, as well as Cash ETR. Third, board diversity such AGE,
MINORITY and BSTUDY. Therefore, further research can explore other board variable such
Age can be measure by average age of member board directors, gender, level education
background as proxy BSTUDY, nationality as proxy minority, gender and experience or
tenure.
Acknowledgement
The paper is part of the postgraduate thesis of Nanik Lestari in Accounting Department,
REFERENCE
Akbar, S., & Strak, W. A. (2003). Deflators, Net Shareholder Cash Flows, Dividends, Capital Contributions and Estimated Models of Corporate Valution. Joutnal of Business Finance and Accounting 30 (9-10) , pp. 1211-1233.
Aliani, K., & Zarai, A. M. (2012a). Demographic Diversity in the board and corporate tax planning. Journal Business Management and Strategy Vol 3 No.1 , pp. 72-86.
Aliani, K., & Zarai, A. M. (2012b). the board of directors and the corporate tax planning: Empirical evidence from Tunisia. International Journal of Accounting Financial Reporting Vol.2, No.2 , pp. 142-157.
Amir, E., & Sougiannis, T. (1999). Analysts’ Interpretation and Investors’ Valuation of Tax Carryforwords. Contemporary Accounting Research 16 (1) , pp. 1-34.
Amstrong, C. S., Blouin, J. L., & Larcker, D. F. (2012). The Incentives for Tax Planning. Journal of Accounting and Economics 53 , pp. 391-411.
Ayers, B. C., Jiang, J. X., & Laplante, S. K. (2009). Taxable Income as a performance measure: the effect of tax planning and earnings quality. Contemporary Accounting Research Vol.26 No.1 , pp. 15-54.
Beatty, A., & Weber, J. (2003). The effect of Debt Contracting on Voluntary Accounting Mehtod Changes. Journal Accounting Review , 119 - 142.
Bjerke, B. V. (2000). A Typified, Culture - based, Interpretation of Management of SMEs in Southeast Asia. Asia Pacific Journal of Management , 103 - 132.
Carter, D. A., Simkins, B. J., & Simpson, W. G. (2003). Corporate Governance, Board Diversity, and Firm Value. Financial Review 38 , 33 - 52.
Catalyst. (2005). Catalyst census of women board directors of the fortune 1000. New York.
Chasbiandani, T., & Martani, D. (2012). The effect Tax Avoidance long run to firm value (Pengaruh Tax Avoidance jangka panjang terhadap nilai perusahaan). Simposium National Accounting (Simposium Nasional Akuntansi). Banjarmasing Kalimantan Timur (East Kalimatan Provisi Indonesia): Ikatan Akuntan Indonesia (Associated Accountant Indonesia).
Darmadi, S. (2010). Baord Diversity and Firm Performance (The Indonesia Evidence). Munich Personal Repec Archive (MPRA) .
Desai, A. M., & Dharmapala, D. (2009). Corporate Tax Avoidance and Firm Value. The Review of Econmics and Statistics , p.537-546.
Desai, M. A., & Dharmapala, D. (2006). Corporate tax avoidance and high - powered incentives. Journal of Financial Economics 79 , pp. 145 - 179.
Erhardt, N. L., Werbel, J. D., & Sharder, C. B. (2003). Board of director diversity and firm financial performance. Corporate governance: An International Review Vol.11 No.2 , pp. 102-111.
Ernest, & Young. (2009, October 20). Ground Breakers Study, Diversity an Equation for Sucess. Retrieved from http://www.ey.com/GL/en/Issues/Driving-rowth/Groundbreakers-Diversity-an-equation-for-sucess
Hanlon, M., & Slemrod, J. B. (2009). What does tax aggressiveness signal? Evidence from stock price reactions to news about tax shelter involvement. Journal of Pubic Ecnomics 93(12) , 126 -141.
Horton, J. (2008). The value relevance of "realistic reporting": evidence from UK life insurers. Accounting and Business Research 37(3) , pp. 175-197.
Kilduff, M., Angelmar, R., & Mehra, A. (2000). Top Management Team Diversity and Firm Performance: Examining the role of cognitions. Organization Science Vol.11 No.1 , pp. 21-34.
Kusumastuti, S., Supatmi, & Satra, P. (2007). Pengaruh board diversity terhadap nilai perusahaan dalam prespektif corporate governance (The impact of board diversity on firm value: Corporate Governance prespective). Journal Akuntansi Keuangan (Journal of Accounting and Finance) Vol.9 , 88-98.
Mills, L. F., Erickson, M., & Maydew, E. L. (1998). Investment in Tax Planning. The Journal of the American Taxtion Assoction 20 (1) , pp. 1-20.
Minnick, K., & Noga, T. (2010). Do Corporate governance characteristic influence tax management. Journal of Corporate Finance 16 , 703 - 718.
Noor, R. M., & Sabli, N. (2012). Tax Planning and Corporate Governance. Intenational Conference on Business and Economic Research (3rd ICBER), (pp. 1996 - 2020). Bandung, Indonesia.
O'Hanlon, J. F., & Pope, P. F. (2007). The value relevance of disclosures of liabilities of equity-accounted investees: UK evidence. Accounting and Business, 37(4) , pp. 267 - 284.
Permatasari, G. R., & Martani, D. (2012). Effect of earning management and tax planning to earning information content of manufacturing companies in Indonesia. International Conference on Business and Economics Research (3rd ICBER), (pp. 2272 -2287). Bandung.
Scholes, M., Wolfson, M., Erickson, M., Maydew, E., & Shelvin, T. (2002). Taxes and business strategy: A Planning Approach 3rd Edition. Prentice Hall, Inc.
Setyawan, S. (2005). Tionghoa Ethnic of culture context on human resources managemet (Konteks Budaya Etnis Tionghoa dalam manajemen sumber daya manusia). BENEFIT Vol.9 No.2 , 164 - 170.
Suryadinata, L. (2008). Ethnic Chinese in Contemporary Indonesia. Institute of Southeast Asian Studies, Singapore.
Wahab, N. S., & Holland, K. (2012). Tax planning, corporate governance and equity value. The British Accounting Review 44 , 111-124.
Wang, T. X. (2010). tax avoidance, corporate transparancy, and firms value. Retrieved 2013, from http://ssrn.com.
Wijaya, A. T. (1991). Tax planning aspect on Fiscal Financial Repoting BUT "X" (Aspek perencanaan pajak pada laporan keuangan fiskal BUT "X"). Depok, Indonesia: University of Indonesia.
Wilson, R. (2009). An Examination of corporate tax shelter participants. The Accounting Review 84(3) , pp. 969 - 999.
APPENDIX
Table 2. Descriptive Statistic
Variables Mean Maximum Minimum Std. Dev.
MVEt+3m (Billion.Rp) 9,060.00 299,000.00 173.00 267,000.00
MVEt+3/BVEt-1 3.21 21.99 0.01 4.08
BVE (Billion Rp) 28,800.00 75,800.00 84.80 7,110.00
PBTI (Billion Rp) 769.00 25,800.00 0.97 2,460.00 Expense and PTBI : Pre Book Tax Expense 25% government tax rate in Indonesia
AGE Age ± Proportion of the board member director 40 - 50th
years of old
MINORITY Chinese ethnics/ Tionghoa ± Proportion of the board member director of the Chinese/Tionghoa ethnics
BSTUDY Background study/ education ± Proportion of the board member director which study/education background of economics and business
BVE Book Value Equity + Natural Logarithm from book value equity firm
PBTI Pre Book Tax Income + Profit before tax
EM Earnings Management - (PTBI – CFO)/Total Asset
LEV Leverage ± Long term Debt/Total Asset
CAPINT Capital Intensity ± PPE/Total Asset
BDS Board Director Size ± Natural Logarithm a number board of directors
serving on firms.
DUM_IND Industry Dummy ± Coded 1 for manufacturing industry, 0 otherwise it i firms on years t
0 Intercept
Table 4. Result Regression the Relationship between Tax Planning and Firm Value
Coefficient p-value VIF coefficient p-value VIF
TP (H1) ± 39.2503 ***0.0000 1.0410 39.3477 ***0.0000 1.0410
Results of Haustmant test Random Random
***Significance of level 1%.** Significance of level level 5%. * Significance of level 10%
Dependent Variable Model I & II are MVEt+3month . Independent Variable: TP. Board Diversity are: AGE, MINORITY and BSTUDY. Control Variables are: BVE, PBTI, EM, LEV, CAPINT, BDS and DUM_IND. Measurement of each variable: MVEt+3month = MVE/BVEt-1 , TP: (25%-ETR)*PBTI, AGE : the proportion of the board member directors 40 - 50th
years old, MINORITY: the proportion of the board member director Chinese/Tionghoa ethnic. BSTUDY: The proportion of the board member director which education/studies background economics and business. BVEt : Natural Logarithms of BVE, PBTI: PBTIt/BVEt-1, EM: (PBTI – CFO)/ BVEt-1, LEV: Long term debt/Total Asset, CAPINT: PPE/Total asset, BDS: Natural Logarithm of number board of directors serving on the firms. Dum_Ind1: Coded 1 for manufacturing Industry and 0 otherwise. The result Haustmant test used Random Effect.
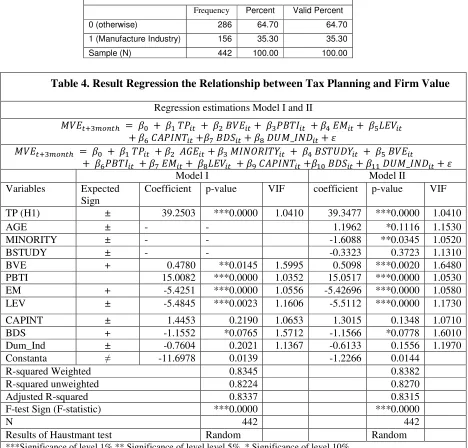
Table 3. Descriptive Statistic Dummy Variable (DUM_IND)
Frequency Percent Valid Percent
0 (otherwise) 286 64.70 64.70
1 (Manufacture Industry) 156 35.30 35.30
Table 5. Result Regression the Relationship between Tax Planning and Firm
Variables Expected Sign Coefficient p-value VIF TP ± 34.9414 0.2275 1.2886
***Significance of level 1%.** Significance of level level 5%. * Significance of level 10%
Dependent Variable Model III is MVEt+3month . Independent Variable: TP. Board Diversity are: AGE, MINORITY and BSTUDY. Control variables are: BVE, PBTI, EM, LEV, CAPINT, BDS and DUM_IND. Measurement of each variable: MVEt+3month = MVE/BVEt-1 , TP: (25%-ETR)*PBTI, AGE : the proportion of the board member directors 40 - 50th
Table 6. Result Sensitivity Analysis of the Relationship between Tax Planning and Firm Value with Board Diversity as Moderating
Result of Sensitivity analysis with Tobin’s Q of all Model
,-./01 2 % &' ( " ( % *
Coefficient p-value Coefficient p-value Coefficient p-value
TP + 1.2878 0.1109 1.3725 *0.0937 3.9274 *0.0682 ***Significance of level 1%.** Significance of level level 5%. * Significance of level 10%
Dependent Variable Model I, II & III are Tobin’s Q. Independent Variable: TP. Board Diversity are: AGE, MINORITY and BSTUDY. Control variables are: BVE, PBTI, EM, LEV, CAPINT, BDS and DUM_IND. Measurement of each variable: MVEt+3month = MVE/BVEt-1 , TP: (25%-ETR)*PBTI, AGE : the proportion of board member directors 40 - 50th