58
The Impact of Horizontal Brand Extension towards Brand Equity of Trans Corp
Susan Chrestella Bahari
International Business Management Program, Petra Christian University Jl. Siwalankerto 121-131, Surabaya
E-mail: [email protected]
ABSTRACT
Brand extension has becoming one of marketing strategies in order to boost the equity of the parent companies themselves. However, not all brand extensions can make a positive impact. Some of brand extension can cause negative impact such as dilution with the original brand. Trans Corp is one of companies that adopt brand extension such as horizontal brand extension called Trans Studio. The purpose of this research is to evaluate the impact of similarity, reputation, perceived risk, and consumer’s innovativeness, which represent as factors of brand extension towards brand equity of Trans Corp either simultaneously and individually. The research method in this research is using simple random sampling by gathering 189 qualified questionnaires from people in Jakarta who have knowledge about Trans Studio and Trans Corp where the result shows that there is positive impact as simultaneously. Meanwhile, similarity, reputation, consumer’s innovativeness have positive impact as partly however, perceived risk doesn't have significant impact as partly.
Keywords: Brand extension, Brand equity, Quantitative research
ABSTRAK
Perluasan merek adalah salah satu marketing strategy untuk meningkatkan ekuitas suatu merek tetapi, tidak semua perluasan merek memberi pengaruh positif. Namun ada beberapa perluasan merek yang memberi efek negatif yaitu dilusi dengan merek orisinilnya sendiri, Trans Corp adalah satu dari sekian perusahaan yang mempunyai perluasan merek secara horizontal yaitu Trans Studio. Tujuan dari penelitian ini adalah untuk mengevaluasi mengenai pengaruh kemiripan, reputasi, persepsi terhadap resiko, dan inovasi konsumen terhadap ekuitas merek dari Trans Corp baik secara bersamaan maupun secara individual. Metode pengolahan di penelitian ini adalah sampel acak sederhana dengan megumpulkan 189 kuisioner yang sah dari warga Jakarta yang memiliki pengetahuan tentang Trans Studio dan Trans Corp dimana hasil menunjukkan bahwa keempat faktor dapat mempengaruhi secara bersamaan tetapi ada 1 faktor yaitu persepsi terhadap resiko yang tidak dapat mempengaruhi secara individu
Kata Kunci: perluasan merek, ekuitas merek, metode kuantitatif
INTRODUCTION
Brand has becoming one of the major keys that influences customer’s purchasing decision (Jr & Keller, 2004). Therefore, companies are competing each other to create a strong and well-established brand that can obtain consumer trust. This kind of competition is also happened on Indonesia especially in television-broadcasting industry because television is one of media sources that have strong domination in Indonesia. It is proven by 97% of total population in Indonesia or approximately 240 million audiences are watching television each month (Redwing, 2012-2014). Therefore, television-broadcasting industry is growing rapidly in Indonesia. Statistic shows a forecast of television broadcasting industry revenue in Indonesia, there are 1.4 billion U.S dollars in 2012 as TV advertising revenue and it would have annual growth rate
approximately 15%, which it can achieve 1.8 billion U.S. dollars in 2017 (Statista, 2015).
59 biggest indoor theme park in Indonesia that provides 21 rides and various entertainments. Through this theme park, people can feel great experiences from TV to reality. This theme park still relates its rides with Trans TV and Trans7 programs such as Dunia Lain, Jelajah X-tra and etc (Trans Studio Bandung, 2011).
Basically, there are 4 major players that dominate over 95% of total market include MNC Group (RCTI and MNCTV), Trans Corp (Trans TV and Trans7), Emtek (Indosiar and SCTV), and Viva (ANTV and TV One) (Redwing, 2014). Trans Corp has only becoming the top 3 with 22% domination on the market while MNC Group has huge gap with the other competitors by dominating 42% of the market. In order to be the leader on this television-broadcasting industry, Trans Corp tries to set different marketing strategies, which one of those is called brand extension. Brand extension is when the original brand would like to create a new product in order to maximize brand equity of the original brand so that they can capture different market segments (Kim, Lavack, & Smith, 2001). At this level, brand extension promotes a new product that is being related to the known brand or company in order to show the quality of the new product.
Basically, brand extension has possibility to succeed, survive or damage the core brand because it can affect the original brand and the new one. When the extension is succeed it can increase the brand association of a product, which help to promote the brand. Moreover, brand extension also can increase brand recognition and association to the new target market. However, when the brand extension is failed, it can create an unfavorable brand association and damage perceived quality of product (Aaker, 1990). Furthermore, brand extension has risk that can bring confusion to the customers, which has possibility to decrease the brand equity of the core brand and the company itself (Kim, Lavack, & Smith, 2001). Because of that, company should convince the customers that the new brand has positive attribute or value to increase the awareness of the core brand itself (Barrett, Lye, & Venkateswarlu, 1999).
The dimensions of brand extension in this research are similarity, reputation, perceived risk, and consumer innovativeness (Hem, Chernatony, & Iversen, 2001). These dimensions will be used as the indicators for evaluating the impact of horizontal brand extension toward brand equity on Trans Corp. According to Aaker (1991) brand equity is about brand awareness, perceived quality, brand loyalty and brand association.
There are two types of extension, which are vertical and horizontal (Kushwaha, 2012). However, this research would like to focus on the horizontal extension, where the company is introducing a product that has different category from the usual one. Since, horizontal is unusual product compared to vertical, this research would like to analyze the impact of the horizontal brand extension towards the brand equity of the original brand. In this case, Trans Corp has a goal to pursue creativity, where they do not only pursue it in Trans TV and Trans7 but also the other business field such as Trans Studio (Ruslina, 2012). Therefore, Trans Studio is
classified as horizontal extension because it has different business category compared to Trans TV and Trans7. Trans Studio is the first indoor theme park in Indonesia that is located in Makassar and Bandung.
Therefore, the researcher would like to know whether Trans Studio as the horizontal brand extension has positive relationship or negative relationship towards the brand equity of Trans Corp since brand equity plays an important role to make Trans Corp becomes the leader on television broadcasting industry, this research would like to help Trans Corp to maximize their marketing strategy effort by knowing the impact of each indicators of brand extension towards brand equity. This finding will lead Trans Corp to have more effective and efficient brand extension strategy.
LITERATURE REVIEW
The researcher would like to evaluate the impact of horizontal brand extension toward brand equity of Trans Corp. Therefore; there are several concepts and definitions of brand extension and brand equity that can support this research.
According to Wood (2000), brand extension is when a well-established brand in one field tries to enter another market. While Kushwaha (2012) define that brand extension is part of marketing strategy where the new product is produced and related to the original brand that is successful in the market. Furthermore, Kim, Lavack, & Smith (2001) said that brand extension is when the original brand would like to create a new product in order to maximize brand equity of the original brand so that they can capture different market segments. Hence, the researcher defines brand extension as part of marketing strategies, which the original brand create a new product to maximize the brand equity of the core brand.
Basically, brand can be extended into two forms, such as vertical brand extension, where the extension still has the same product category and horizontal brand extension that have different product category (Kushwaha, 2012). Vertical extension means having the similar product category but in different price category and quality (Kim, Lavack, & Smith, 2001). While, horizontal extension means the known original brand introduce a new product that has similar product category or totally different one (Kim, Lavack, & Smith, 2001). Therefore, the definition of horizontal brand extension in this research is when the core brand introduces a new product that different from the usual product category. Therefore, researcher can conclude that Trans Studio in this case is belongs to horizontal brand extension because the original brand which is Trans Corp is focusing on broadcasting such as Trans TV while the extension here is focusing on theme park.
60 value on the extended brand. It means that when the extension can show greater similarity with the original brand, people tend to have more positive attitude toward the brand extension. Moreover, Park, Kim & Kim (2002) also stated that there is more favorable response when the extension has strong similarity with the original brand. Besides, extension that has lack of similarity has higher probability to be failed. Therefore, the evaluation of brand extension is depending on the similarity of the brand extension and the original one, and how those can be related (Ruyter & Wetzels, 2000). Based on Martinez & Chernatony (2004), there are several product attributes that usually being compared between brand extension and original brand such as symbol, name, logo and quality of the product. The higher the similarity, the easier the original brand introduces the brand extension.
Reputation is defined as the combination between the product’s qualities, the marketing activities of the company and also the acceptance of the product in the market (Hem, Chernatony, & Iversen, Factors influencing successful brand extensions, 2001). Therefore, a brand that has greater reputation has possibility to have lower risk compared to the brand that has lower reputation. Moreover, reputation can give higher impact on the services industry compare to other industry. According to Martinez & Chernatony (2004), when consumer has deeper knowledge about the product, the possibility to recognize the brand is also getting higher. Furthermore, if the information about the product is positive, consumer can easily reference the product to other people. Therefore, the researcher defines reputation as consumers’ acceptance toward a product due to consumers’ perception towards overall performance of the product.
According to Hem, Chernatony, & Iversen (2001, p.9), “perceived risk is a multi-dimensional construct which implies that consumers experience pre-purchase uncertainty regarding the type and degree of expected loss resulting from the purchase and use of a product”. Besides, perceived risk can explain consumer behavior because sometimes consumers tend to avoid mistakes compared to maximize the usage of the product that being purchased (Mitchell, 1999). Basically, the usage of well-known brand is being a risk reliever, because of that when the well-known brand introduces the new product and the consumers perceive this new product as risky. This well-known brand can give an influence where the new product is likely to be accepted (Hem, Chernatony, & Iversen, 2001). Therefore, researcher defines perceived risk as consumer behavior towards pre-purchase uncertainty and expected loss as a result if buying the product.
According to Hem, Chernatony, & Iversen (2001, p.11) consumer innovativeness is “a personality trait related to an individual’s receptivity to new ideas and willingness to try new practices and brands”. While Steenkamp, Hofstede, & Wedel (1999) believed that consumer innovativeness is “the predisposition to buy new and different products and brands rather than remain with previous choices and consumption patterns”. Therefore, it can be concluded that consumer innovativeness is tend to try new product that can give new information and ideas. A consumer that has high
innovativeness can have more possibility to try new things such as brand extension (Hem, Chernatony, & Iversen, 2001). Hence, consumer innovativeness is playing an important role to develop brand extension.
Brand Equity is “a set of brand assets and liabilities linked to a brand, its name and symbol, that add to or subtract from the value provided by a product or service to a firm and/or to that firm's customers” (Aaker D. , 1991, p. 15). While Keller (1993) added that brand equity is the differ responses that are coming from consumers’ brand knowledge to the marketing of the brand. Therefore, consumers’ point of view is really crucial on measuring brand equity of a brand. According to Solomon & Stuart (2002), good brand equity can give competitive advantage by being able to acquire larger market share and higher profit margins. Therefore based on the researcher, brand equity is consumers’ perception on the value of a brand that is coming from the knowledge about overall performance of the brand.
According to Aaker (1991), brand equity is divided into 5 categories such as brand awareness, brand associations, perceived quality, brand loyalty and other proprietary brand assets. Furthermore, brand equity also can be measured through brand awareness and brand image (Keller K. l., 1993). Besides there are another modifications of brand equity measurement, one of them is Yoo and Donthu (2001) finding that defines brand equity into 4 categories such as brand awareness, brand associations, brand loyalty and perceived quality (Yoo & Donthu, 2001). This research will evaluate the brand equity as a whole that consist of brand awareness, brand association, brand loyalty, and perceived quality.
Relationship between Concept
Through this research, researcher would like to evaluate the impact of horizontal brand extension toward brand equity of the core brand, which is Trans Corp because brand extension is not only impacting on the brand equity of the new extension but also the brand equity of original brand that introduce the extension. According to Pitta and Katsanis (1995), brand extension can easier grab consumer’s mind that creates brand awareness and brand image since, the original brand has already has positive value from the consumers. Besides, brand extension can also dominates the product category. Last but not least, successful brand extension can enhance the original brand.
61 try new product since they tend to take the risk instead of avoid it.
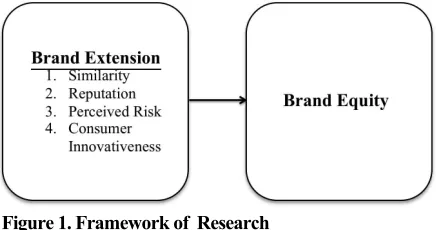
The successful brand extension will affect the brand equity of the core brand that includes brand awareness, brand associations, brand loyalty and perceived quality. Therefore, the following figure will show the relationship between brand extension and brand equity.
Figure 1. Framework of Research
Through this research, the researcher would like to examine the impact of similarity, reputation, perceived risk, and consumer innovativeness simultaneously and partly toward brand equity. There are 5 hypotheses that would like to be evaluated:
Hypothesis 1: Similarity, reputation, perceived risk, consumer innovativeness of Trans Studio simultaneously have significant relationship on brand equity of Trans Corp. Hypothesis 2: Similarity of Trans Studio has significant relationship on brand equity of Trans Corp.
Hypothesis 3: Reputation of Trans Studio has significant relationship on brand equity of Trans Corp.
Hypothesis 4: Perceived risk of Trans Studio has significant relationship on brand equity of Trans Corp.
Hypothesis 5: Consumer innovativeness of Trans Studio has significant relationship on brand equity of Trans Corp.
RESEARCH METHOD
In this research, the researcher would like to evaluate the impact of horizontal brand extension on brand equity of Trans Corp. The researcher would like to use explanatory method, which uses certain theories as base of the research then defines several hypotheses that want to be evaluated. Through this method, the researcher would like to know the impact of horizontal brand extension on the brand equity of Trans Corp.
According to Cooper and Schindler (2014), there are four types of data such as nominal, ordinal, interval and ratio data. Therefore, this will use nominal and interval data. Basically, nominal data is used for screening questions such as profile of respondents such as gender, education, occupation, and range of age. While, interval data will be used for questionnaire because the researcher will use Likert scale to rate each question that being asked to the respondents. Likert scale shows favorable and unfavorable response toward the statement. Usually number 1 shows the least favorable while 5 are the most favorable one. Likert scales can use 5, 7, or 9 scale points but in this research, the researcher here would like to use 5 scale points since it still consider the neutral answer of the respondents and doesn't
have to maintain many response options (Cooper & Schindler, 2014). The dependent variable that is brand equity will be measured using 5 points of Likert scale (1 = strongly disagree, 5 = strongly agree). It also applies on the independent variables that consist of similarity, reputation, perceived risk and consumer innovativeness.
There are two types of data, which are primary and secondary data. According to Cooper & Schindler (2014), primary data is “data the researcher collects to address the specific problem at hand- the research question” (p. 663). The source of primary data is coming from questionnaire that will be distributed to the appropriate respondents who know about Trans Corp and Trans Studio. On the other hand, secondary data is “results of studies done by others and for different purposes than the one for which the data are being reviewed” (Cooper & Schindler, 2014, p. 665). Hence, secondary data can be gathered through books, reference journals, websites that discuss about brand extension and brand equity.
Basically there are two components of variables, which are independent variable and dependent variable. These two variables are like cause and effect situation where the independent variable is the cause while the dependent variable is the effect. Hence in this research, there are 4 independent variables, which are similarity (X1), reputation (X2), perceived risk (X3), and consumer innovativeness (X4) while the dependent variable is brand equity (Y), which includes brand awareness, brand associations, brand loyalty, and perceived quality. These 4 independent variables that act as the measurement of brand extension will affect simultaneously and partly. However, the dependent variable that will be affected is only brand equity as a whole.
Since collecting all the population is almost impossible to be done especially with high population like Indonesian people that consist of 248.8 million people in 2013 (BPS, 2013), a sampling is really helpful because it can give lower cost, better accuracy of result, faster in collecting the data and availability of population elements. The population of this research is Indonesian people who have knowledge about the existence of Trans Corp and Trans Studio. People who have the knowledge can be said qualified because this research would like to know people perception on the brand extension of Trans Studio and brand equity of Trans Corp.
62 same probability of being selected and the respondents will be randomly selected (Cooper & Schindler, 2014). The researcher will spread the questionnaire directly to the respondents who have knowledge about Trans Studio and Trans Corp. The distribution of the questionnaire will take place on Dunia Fantasi (Dufan) because the target market of Dufan and Trans Studio is the same where people want to enjoy playing various rides in the theme park.
According to Uma Sekaran (2003), the minimum data sample of a research is 30 respondents. While according to Tabanick and Fidell (2007), sample size that is suitable for a research is 82 if the researcher decides to spread approximately 200 questionnaires.
There are various analytical methods that will be used in evaluating the impact of horizontal brand extension on brand equity of Trans Corp, which are validity and reliability test, descriptive statistics, blue classic assumption tests: multicollinearity, normality test, heteroscedasticity, and autocorrelation, and multiple regression analysis (T-test, F-test, coefficient determination (R2), and adjusted R2)
RESULTS AND DISCUSSION
The respondents of this research are Indonesian people who have knowledge about the existence of Trans Corp and Trans Studio where the focus is Jakarta area. There are 200 questionnaires that being spread around Dufan, Jakarta, however, the qualified one are 189 questionnaires due to incomplete in filling the questions. According to the screening questions’ result, 89 people or 47.1% of total respondents are male, while on the other hand, while 100 people or 52.9% of total respondents are female. It shows that the respondents are almost equal between female and male. Besides, there are 5 age groups where less than 17 years old is consist of 16 people (8.5%), 17 to 25 years old is consist of 134 people (70.9%), 26 to 34 years old is consist of 26 people (13.8%), 35 to 43 years old is consist of 12 people (6.3%), and more than 43 years old is consist of 1 people (0.5%). This can be happened due to the distribution of the questionnaire took place on Dufan where there are more teenager or young adult who play in the amusement park. While 66.1% of the total respondents are student since most of their age range is 17 to 25 years old. Furthermore, the second leading is employee, which consist of 45 people or 23.8% of total respondents. Meanwhile, entrepreneur consists of 7 people that contribute around 3.7 % of the total respondents. On the other hand, each housewife and other jobs represent 6 people or 3.2% of total respondents. Besides, 97 people represent 51.3% of the total respondents are Senior High School graduate. While the second highest is Bachelor that contributes 24.9% or 47 people. On the other hand, Junior high school graduate contributes 14.3% of the total respondents or consist of 27 people. Meanwhile, there are 13 people graduated from diploma, which contributes 6.9%, and there are 5 people graduated from master degree, which contribute 2.6% of total respondents. Last but not least, all of the respondents have knowledge about Trans Studio and Trans Corp.
According to the result, each of the questions for similarity, reputation, perceived risk, consumer innovativeness and brand equity are assumed as valid because all the questions have fulfilled the minimum requirements, which are Pearson Correlation is more than 0.3 with significant level under 0.05.
Meanwhile, the reliability test shows that all of the variables are reliable, because according to Sekaran (2003), the data can be said as reliable is when the results of the reliability test achieve at least 0.6.
In this research, the researcher would like to use P-P plot and histogram to measure whether the data is normally distributed or not. A good data is when the dots in the P-P plot do not spread far away from the diagonal line.
Through the figure above, it can be seen that the dots is not spread far from the diagonal line, therefore the data is considered as normally distributed. Meanwhile in histogram, the data is normally distributed when the scattered plot is closely distributed around the diagonal line. Through the figure above, the data is categorized as normally distributed because the data is spread around the diagonal line.
On the other hand according to the statistical method, the researcher will use Kolmogorov-Smirnov test to evaluate whether the data is normally distributed or not. Based on Wibowo (2012), the data can be said normally distributed when the significant level is more than 0.05.
Table 1. Result of Kolmogorov-Smirnov Test
According to the result above, it shows that the Asymp. Sig. (2-tailed) is more than 0.05, which is 0.052. Therefore, the result is accepting H0, which mean that the data is normally distributed.
63 Table 2. Result of Multicolinearity Test
Based on the table above, it shows that there is no multicolinearity because the VIF of average similarity (1.127), average reputation (1.219), average perceived risk (1.159), and average consumer innovativeness (1.147) towards average brand equity are below 10. Besides, the tolerance level is more than 0.1 where average similarity has 0.887, average reputation has 0.820, average perceived risk 0.863 and average consumer innovativeness 0.872.
Basically there are several ways to do heterocedasticity test however, the researcher has decided to use Glejser test. Based one Ghozali (2013), a model will not have heteroscedasticity when the significant value is more than α (0.05).
Table 3. Result of Heteroscedasticity Test
Through the table above, it shows that there is no heterocedasticity because all the significant level is more than 0.05, where average similarity has 0.304, average reputation has 0.497, average perceived risk has 0.401, and average consumer innovativeness has 0.956. Therefore in this case, the model accepts H0.
This research is using Durbin Watson to test whether there is autocorrelation or not. According to Ghozali (2013), there will be no autocorrelation when du < d < 4 – du.
Table 4. Result of Autocorrelation Test
Since the amount of the data is 189 respondents, the du is 1.788 and 4-du is 2.212. Based on the table above, the value of the Durbin Watson for this model is 1.823 which mean that there is no autocorrelation because 1.788 < 1.838 < 2.212. Therefore, the result is accepting H0 which is there is no autocorrelation.
The usage of F-test is to know whether the independent variables have significant influence toward dependent variable simultaneously or not. According to
Ghozali (2013), when the significant F is lower than 0.05 it can reject H0, which mean independent variables, are significant influence simultaneously.
Table 5. Result of F-Test
Through the table above, it shows that the model is rejecting H0, which mean there is significant influence simultaneously. When all of the independent variables are included the F value is 30.962 with significant F is below 0.05. It means that all 4 independent variables give a significant impact as simultaneously. Therefore, H0 in this case is rejected.
T-test is to measure whether independent variable has significant relationship toward the dependent variable partly or not. According to Ghozali (2013), when the significant T is lower than 0.05 it means that it will reject the H0 where there is significant influence between the independent variables toward dependent variable as an individual.
Table 6. Result of T- test
Based on the table above, there are 4 independent variables that being tested in the T-test. In this research, the reverse items have been adjusted with the other items. Through the result, there is one independent variable that does not meet up with the minimum requirement, which is perceived risk. The significant level of perceived risk is 0.475, which is higher than 0.05 therefore, perceived risk doesn't impact towards brand equity as partly. Meanwhile, the other 3 variables such as similarity, reputation, and consumer innovativeness have significant influence toward brand equity partly since the significant level is below 0.05.
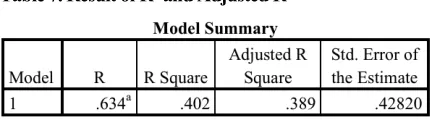
64 independent variable can only explain 38.9% of the independent variable, which is brand equity.
Table 7. Result of R2 and Adjusted R2
The purpose of this research is to know the impact of horizontal brand extension towards brand equity of Trans Corp where Trans Studio acts as horizontal brand extension. Since all the data has already passed the requirement of blue assumption test, validity and reliability test, the data can be analyzed using multiple regressions. In order to discuss the result of the research, the researcher would like to break down each of the hypotheses. Basically, there are 5 hypotheses which hypothesis 1 can be answered through the result of F- test while the rest of the hypotheses are being tested through T-test.
Basically, the first hypothesis is to know whether all the independent variables simultaneously have significant relationship or not towards the dependent variables. According to (Matarid, Youssef, & Alsoud, 2014), based on the result of their research, there is positive relationship between similarity, brand reputation and consumer innovativeness, and brand familiarity with brand equity for fast moving consumer goods in Egypt. Besides, Hem, Chernatory and Iversen showed the result of their research about fast moving consumer goods, durable goods and services that more similarity between the extension and the original one can increase the evaluation of the overall brand extension which positive brand extension can increase the brand equity of the original itself.
In order to answer the first hypothesis, the researcher should look up to the result of F-test (table 4.25.). Through the table above, the researcher can able to know that actually all independent variables simultaneously have significant relationship toward brand equity because the F value of this research is 30.962 with significant level under 0.05. It means that there is positive relationship between independent variables and the dependent variable. Therefore in this case, H0 is rejected and H1 is accepted, because similarities, reputation, perceived risk, consumer innovativeness simultaneously have significant positive relationship on brand equity of Trans Corp.
H1: Similarity has significant relationship on brand equity. The objective of this hypothesis is to analyze whether similarity has significant relationship on brand equity or not. According to (Matarid, Youssef, & Alsoud, 2014), the result of their research showed that similarity do not has significant relationship with brand equity on fast moving consumer goods in Egypt, this can be happened due to the price aggressive that happened in Egypt.
Therefore, the researcher will look up through the result of T-test (table 4.18.) since T-test is to know the
relationship partly. Based on the result above, similarity has significant relationship where the Sig. value is 0.001 with T value 3.246. Since the T value is positive, it means that similarity has positive significant relationship with the brand equity. The more similar between the extension brand and the parent brand, the better brand equity of the parent brand can be received. Therefore in this case, H0 is rejected and H1 is accepted, which means similarity has positive significant relationship toward brand equity as a part. H1: Reputation has significant relationship on brand equity.
The main purpose of this hypothesis is to analyze whether reputation has significant relationship on brand equity or not. Based on (Matarid, Youssef, & Alsoud, 2014), brand reputation has significant relationship on brand equity for fast moving consumer goods in Egypt.
According to the result of T-test (table 4.18.), reputation shows that it has significant relationship as a part where the T value 3.935 with Sig. level 0.000. Meanwhile, the result is showing positive T value, which means that reputation has positive significant relationship towards the brand equity. The higher the reputation of the extension brand has the better the brand equity of the parent company. Therefore in this case, H0 is rejected and H1 is accepted, where reputation has positive significant relationship toward brand equity as a part.
H1: Perceived risk has significant relationship on brand equity.
Meanwhile, the objective of this hypothesis is to know whether perceived risk has significant relationship towards brand equity or not. According to (Hem, Chernatony, & Iversen, 2001), there are two categories in perceived risk such as uncertainty and consequences. Based on the result of the research, uncertainty is not significant toward any extension categories however, consequences has positive impact on the evaluation of the extension which can lead whether an extension is success or not where success extension can bring higher brand equity.
If the researcher look up to the result above, it shows that T value has negative sign which mean the higher people perceived an extension brand as a risk, the lower the brand equity of the parent company. However, the significant level of perceived risk doesn't fulfilling the requirement because the Sig. value is 0.475, which is more than 0.05. Therefore in this case, H0 is accepted and H1 is rejected. It means that perceived risk has no significant relationship with brand equity individually. Perceived risk can be not impacted as partly in this broadcasting industry because this industry is different compared to fast moving consumer goods and service industry, they need to provide their product as creative as possible to attract more viewer (Clarisa, 2014) therefore, extension in this industry is not have significant risk to impact on the brand equity of the parent company.
H1: Consumer Innovativeness has significant relationship on brand equity.
65 (Matarid, Youssef, & Alsoud, 2014), based on the result of the research, consumer innovativeness has significant relationship toward brand equity for fast moving consumer goods in Egypt.
Through the result of T-test, the value of T-test is 7.182 with sig. level 0.000. It shows the highest among the other independent variables. Besides, the value of T- test is positive which means that consumer innovativeness has positive significant relationship with brand equity that act as the dependent variable. The higher the innovativeness of the consumers, the more they want to know new things. Hence, it can lead a positive attitude toward brand extension, which impact the brand equity of the parent company. Therefore in this case, H0 is rejected and H1 is accepted, where consumer innovativeness has positive significant relationship on the brand equity.
Through the table above, it can be seen that all the independent variables such as similarity, reputation, perceived risk, and consumer innovativeness can only explain 38.9% of the independent variable, which is brand equity. This can be happened because there are another independent variables that do not included in this research. One of the independent variable that being excluded is familiarity, based on (Matarid, Youssef, & Alsoud, 2014), familiarity also plays an important role in impacting the brand equity of the parent company. The higher the familiarity of parent brand which is the original product in the brand extension, the better evaluations on brand equity of the parent company. Besides, according to (Khan & Rahman, 3009), demographic data can also give impact on the successful brand extension such as age, education, profession, and etc. Whereas, (Pitta & Katsanis, 1995), claimed that successful brand extension can enhance the original brand itself.
CONCLUSION
After passing the validity test, reliability test and assumption test, multiple regression test can be conducted where the result shows that all the independent variables such as similarity, reputation, perceived risk, and consumer innovativeness have significant impact on the dependent variable, which is brand equity because they pass the F test with significant F below 0.05. However, there is one independent variable that do not pass T test, which is perceived risk. Hence, the rest independent variables such as similarity, reputation and consumer innovativeness have a significant impact on the brand equity as partly. Meanwhile, according to the model fit test, the independent variables can explain the dependent variable by 38.9%. Therefore it can be concluded that, all of the hypotheses above except hypothesis 4 are rejecting the H0, which mean they have positive significant relationship towards the dependent variable. Meanwhile, Hypothesis 4 actually has negative relationship with the dependent variable however it accepts H0 where perceived risk do not has significant relationship on the brand equity. This can be happened because television-broadcasting industry like Trans Corp is
demanded to be so creative and unique therefore, a different extension is not perceived as a risk for the consumers.
According to the result and analysis, the researcher here is able to propose several recommendations. At first, the parent company must promote their brand to engage consumers’ awareness toward the original brand by having more advertisement, special event and sharing their product’s knowledge. By doing so, people not only recognize the parent’s brand but also have basic product knowledge. This strategy can create stable brand equity of the parent company before it launch a new extension. After having good brand equity, company can start to introduce their brand extension that still coherent with the parent company even though the extensions are not always in the same product category. However, company still need to make people can recognize or feel the original brand. After that, the extended one should also be promoted as well in order to grab people awareness. Another thing that need to be noted too is the parent company need to be aware with the response of the consumers’ innovativeness because by looking up to their behavior, it can impact on which extension is suitable for the company so that they can increase the equity of the parent brand. Moreover, the company needs to strengthen their relationship with the consumers by building trust such as providing a responsive customer services for complains and etc.
Meanwhile, there are specific recommendations for Trans Corp in order to strengthen their brand equity. Firstly, they need to focus more on the consumers’ needs because based on the result above; consumer innovation has the highest score in impacting the brand equity as individually. Since Trans Corp is in the television broadcasting industry; they need to be very creative and unique not only on their programs but also on their brand extension. Besides they also need to focus on the similarity and reputation because the more similar between the extension and the parent brand, people can give more positive evaluation towards the brand equity of the parent brand. Therefore, when Trans Corp is able to make a new extension and has relation concept with Trans Corp’s image, this would be better in increasing the brand equity of Trans Corp itself. On the other hand, the better reputation of the extension and the parent brand can increase the brand equity as well. Therefore, the brand extension should be able to provide at least the same standard with Trans Corp, so that the reputation of the extension itself can support the equity of the parent company.
In this research, the researcher already try to give the best result, however, limitations cannot be avoided. The accuracy of the respondents to answer the questionnaire is also not absolute. Therefore, there are 11 questionnaires out of 200 questionnaires that are excluded due to incomplete data or bias answers.
In order to decrease the limitations of the research that stated above, there are some suggestions that provided by the researcher.
66 familiarity. According to (Matarid, Youssef, & Alsoud, 2014), familiarity has a significant impact on the brand equity of the parent brand. Secondly, if the researcher would like to spread the questionnaire in Indonesia, it would be better if the researcher check the translation to an expert.
REFERENCES
Aaker, D. (1990, July 15). Brand Extensions: The Good, the Bad, and the Ugly.
Aaker, D. (1991). Managing Brand Equity, The Free Press, New York, NY.
Aaker, D., & Keller, K. (1990). Consumer Evaluations of Brnad Extensions. Journal of Marketing , 54, 27-41. Anwar, H., & Zulmi, A. (2013). Pengaruh Perluasan Merek (Brand Extension) terhadap Ekuitas Merek (Brand Equity) Kecap ABC di Bandar Lampung.
Barrett, J., Lye, A., & Venkateswarlu, P. (1999). Consumer Perceptions of Brand Extensions: Generalising Aaker & Keller’s Model. Retrieved February 12,
2015, from
http://www.empgens.com/resources/ConsumerPerc eptions.pdf
BPS. (2013). Perkiraan Penduduk Beberapa Negara (juta), 2000-2013. (B. P. Indonesia), Producer) Retrieved from
http://www.bps.go.id/linkTabelStatis/view/id/1284 Clarisa, S. (2014, June 26). Tantangan Kreatif di Industri
Pertelevisian. (I. Kreatif, Producer) Retrieved May
8, 2015, from
http://news.indonesiakreatif.net/televisi/
Cooper, D. R., & Schindler, P. S. (2014). Business Research Methods (12 ed.). New York, USA: McGraw-Hill .
G2MI. (2009). Indonesia - Television broadcasting. Retrieved February 24, 2015, from http://g2mi.com: http://g2mi.com/country_sector_info.php?sectorNa me=Television%20broadcasting&countryName=In donesia&id=141
Ghozali, I. (2013). Aplikasi Analisis Multivariate dengan PRogram IBM SPSS 21 Up Date PLS Regresi (7 ed.). Semarang, Indonesia: Universitas Diponegoro. Indonesia2014. (2013, October 7). Dari Bisnis Menuju
Politik? Retrieved February 24, 2015, from
http://www.indonesia- 2014.com/read/2013/10/07/dari-bisnis-menuju-politik#.VOxKt76RifQ
Hem, D. L., Chernatony, L. d., & Iversen, N. M. (2001, September). Factors influencing successful brand extensions. Journal of Marketing Management . Jia, C. S., & Jing, G. (2012, May 31). The Analysis of
Challenges and Opportunities in Brand Extension , 10.
Jr, F. E., & Keller, K. L. (2004). A roadmap for branding in industrial markets. 2 (5), 393.
Kushwaha, D. T. (2012). Brand Extension: A Strategy for Competitive Advantage. V, 21.
Keller, K. l. (1993). Conceptualizing, Measuring, and Managing Customer-Based Brand equity. Journal of Marketing , 57, 1-22.
Keller, K. L. (1998). Strategic Brand Management: Building, Measuring, and Managing Brand Equity. Pretince Hall.
Kim, C. K., & Lavack, A. M. (1996). Vertical brand extensions: current research and managerial implications. Journal of Product & Brand Management , 5, 24-26.
Kim, C. K., Lavack, A. M., & Smith, M. (2001). Consumer Evaluation of Vertical Brand Extensions and Core Brands.
Khan, M. M., & Rahman, M. H. (3009). Factors Contributing towards Successful Brand Extension. ASA University Review , 3.
Leahy, R. (2008). Brand Loyalty in Fast Moving Consumer Good Markets: The Role of Bonds. International Journal of Business and Management , 3.
Lee, G. C., & Leh, F. C. (2011). Dimensions of Customer-Based Brand Equity: A Study on Malaysian Brands . Journal of Marketing Research and Case Studies , 2011
Low, G. S., & Jr, C. W. (2000 ). The measurement and dimensionality of brand associations. Journal of Product & Brand Management , 9, 350-368. Macdonald, E. K., & Sharp, B. M. (2000). Brand
Awareness Effects on Consumer Decision Making for a Common, Repeat Purchase Product: A Replication. Journal of Business Research , 48, 5-15.
Martínez, E., & Chernatony, L. d. (2004). The effect of brand extension strategies upon brand image. Journal of Consumer Marketing , 21 (1), 39-50. Matarid, N. M., Youssef, M. A., & Alsoud, G. A. (2014).
The Impact of Brand Extension Strategy on the Brand Equity of Fast Moving Consumer Goods (FMCG) in Egypt.
Mitchell, V.-W. (1999). Consumer perceived risk: conceptualisations and models . European Journal of Marketing , 33.
Moisescu, O. I. (2006). A Conceptual Analysis of Brand Loyalty as Core Dimension of Brand Equity . Park, J.-W., Kim, K.-H., & Kim, J. (2002). Acceptance of
Brand Extensions: Interactive Influences of Product Category Similarity, Typicality of Claimed Benefits, and Brand Relationship Quality. Journal of Consumer Research , 29, 190-198.
Pitta, D. A., & Katsanis, L. P. (1995). Understanding brand equity for successful brand extension. Journal of Consumer Marketing , 12, 51-64.
Priyatno, D. (2014). SPSS 22 Pengolah Data Terpraktis. Yogyakarta, Indonesia: Andi Offset.
Ruyter, K. d., & Wetzels, M. (2000). The role of corporate image and extension similarity in service brand extensions. Journal of Economic Psychology , 21. Ruslina, S. (2012, October 12). Chairal Tanjung: Motor
http://swa.co.id/ceo-67 interview/chairal-tanjung-motor-kreativitas-trans-corp
Redwing. (2014, May 24). Indonesian media market – growth opportunities abound. Retrieved February 24, 2015, from http://redwing-asia.com/:
http://redwing-asia.com/market-data- posts/indonesian-media-market-growth-opportunities-abound/
Redwing. (2012-2014). Indonesia's US$10 Billion Media Market. Retrieved February 24, 2015, from http://redwing-asia.com: http://redwing-asia.com/market-data/market-data-media/
Rofiq, N. B. (2013, November 28). Orang Indonesia 94 Persen SukaNonton TV, 24 Persen Pilih NontonSinetron. (akarpadinews, Producer)
Retrieved April 2, 2015, from
http://akarpadinews.com/read/hiburan/orang- indonesia-94-persen-sukanonton-tv-24-persen-pilih-nontonsinetron
Sekaran, U. (2003). Research Methods for Business (4 ed.). USA: John Wiley & Sons, Inc.
Solomon, M., & Stuart, E. (2002). Marketing: Real People, Real Choice (2 ed.). Englewood Cliffs, New Jersey, USA: Prentice-Hall.
Statista. (2015). Revenue of the TV industry in Indonesia in 2012 and 2017, by source. Retrieved February 24,
2015, from www.statista.com:
http://www.statista.com/statistics/243882/revenue-of-the-tv-industry-in-indonesia-by-source/
Steenkamp, J.-B. E., Hofstede, F. t., & Wedel, M. (1999). A cross-national investigation into the individual and national cultural antecedents of consumer innovativeness. Journal of Marketing , 63, 55-69. Tabachnick, B.G., & Fidell, L.S. (2007). Using Multivariate
Statistics, Fifth Edition. Boston: Pearson Education, Inc.
Taylor, D. (2011, September 27). Brand Stretch. 3. Tong, X. and Hawley, J.M. (2009). Measuring
customer-based brand equity: Empirical evidence from the sportswear market in China. Journal of Product & Brand Management. 18(4), 262-271.
(Trans Studio Bandung) Retrieved March 4, 2015, from
Trans Studio Bandung:
http://www.transstudiobandung.com/english/index. php (2013).
(TransTV) Retrieved March 4, 2015, from www.transtv.co.id: http://www.transtv.co.id (2015). (Trans7) Retrieved March 4, 2015, from trans7:
http://www.trans7.co.id
Verma Harsh V., Brand Management. Excel Books. New Delhi. 2002.
Völckner & Sattler, F. &. (2006). Drivers of Brand Extension Success. 70, 18.
Wibowo, A. E. (2012). Aplikasi Praktis SPSS dalam Penelitian (1 ed.). Yogyakarta, Indonesia: Gava Media.
Wood, L. (2000). Brands and brand equity: definition and management. 662-669.
Yoo, B., & Donthu, N. (2001). Developing and validating a multidimensional consumer-based brand equity scale. Journal of Business Research , 52, 1-14. (2011).