UGANDA
TANZANIA
-Budongo
— 100 km — 0 o
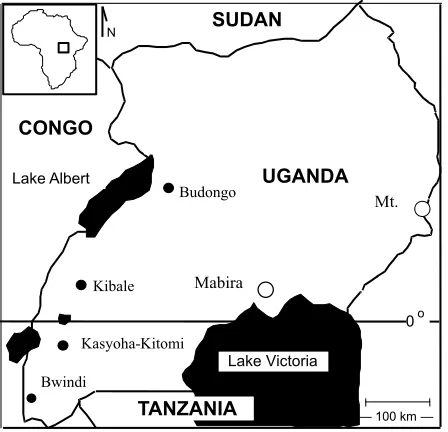
[image:5.612.193.417.79.295.2]CONGO Bwindi Kasyoha Kitomi Kibale Lake Victoria SUDAN N Lake Albert Mabira Mt.
Figure 1. Outline map of Uganda. Black dots show the forests of the Albertine Rift
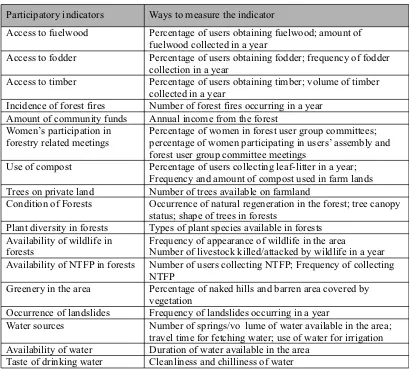
Participatory indicators Ways to measure the indicator
Access to fuelwood Percentage of users obtaining fuelwood; amount of fuelwood collected in a year
Access to fodder Percentage of users obtaining fodder; frequency of fodder collection in a year
Access to timber Percentage of users obtaining timber; volume of timber collected in a year
Incidence of forest fires Number of forest fires occurring in a year Amount of community funds Annual income from the forest
Women’s participation in forestry related meetings
Percentage of women in forest user group committees; percentage of women participating in users’ assembly and forest user group committee meetings
Use of compost Percentage of users collecting leaf-litter in a year; Frequency and amount of compost used in farm lands Trees on private land Number of trees available on farmland
Condition of Forests Occurrence of natural regeneration in the forest; tree canopy status; shape of trees in forests
Plant diversity in forests Types of plant species available in forests Availability of wildlife in
forests
Frequency of appearance of wildlife in the area
Number of livestock killed/attacked by wildlife in a year Availability of NTFP in forests Number of users collecting NTFP; Frequency of collecting
NTFP
Greenery in the area Percentage of naked hills and barren area covered by vegetation
Occurrence of landslides Frequency of landslides occurring in a year
Water sources Number of springs/vo lume of water available in the area; travel time for fetching water; use of water for irrigation Availability of water Duration of water available in the area
[image:6.612.101.510.350.720.2]Taste of drinking water Cleanliness and chilliness of water Table 1. Indicators and ways to measure the indicators
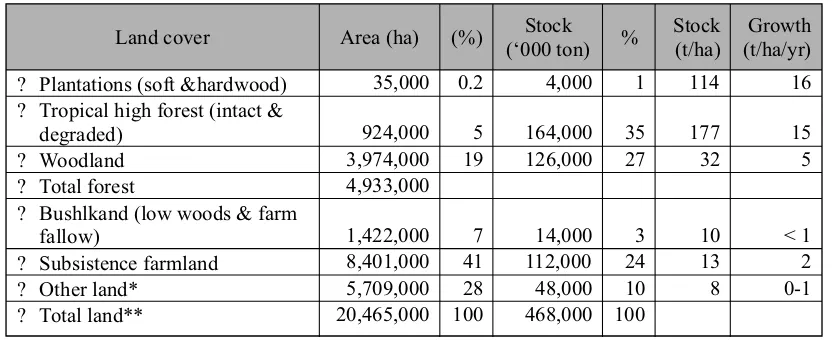
Land cover Area (ha) (%) Stock (‘000 ton) %
Stock (t/ha)
Growth (t/ha/yr)
? Plantations (soft &hardwood) 35,000 0.2 4,000 1 114 16
? Tropical high forest (intact &
degraded) 924,000 5 164,000 35 177 15
? Woodland 3,974,000 19 126,000 27 32 5
? Total forest 4,933,000
? Bushlkand (low woods & farm
fallow) 1,422,000 7 14,000 3 10 < 1
? Subsistence farmland 8,401,000 41 112,000 24 13 2
? Other land* 5,709,000 28 48,000 10 8 0-1
[image:8.612.99.515.532.702.2]? Total land** 20,465,000 100 468,000 100
Table 2. The annual growth of each type of forest
* Grasslands, wetlands, commercial mono-crop (tea, sugar, tobacco), built up areas, rock ** Excluded water bodies of 3.69m ha. Source: MWLE (2001b).
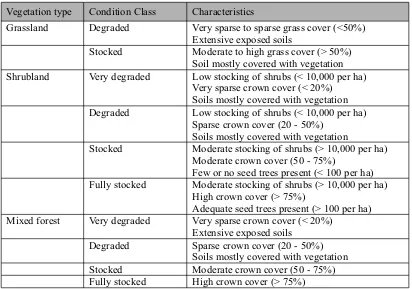
Vegetation type Condition Class Characteristics
Grassland Degraded Very sparse to sparse grass cover (<50%) Extensive exposed soils
Stocked Moderate to high grass cover (> 50%) Soil mostly covered with vegetation Shrubland Very degraded Low stocking of shrubs (< 10,000 per ha)
Very sparse crown cover (< 20%) Soils mostly covered with vegetation Degraded Low stocking of shrubs (< 10,000 per ha)
Sparse crown cover (20 - 50%) Soils mostly covered with vegetation
Stocked Moderate stocking of shrubs (> 10,000 per ha) Moderate crown cover (50 - 75%)
Few or no seed trees present (< 100 per ha) Fully stocked Moderate stocking of shrubs (> 10,000 per ha)
High crown cover (> 75%)
Adequate seed trees present (> 100 per ha) Mixed forest Very degraded Very sparse crown cover (< 20%)
Extensive exposed soils Degraded Sparse crown cover (20 - 50%)
Soils mostly covered with vegetation Stocked Moderate crown cover (50 - 75%) Fully stocked High crown cover (> 75%)
[image:10.612.101.513.419.708.2]Note: Adapted from Howard & Davenport 1996.