TABLES
Table 1. Comparison of calculated and measured distances of tetrabromocavitand 4a.
distance* Å X-ray26 MNDO PM3 AM1
Br-Br (a) 9.58 9.80 9.62 9.60
C-C (b) 7.92 8.00 7.80 7.87
C-C (c) 5.24 5.37 5.25 5.24
H-H (d) 4.28 4.33 4.20 4.21
Me-Me (e) 7.18 7.41 7.13 7.16
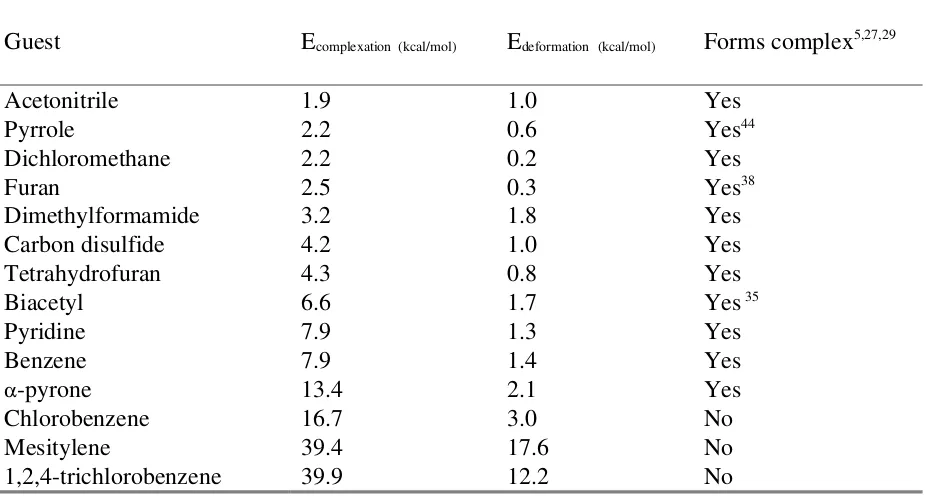
Table 2. Guest incarceration in the methylene bridged hemicarcerand 1a.
Guest Ecomplexation (kcal/mol)
Edeformation (kcal/mol) Forms complex5,27,29
Acetonitrile 1.9 1.0 Yes
Pyrrole 2.2 0.6 Yes44
Dichloromethane 2.2 0.2 Yes
Furan 2.5 0.3 Yes38
Dimethylformamide 3.2 1.8 Yes
Carbon disulfide 4.2 1.0 Yes
Tetrahydrofuran 4.3 0.8 Yes
Biacetyl 6.6 1.7 Yes 35
Pyridine 7.9 1.3 Yes
Benzene 7.9 1.4 Yes
-pyrone 13.4 2.1 Yes
Chlorobenzene 16.7 3.0 No
Mesitylene 39.4 17.6 No
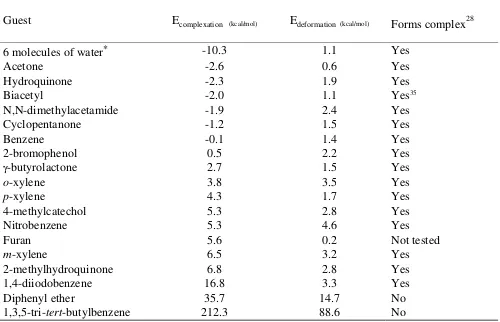
Table 3. Guest incarceration in the butane bridged hemicarcerand 2a.
Guest Ecomplexation (kcal/mol) Edeformation (kcal/mol) Forms complex28
6 molecules of water* -10.3 1.1 Yes
Acetone -2.6 0.6 Yes
Hydroquinone -2.3 1.9 Yes
Biacetyl -2.0 1.1 Yes35
N,N-dimethylacetamide -1.9 2.4 Yes
Cyclopentanone -1.2 1.5 Yes
Benzene -0.1 1.4 Yes
2-bromophenol 0.5 2.2 Yes
-butyrolactone 2.7 1.5 Yes
o-xylene 3.8 3.5 Yes
p-xylene 4.3 1.7 Yes
4-methylcatechol 5.3 2.8 Yes
Nitrobenzene 5.3 4.6 Yes
Furan 5.6 0.2 Not tested
m-xylene 6.5 3.2 Yes
2-methylhydroquinone 6.8 2.8 Yes
1,4-diiodobenzene 16.8 3.3 Yes
Diphenyl ether 35.7 14.7 No
1,3,5-tri-tert-butylbenzene 212.3 88.6 No
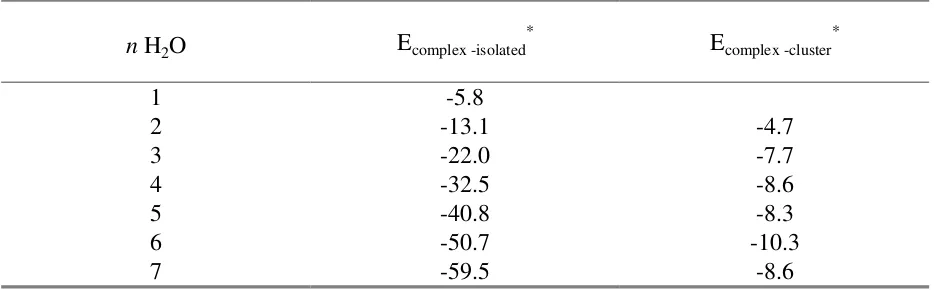
Table 4. Stepwise incarceration of water in the butane bridged hemicarcerand 2a.
n H2O Ecomplex -isolated* Ecomplex -cluster*
1 -5.8
2 -13.1 -4.7
3 -22.0 -7.7
4 -32.5 -8.6
5 -40.8 -8.3
6 -50.7 -10.3
7 -59.5 -8.6
* Ecomplex-isolated = E2a.nH2O - (E2a + n x EH2O); Ecomplex-cluster = E2a.nH2O - (E2a + EnH2O)
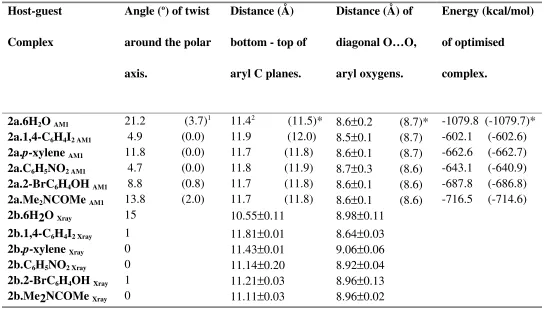
Table 5. Comparison of structural parameters of AM1 optimized 2a.guest structures with
reported X-ray data for 2b.guest.28
Host-guest
1 Values in brackets are for the optimized hemicarceplex obtained by starting with the no-twist pseudo-D
4h
symmetry conformation of host 2a.
List of Figure Captions.
Figure 1. Tetrabromocavitand 4a.
(a) AM1 optimized structure of 4a.
(b) Schematic diagram defining inter-atomic distances in 4a.
Figure 2. Cartoon representation of the bridge conformations in hemicarcerand 1a.
Figure 3. AM1 optimized structure of 1a.furan.
Figure 4. AM1 HOMOs of (a) 1a.pyrrole (E –8.99eV) and (b) pyrrole (E –8.66eV).
Figure 5. Structures of 5a.pyrazine (a) AM1, (b) X-ray
Figure 6. Bonding Orbital (255a) of 5a.pyrazine (X-ray geometry) illustrating host-guest interactions.
Figure 8. AM1 optimized structure of 2a.6H2O (Encapsulated H2O atoms shaded black).
Figure 9. Cartoon representation of the two different orientational pathways for reaction
of 1a with furan.
Figure 10. Energy diagram for the reaction of 1a with furan – routes 1 and 2. Relative energies (kcal/mol) are indicated on the plot.
Figure 11. Stereoview of the AM1 structure of a pseudo transition state for 1a.furan-TS*-out - (route 1).
Figure 12. Two AM1conformations of 1a.dmf - (For clarity, structures of each
conformation show only heavy atoms and the side inter-hemispheric bridges are hidden).
(a) 1a.dmf-i (b) 1a.dmf-ii
Figure 13. Energy diagram for the reaction of 1a with dmf – routes 1 and 2. Relative energies (kcal/mol) are indicated on the plot.