“JOINTLY PERIODIC POINTS IN CELLULAR AUTOMATA: COMPUTER EXPLORATIONS AND CONJECTURES”
MIKE BOYLE AND BRYANT LEE
These are tables supplementary to our Experimental Mathematics paper “Jointly periodic points in cellular automata: computer explorations and conjectures”. The tables are explained in that paper.
The tables are organized in four groups:
• Tables of some span 4 and 5 c.a. (Tables 1-2) • FDense Tables (Tables 3-7)
• FPeriod Tables (Tables 8-24) • FProbPeriod Tables (Tables 25-33)
In the tables, decimal output data are approximated by truncation; e.g., 1.429 becomes 1.42 rather than 1.43.
Map Tabular rule Map Tabular rule 1 0000 1111 0010 1101 17 0011 1001 1100 1100 2 0000 1111 0100 1011 18 0011 1010 0011 1100 3 0001 1100 0011 1110 19 0011 1010 1100 0011 4 0001 1110 0101 1010 20 0011 1100 0101 0011 5 0010 1001 0110 1101 21 0011 1100 0101 1100 6 0010 1101 0000 1111 22 0011 1100 1010 0011 7 0011 0011 0110 0011 23 0011 1100 1010 1100 8 0011 0011 0110 1100 24 0011 1110 0001 1100 9 0011 0011 1001 0011 25 0100 1001 0110 1011 10 0011 0011 1001 1100 26 0100 1011 0000 1111 11 0011 0101 0011 1100 27 0101 1010 0001 1110 12 0011 0101 1100 0011 28 0101 1010 0111 1000 13 0011 0110 0011 0011 29 0110 1011 0100 1001 14 0011 0110 1100 1100 30 0110 1101 0010 1001 15 0011 1000 0111 1100 31 0111 1000 0101 1010 16 0011 1001 0011 0011 32 0111 1100 0011 1000
Table 1. The 32 span 4 onto c.a. of the 2 shift which fix. . .000. . .
and are not linear in an end variable [Hedlund-Appel-Welch1963, Table I]. Maps 2, 6, 7 and 16 are one-to-one. The rule above for map 30 corrects a misprint in [Hedlund-Appel-Welch1963, Table I].
Map Tabular rule Map Tabular rule
[image:2.595.174.441.137.354.2]1 0001 0111 1110 1000 0001 0111 1111 0000 14 0100 1101 1111 0000 0100 1101 1011 0010 2 0001 1011 0111 0100 1110 0100 1111 0000 15 0110 0001 1010 1011 0110 0001 0110 0111 3 0010 0010 1111 0011 0010 1110 0000 1111 16 0110 1000 0111 1001 0110 0001 1110 1001 4 0010 1001 0110 1101 0100 1001 0110 1011 17 0110 1011 1100 0010 0100 1011 0001 1101 5 0010 1110 0000 1111 0010 1110 1111 0000 18 0111 0001 1011 0010 0111 0001 1000 1110 6 0100 0111 0001 0111 1011 1000 0000 1111 19 0111 0010 1011 0100 0111 0010 0111 1000 7 0100 0111 0100 1011 1000 1011 0100 1011 20 0111 1000 0100 1011 0111 1000 0111 1000 8 0100 1011 1000 0111 0100 1011 0100 1011 21 0111 1000 0100 1011 0111 1000 1011 0100 9 0100 1101 1011 0010 1000 1110 1011 0010 22 0111 1000 0100 1011 0111 1000 1111 0000 10 0100 1101 1011 0010 1100 1100 1011 0010 23 0111 1000 0100 1101 0111 1000 1000 1110 11 0100 1101 1101 0010 0011 0011 1101 0010 24 0111 1011 1000 0100 0100 1011 0000 1111 12 0100 1101 1101 0010 0111 0001 1101 0010 25 0111 1011 1100 0000 0100 1011 0000 1111 13 0100 1101 1101 0010 1111 0000 1101 0010 26 0111 1011 1100 0000 0100 1011 0100 1011
2. FDense Tables
Map 10-dense at 13-dense at Map 10-dense at 13-dense at 1 11-24 13-24 17 17,18,20-24 24 2 10-24 13-24 18 17,19-24 23-24
3 18-24 24 19 19-24 23-24
4 21-24 (27) 20 17,19-23 (25)
5 17,19-23 (25 21 19-24 23-24
6 10-24 13-24 22 19-24 23-24
7 10-24 13-24 23 19-24 21-22
8 21-24 (27) 24 17,19-24 23-24
9 11-24 13-24 25 17,19-23 (25)
10 19,21-24 24 26 11-24 13-24
11 18-24 24 27 19, 21-24 24
12 17,19-23 (25) 28 22-24 (25)
13 11-24 13-24 29 19-24 23-24
14 22-24 (25) 30 19-24 23-24
15 19-24 23-24 31 17,18,20-24 24
[image:3.595.156.457.130.354.2]16 10-24 13-24 32 19-24 21-22
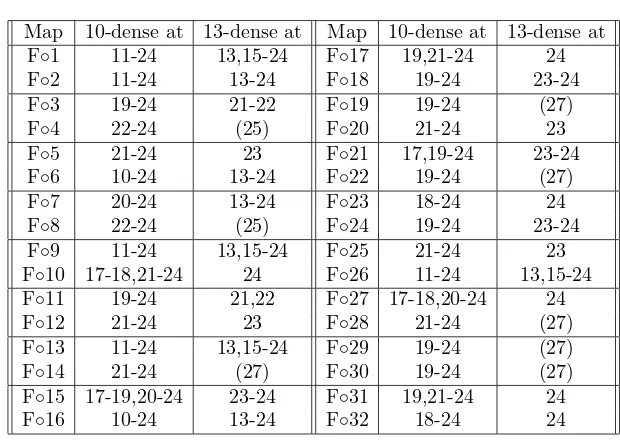
Table 3. The map numbers refer to the 32 span 4 maps of Table 1. Table 3 shows for the given sample of maps, and for m = 10 andm = 13, for whichk in the range [m,24] the jointly periodic points inPk(S2) arem-dense. If the map is notm-dense for anyk
in this range, then the number listed in parentheses is the smallest
F◦1 11-24 13,15-24 F◦17 19,21-24 24 F◦2 11-24 13-24 F◦18 19-24 23-24
F◦3 19-24 21-22 F◦19 19-24 (27)
F◦4 22-24 (25) F◦20 21-24 23
F◦5 21-24 23 F◦21 17,19-24 23-24
F◦6 10-24 13-24 F◦22 19-24 (27)
F◦7 20-24 13-24 F◦23 18-24 24
F◦8 22-24 (25) F◦24 19-24 23-24
F◦9 11-24 13,15-24 F◦25 21-24 23 F◦10 17-18,21-24 24 F◦26 11-24 13,15-24 F◦11 19-24 21,22 F◦27 17-18,20-24 24
F◦12 21-24 23 F◦28 21-24 (27)
F◦13 11-24 13,15-24 F◦29 19-24 (27)
F◦14 21-24 (27) F◦30 19-24 (27)
F◦15 17-19,20-24 23-24 F◦31 19,21-24 24
[image:4.595.149.459.108.328.2]F◦16 10-24 13-24 F◦32 18-24 24
Table 4. The map numbers refer to the 32 span 4 maps of Table 1. F is the involution F = x0+ 1. Table 4 shows for the given
sample of maps, and form = 10 and m= 13, for which kin the range [m,24] the jointly periodic points in Pk(S2)m-dense. If the
Map 10-dense at Map 10-dense at Map 10-dense at Map 10-dense at F◦1 11-24 F◦17 19,21-24 D◦1 20-24 D◦17 21-24 F◦2 11-24 F◦18 19-24 D◦2 19,22-24 D◦18 21-24 F◦3 19-24 F◦19 19-24 D◦3 20-24 D◦19 22-24 F◦4 22-24 F◦20 21-24 D◦4 21,23-24 D◦20 20,24 F◦5 21-24 F◦21 17,19-24 D◦5 20,24 D◦21 21,23-24 F◦6 10-24 F◦22 19-24 D◦6 20,22,24 D◦22 24 F◦7 20-24 F◦23 18-24 D◦7 19,22-24 D◦23 21-24 F◦8 22-24 F◦24 19-24 D◦8 21,23-24 D◦24 21-24 F◦9 11-24 F◦25 21-24 D◦9 22-24 D◦25 22-24 F◦10 17-18,21-24 F◦26 11-24 D◦10 21,23-24 D◦26 22-24 F◦11 19-24 F◦27 17-18,20-24 D◦11 22-24 D◦27 21,23-24 F◦12 21-24 F◦28 21-24 D◦12 20-21,23-24 D◦28 22-24 F◦13 11-24 F◦29 19-24 D◦13 20-24 D◦29 22-24 F◦14 21-24 F◦30 19-24 D◦14 22-24 D◦30 24 F◦15 17-19,20-24 F◦31 19,21-24 D◦15 21,23-24 D◦31 21-24 F◦16 10-24 F◦32 18-24 D◦16 20,22,24 D◦32 21-24
Table 5. The c.a. listed are compositions, e.g. D◦j is mapj
followed byD. The map numbersj refer to the 32 span 4 maps of Table 1. The mapD is given byx0+x1. The map F is the flip
involutionF= 1 +x0. The data onF◦jare copied in from Table
4 for contrast withD◦j.
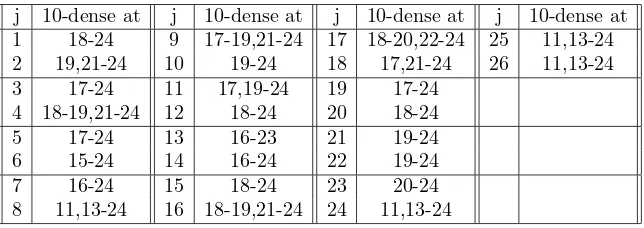
j 10-dense at j 10-dense at j 10-dense at j 10-dense at 1 18-24 9 17-19,21-24 17 18-20,22-24 25 11,13-24 2 19,21-24 10 19-24 18 17,21-24 26 11,13-24 3 17-24 11 17,19-24 19 17-24
4 18-19,21-24 12 18-24 20 18-24 5 17-24 13 16-23 21 19-24 6 15-24 14 16-24 22 19-24 7 16-24 15 18-24 23 20-24 8 11,13-24 16 18-19,21-24 24 11,13-24
1 20-24 9 22-23 17 21,24 25 20,23-24 2 18-24 10 21,24 18 22,24 26 19,22-24 3 20,22-24 11 21-24 19 23,24 27 21,24 4 21,23-24 12 21-24 20 22-24 28 21,23-24 5 21,23-24 13 21-24 21 22,24 29 20,22-23 6 19-24 14 21-24 22 23,24 30 19-24 7 20,22-24 15 21-24 23 21-24 31 21,24 8 21-24 16 20-21,23 24 21-24 32 20,22-24
Table 7. As in Table 5, the map numbers refer to the 32 span 4 maps of Table 1. For such a mapj, letpj(x0, x1, x2, x3) be the
poly-nomial such that (jx)0=pj(x0, x1, x2, x3). Then a rowj of Table
7 refers to the mapfj such that (fjx)0 =x0+pj(x1, x2, x3, x4).
Equivalently,fj =x0+ (j◦S2). For the mapfj, allkin the range
[10,24] at whichfj is 10-dense are listed.
3. FPeriod Tables
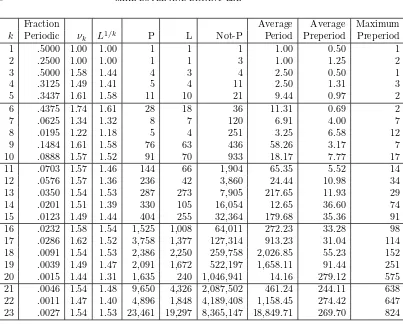
Output obtained from the FPeriod Program, discussed in Section 6 (Section FPeriod) , is compiled in the Tables below. In Tables 8-16, for a c.a. f, the numbers given for a rowk are computed with respect toPk(SN), the set of points fixed by the shiftSN. Except for Tables 15 and 16, the number of symbolsN is 2. For a given k, Ldenotes the maximum f-period of a point in Pk(SN); P denotes the number of points inPk(SN) which aref-periodic (so,P+ Not-P =Nk); andνk denotesνk(f, SN) =P1/k. In some later tables,νkois used to denote thekth root of the number of points ofleastSn-periodkwhich are periodic for f. The preperiod
of a pointxis the smallest nonnegative integerj such thatfj(x) isf-periodic.
Fraction Average Average Maximum
k Periodic νk L1/k P L Not-P Period Preperiod Preperiod
1 0.500000 1.00 1.00 1 1 1 1.00 0.50 1
2 0.250000 1.00 1.00 1 1 3 1.00 1.25 2
3 0.500000 1.58 1.44 4 3 4 2.50 0.50 1
4 0.062500 1.00 1.00 1 1 15 1.00 3.06 4
5 0.500000 1.74 1.71 16 15 16 14.12 0.50 1
6 0.250000 1.58 1.34 16 6 48 5.12 1.25 2
7 0.500000 1.81 1.32 64 7 64 6.91 0.50 1
8 0.003906 1.00 1.00 1 1 255 1.00 7.00 8
9 0.500000 1.85 1.58 256 63 256 62.05 0.50 1
10 0.250000 1.74 1.40 256 30 768 29.01 1.25 2
11 0.500000 1.87 1.69 1,024 341 1024 340.67 0.50 1
12 0.062500 1.58 1.23 256 12 3840 11.57 3.06 4
13 0.500000 1.89 1.67 4,096 819 4096 818.80 0.50 1 14 0.250000 1.81 1.20 4,096 14 12,288 13.89 1.25 2 15 0.500000 1.90 1.19 16,384 15 16,384 14.99 0.50 1
16 0.000015 1.00 1.00 1 1 65535 1.00 15.00 16
17 0.500000 1.92 1.38 65,536 255 65,536 254.33 0.50 1 18 0.250000 1.85 1.30 65,536 126 196,608 125.73 1.25 2 19 0.500000 1.92 1.62 262,144 9,709 262,144 9708.96 0.50 1 20 0.062500 1.74 1.22 65,536 60 983,040 59.88 3.06 4 21 0.500000 1.93 1.21 1,048,576 63 1,048,576 62.99 0.50 1 22 0.250000 1.87 1.34 1,048,576 682 3,145,728 681.67 1.25 2 23 0.500000 1.94 1.39 4,194,304 2,047 4,194,304 2047.00 0.50 1
Table 8. The c.a. isA=x0+x1on the 2-shift: a linear,
k Periodic νk L P L Not-P Period Preperiod Preperiod
1 .5000 1.00 1.00 1 1 1 1.00 0.50 1
2 .2500 1.00 1.00 1 1 3 1.00 1.25 2
3 .5000 1.58 1.44 4 3 4 2.50 0.50 1
4 .3125 1.49 1.41 5 4 11 2.50 1.31 3
5 .3437 1.61 1.58 11 10 21 9.44 0.97 2
6 .4375 1.74 1.61 28 18 36 11.31 0.69 2
7 .0625 1.34 1.32 8 7 120 6.91 4.00 7
8 .0195 1.22 1.18 5 4 251 3.25 6.58 12
9 .1484 1.61 1.58 76 63 436 58.26 3.17 7
10 .0888 1.57 1.52 91 70 933 18.17 7.77 17
11 .0703 1.57 1.46 144 66 1,904 65.35 5.52 14
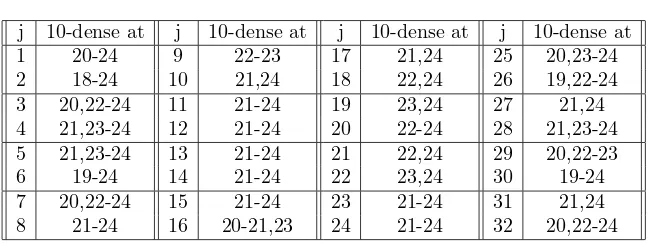
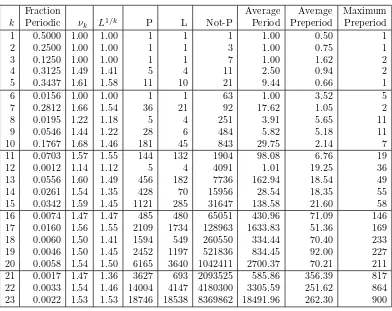
[image:8.595.128.531.101.425.2]12 .0576 1.57 1.36 236 42 3,860 24.44 10.98 34 13 .0350 1.54 1.53 287 273 7,905 217.65 11.93 29 14 .0201 1.51 1.39 330 105 16,054 12.65 36.60 74 15 .0123 1.49 1.44 404 255 32,364 179.68 35.36 91 16 .0232 1.58 1.54 1,525 1,008 64,011 272.23 33.28 98 17 .0286 1.62 1.52 3,758 1,377 127,314 913.23 31.04 114 18 .0091 1.54 1.53 2,386 2,250 259,758 2,026.85 55.23 152 19 .0039 1.49 1.47 2,091 1,672 522,197 1,658.11 91.44 251 20 .0015 1.44 1.31 1,635 240 1,046,941 14.16 279.12 575 21 .0046 1.54 1.48 9,650 4,326 2,087,502 461.24 244.11 638 22 .0011 1.47 1.40 4,896 1,848 4,189,408 1,158.45 274.42 647 23 .0027 1.54 1.53 23,461 19,297 8,365,147 18,849.71 269.70 824
Table 9. The c.a. isJ, the compositionx0+x1 followed by the
Fraction Average Average Maximum
k Periodic νk L1/k P L Not-P Period Preperiod Preperiod
1 0.5000 1.00 1.00 1 1 1 1.00 0.50 1
2 0.2500 1.00 1.00 1 1 3 1.00 0.75 1
3 0.1250 1.00 1.00 1 1 7 1.00 1.62 2
4 0.3125 1.49 1.41 5 4 11 2.50 0.94 2
5 0.3437 1.61 1.58 11 10 21 9.44 0.66 1
6 0.0156 1.00 1.00 1 1 63 1.00 3.52 5
7 0.2812 1.66 1.54 36 21 92 17.62 1.05 2
8 0.0195 1.22 1.18 5 4 251 3.91 5.65 11
9 0.0546 1.44 1.22 28 6 484 5.82 5.18 11
10 0.1767 1.68 1.46 181 45 843 29.75 2.14 7
11 0.0703 1.57 1.55 144 132 1904 98.08 6.76 19
12 0.0012 1.14 1.12 5 4 4091 1.01 19.25 36
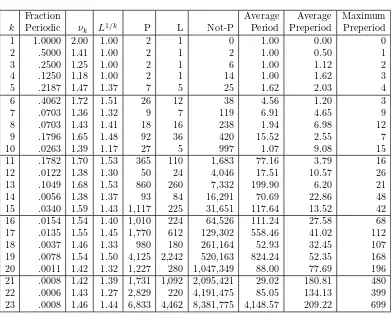
[image:9.595.127.519.114.425.2]13 0.0556 1.60 1.49 456 182 7736 162.94 18.54 49 14 0.0261 1.54 1.35 428 70 15956 28.54 18.35 55 15 0.0342 1.59 1.45 1121 285 31647 138.58 21.60 58 16 0.0074 1.47 1.47 485 480 65051 430.96 71.09 146 17 0.0160 1.56 1.55 2109 1734 128963 1633.83 51.36 169 18 0.0060 1.50 1.41 1594 549 260550 334.44 70.40 233 19 0.0046 1.50 1.45 2452 1197 521836 834.45 92.00 227 20 0.0058 1.54 1.50 6165 3640 1042411 2700.37 70.21 211 21 0.0017 1.47 1.36 3627 693 2093525 585.86 356.39 817 22 0.0033 1.54 1.46 14004 4147 4180300 3305.59 251.62 864 23 0.0022 1.53 1.53 18746 18538 8369862 18491.96 262.30 900
Table 10. The c.a. E is the compositionx0+x1followed byx0+ x1x2, a linear 2-to-1 map followed by a degree 1 left permutative
k Periodic νk L P L Not-P Period Preperiod Preperiod
1 1.0000 2.00 1.00 2 1 0 1.00 0.00 0
2 .5000 1.41 1.00 2 1 2 1.00 0.50 1
3 .2500 1.25 1.00 2 1 6 1.00 1.12 2
4 .1250 1.18 1.00 2 1 14 1.00 1.62 3
5 .2187 1.47 1.37 7 5 25 1.62 2.03 4
6 .4062 1.72 1.51 26 12 38 4.56 1.20 3
7 .0703 1.36 1.32 9 7 119 6.91 4.65 9
8 .0703 1.43 1.41 18 16 238 1.94 6.98 12
9 .1796 1.65 1.48 92 36 420 15.52 2.55 7
10 .0263 1.39 1.17 27 5 997 1.07 9.08 15
[image:10.595.127.518.109.426.2]11 .1782 1.70 1.53 365 110 1,683 77.16 3.79 16 12 .0122 1.38 1.30 50 24 4,046 17.51 10.57 26 13 .1049 1.68 1.53 860 260 7,332 199.90 6.20 21 14 .0056 1.38 1.37 93 84 16,291 70.69 22.86 48 15 .0340 1.59 1.43 1,117 225 31,651 117.64 13.52 42 16 .0154 1.54 1.40 1,010 224 64,526 111.24 27.58 68 17 .0135 1.55 1.45 1,770 612 129,302 558.46 41.02 112 18 .0037 1.46 1.33 980 180 261,164 52.93 32.45 107 19 .0078 1.54 1.50 4,125 2,242 520,163 824.24 52.35 168 20 .0011 1.42 1.32 1,227 280 1,047,349 88.00 77.69 196 21 .0008 1.42 1.39 1,731 1,092 2,095,421 29.02 180.81 480 22 .0006 1.43 1.27 2,829 220 4,191,475 85.05 134.13 399 23 .0008 1.46 1.44 6,833 4,462 8,381,775 4,148.57 209.22 699
Table 11. The c.a. isG=x−1+x0x1+x2, which is bipermutative
Fraction Average Average Maximum
k Periodic νk L1/k P L Not-P Period Preperiod Preperiod
1 0.500000 1.00 1.00 1 1 1 1.00 0.50 1.00
2 0.750000 1.73 1.00 3 1 1 1.00 0.25 1.00
3 0.500000 1.58 1.00 4 1 4 1.00 0.88 2.00
4 0.687500 1.82 1.41 11 4 5 2.50 0.31 1.00
5 0.812500 1.91 1.71 26 15 6 9.75 0.19 1.00
6 0.281250 1.61 1.00 18 1 46 1.00 3.95 8.00
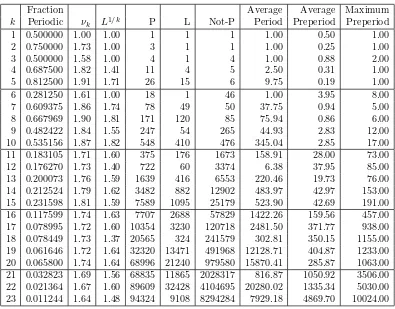
[image:11.595.126.521.115.424.2]7 0.609375 1.86 1.74 78 49 50 37.75 0.94 5.00 8 0.667969 1.90 1.81 171 120 85 75.94 0.86 6.00 9 0.482422 1.84 1.55 247 54 265 44.93 2.83 12.00 10 0.535156 1.87 1.82 548 410 476 345.04 2.85 17.00 11 0.183105 1.71 1.60 375 176 1673 158.91 28.00 73.00 12 0.176270 1.73 1.40 722 60 3374 6.38 37.95 85.00 13 0.200073 1.76 1.59 1639 416 6553 220.46 19.73 76.00 14 0.212524 1.79 1.62 3482 882 12902 483.97 42.97 153.00 15 0.231598 1.81 1.59 7589 1095 25179 523.90 42.69 191.00 16 0.117599 1.74 1.63 7707 2688 57829 1422.26 159.56 457.00 17 0.078995 1.72 1.60 10354 3230 120718 2481.50 371.77 938.00 18 0.078449 1.73 1.37 20565 324 241579 302.81 350.15 1155.00 19 0.061646 1.72 1.64 32320 13471 491968 12128.71 404.87 1233.00 20 0.065800 1.74 1.64 68996 21240 979580 15870.41 285.87 1063.00 21 0.032823 1.69 1.56 68835 11865 2028317 816.87 1050.92 3506.00 22 0.021364 1.67 1.60 89609 32428 4104695 20280.02 1335.34 5030.00 23 0.011244 1.64 1.48 94324 9108 8294284 7929.18 4869.70 10024.00
Table 12. The c.a. isB=x0+x1x2 on the 2-shift. B is degree
k Periodic νk L P L Not-P Period Preperiod Preperiod
1 .5000 1.00 1.00 1 1 1 1.00 0.50 1
2 .7500 1.73 1.00 3 1 1 1.00 0.25 1
3 .5000 1.58 1.00 4 1 4 1.00 0.88 2
4 .6875 1.82 1.00 11 1 5 1.00 0.31 1
5 .8125 1.91 1.37 26 5 6 2.56 0.19 1
6 .6562 1.86 1.61 42 18 22 7.38 0.86 4
7 .6093 1.86 1.60 78 28 50 17.35 1.16 5
8 .5117 1.83 1.62 131 48 125 27.50 2.08 10
9 .4296 1.82 1.58 220 63 292 43.61 3.39 11
10 .4082 1.82 1.31 418 15 606 5.45 6.91 21
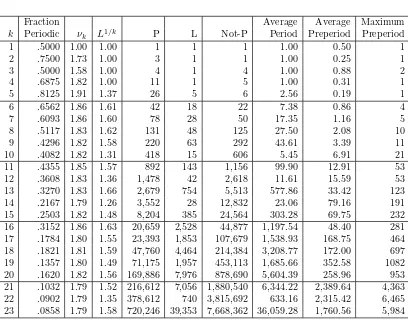
[image:12.595.128.536.103.424.2]11 .4355 1.85 1.57 892 143 1,156 99.90 12.91 53 12 .3608 1.83 1.36 1,478 42 2,618 11.61 15.59 53 13 .3270 1.83 1.66 2,679 754 5,513 577.86 33.42 123 14 .2167 1.79 1.26 3,552 28 12,832 23.06 79.16 191 15 .2503 1.82 1.48 8,204 385 24,564 303.28 69.75 232 16 .3152 1.86 1.63 20,659 2,528 44,877 1,197.54 48.40 281 17 .1784 1.80 1.55 23,393 1,853 107,679 1,538.93 168.75 464 18 .1821 1.81 1.59 47,760 4,464 214,384 3,208.77 172.00 697 19 .1357 1.80 1.49 71,175 1,957 453,113 1,685.66 352.58 1082 20 .1620 1.82 1.56 169,886 7,976 878,690 5,604.39 258.96 953 21 .1032 1.79 1.52 216,612 7,056 1,880,540 6,344.22 2,389.64 4,363 22 .0902 1.79 1.35 378,612 740 3,815,692 633.16 2,315.42 6,465 23 .0858 1.79 1.58 720,246 39,353 7,668,362 36,059.28 1,760.56 5,984
Table 13. The c.a. is K, the composition which is the auto-morphismU of Table 9 followed by the left permutative, not right-closing mapx0+x1x2. The c.a. Kis left closing, not right-closing,
Fraction Average Average Maximum
k Periodic νk L1/k P L Not-P Period Preperiod Preperiod
1 0.500 1.00 1.00 1 1 1 1.00 0.50 1
2 0.750 1.73 1.00 3 1 1 1.00 0.25 1
3 0.500 1.58 1.44 4 3 4 1.75 0.50 1
4 0.687 1.82 1.18 11 2 5 1.75 0.31 1
5 0.812 1.91 1.71 26 15 6 11.00 0.19 1
6 0.468 1.76 1.20 30 3 34 1.66 1.28 3
7 0.500 1.81 1.66 64 35 64 28.34 0.99 4
8 0.667 1.90 1.63 171 52 85 30.39 0.52 3
9 0.306 1.75 1.27 157 9 355 8.89 2.35 8
10 0.261 1.74 1.49 268 55 756 20.18 6.75 18
11 0.387 1.83 1.57 793 143 1255 53.53 3.00 13
12 0.088 1.63 1.16 362 6 3734 1.39 20.61 48
[image:13.595.127.525.115.426.2]13 0.150 1.72 1.63 1236 611 6956 259.75 20.15 78 14 0.126 1.72 1.51 2068 329 14316 119.61 33.22 132 15 0.091 1.70 1.50 3014 465 29754 414.94 44.45 138 16 0.092 1.72 1.50 6043 728 59493 650.33 101.66 282 17 0.107 1.75 1.68 14145 6783 116927 3918.82 48.16 196 18 0.060 1.71 1.58 15753 4095 246391 3406.78 110.78 396 19 0.072 1.74 1.60 38191 7619 486097 6336.19 142.98 406 20 0.038 1.69 1.54 40396 5780 1008180 1691.96 279.69 780 21 0.018 1.65 1.48 37867 4011 2059285 3961.81 705.45 1777 22 0.017 1.66 1.51 75309 9658 4118995 4527.64 605.57 1770 23 0.017 1.67 1.57 144096 34477 8244512 26857.88 1191.56 2687
Table 14. The c.a. isC, the composition x0x1+x2 followed by x0 +x1x2, on the 2-shift. The c.a. C is neither left nor right
k Periodic νk L P L Not-P Period Preperiod Preperiod
1 1.00 3.00 2.00 3 2 0 1.67 0.00 0.00
2 1.00 3.00 2.44 9 6 0 4.56 0.00 0.00
3 1.00 3.00 2.46 27 15 0 9.30 0.00 0.00
4 0.11 1.73 1.56 9 6 72 4.56 0.89 1.00
5 1.00 3.00 2.77 243 165 0 121.13 0.00 0.00
6 1.00 3.00 2.80 729 486 0 334.54 0.00 0.00
7 1.00 3.00 2.57 2187 742 0 401.62 0.00 0.00
8 0.01 1.73 1.58 81 40 6480 33.50 4.24 9.00
[image:14.595.125.534.112.304.2]9 1.00 3.00 2.24 19683 1469 0 1185.85 0.00 0.00 10 1.00 3.00 2.76 59049 25865 0 22737.63 0.00 0.00 11 1.00 3.00 2.92 177147 131857 0 109208.21 0.00 0.00 12 0.00 1.76 1.67 909 486 530532 239.27 45.51 133.00 13 1.00 3.00 2.79 1594323 631605 0 291222.95 0.00 0.00
Table 15. This map on the 3-shift is an automorphism W fol-lowed by the degree 9 linear map x0 +x2, where W = x0 +
2x0x1x1+ 2x0x1+x1∗x1+x1. Let π denote the permutation
on{0,1,2}which transposes 0 and 2. Then (W x)0=x0 ifx16= 1
and (W x)0=π(x0) ifx1= 1.
Fraction Average Average Maximum
k Periodic νk L1/k P L Not-P Period Preperiod Preperiod
1 .3333 1.00 1.00 1 1 2 1.00 1.00 2
2 .5555 2.23 1.00 5 1 4 1.00 0.56 2
3 .2592 1.91 1.00 7 1 20 1.00 1.78 3
4 .2098 2.03 1.00 17 1 64 1.00 3.17 8
5 .4362 2.54 2.09 106 40 137 27.65 1.08 4
6 .2208 2.33 1.51 161 12 568 6.79 2.71 9
7 .0932 2.13 1.66 204 35 1,983 5.89 13.89 38
8 .0391 2.00 1.00 257 1 6,304 1.00 27.02 67
[image:14.595.126.520.404.590.2]9 .1667 2.45 1.60 3,283 72 16,400 48.89 13.41 52 10 .0299 2.11 1.62 1,770 130 57,279 62.67 55.38 163 11 .0224 2.12 1.89 3,972 1122 173,175 593.34 99.23 297 12 .0164 2.13 1.40 8,729 60 522,712 12.56 88.45 222 13 .0076 2.06 1.81 12,117 2366 1,582,206 2,228.50 676.85 1,504
Table 16. The map x0+x1x2 on the 3-shift: still degree 1, left
k 1 2 3 4 5 6 7 8 9 10 11 12 13 1 1.00 1.00 2.00 2.00 1.00 2.00 2.00 2.00 1.00 1.00 1.00 1.00 1.00 2 0.00 0.00 0.00 1.41 1.41 0.00 0.00 0.00 0.00 0.00 0.00 0.00 0.00 3 1.81 1.44 1.81 1.81 0.00 1.44 1.44 1.81 1.81 1.44 1.44 0.00 0.00 4 1.41 0.00 0.00 1.86 0.00 1.41 1.68 0.00 0.00 0.00 1.68 1.68 1.41 5 1.90 1.82 1.90 1.82 1.71 1.97 1.71 1.97 1.90 1.37 1.71 1.71 1.82 6 1.61 0.00 1.51 1.69 0.00 1.69 1.76 1.86 1.81 1.61 1.51 1.61 0.00 7 1.77 1.80 1.80 1.77 1.74 1.88 1.90 1.99 1.45 1.85 1.90 1.70 1.92 8 1.62 1.70 1.75 1.70 1.48 1.72 1.81 1.90 1.80 0.00 1.78 1.72 1.70 9 1.89 1.76 1.74 1.90 1.90 1.91 1.91 1.99 1.79 1.58 1.76 1.77 1.80 10 1.80 1.58 1.25 1.83 1.78 1.81 1.91 1.95 1.67 0.00 1.76 1.68 1.90 11 1.66 1.69 1.75 1.73 1.78 1.85 1.92 1.99 1.67 1.66 1.80 1.51 1.48 12 1.71 1.75 1.78 1.84 1.68 1.85 1.84 1.97 1.77 1.70 1.68 1.73 1.69 13 1.73 1.72 1.79 1.73 1.72 1.87 1.93 2.00 1.72 1.69 1.80 1.75 1.84 14 1.66 1.61 1.73 1.73 1.63 1.81 1.91 1.98 1.57 1.54 1.69 1.68 1.74 15 1.66 1.71 1.60 1.73 1.74 1.85 1.92 1.99 1.78 1.67 1.70 1.68 1.76 16 1.68 1.64 1.74 1.71 1.72 1.79 1.93 1.98 1.54 1.65 1.67 1.49 1.75 17 1.69 1.53 1.73 1.68 1.72 1.84 1.91 2.00 1.73 1.59 1.73 1.65 1.69 18 1.68 1.46 1.69 1.68 1.71 1.83 1.91 1.99 1.65 1.59 1.57 1.65 1.67 19 1.67 1.61 1.68 1.67 1.69 1.81 1.93 2.00 1.71 1.63 1.66 1.71 1.73
Table 17. νo
k(·, S2) for the span five maps 1-13 of Table 2.
k 14 15 16 17 18 19 20 21 22 23 24 25 26
1 1.00 2.00 2.00 2.00 1.00 1.00 1.00 1.00 1.00 1.00 2.00 2.00 2.00 2 0.00 1.41 1.41 0.00 1.41 1.41 0.00 0.00 0.00 0.00 0.00 0.00 0.00 3 1.81 1.44 0.00 1.44 1.44 1.44 0.00 0.00 0.00 0.00 1.81 1.81 1.81 4 0.00 1.68 1.86 0.00 1.41 1.68 0.00 1.41 0.00 1.68 0.00 0.00 0.00 5 1.82 1.82 1.82 1.71 1.71 1.90 1.71 1.58 1.71 1.58 1.97 1.97 1.97 6 1.81 1.86 1.76 1.61 1.51 1.51 0.00 1.69 1.81 1.81 1.69 1.69 1.69 7 1.80 1.85 1.92 1.60 1.70 1.83 1.83 1.54 1.70 1.54 1.99 1.99 1.99 8 1.41 1.83 1.70 1.72 1.83 1.86 1.68 1.68 1.54 1.68 1.81 1.81 1.86 9 1.84 1.84 1.76 1.76 1.71 1.78 1.78 1.74 1.84 1.87 1.99 1.99 1.99 10 1.86 1.85 1.83 1.65 1.76 1.82 1.79 1.52 1.67 1.72 1.90 1.90 1.93 11 1.57 1.78 1.81 1.88 1.81 1.75 1.77 1.64 1.79 1.54 1.99 1.99 1.99 12 1.57 1.83 1.84 1.66 1.64 1.80 1.62 1.73 1.73 1.67 1.94 1.94 1.94 13 1.71 1.71 1.68 1.73 1.72 1.85 1.61 1.78 1.79 1.65 2.00 2.00 2.00 14 1.76 1.73 1.72 1.67 1.66 1.80 1.57 1.73 1.75 1.60 1.95 1.95 1.96 15 1.71 1.76 1.79 1.72 1.77 1.78 1.72 1.65 1.66 1.52 1.99 1.99 1.99 16 1.71 1.71 1.71 1.73 1.69 1.78 1.71 1.51 1.65 1.55 1.97 1.97 1.97 17 1.74 1.66 1.63 1.64 1.71 1.78 1.64 1.65 1.67 1.68 2.00 2.00 2.00 18 1.71 1.68 1.68 1.67 1.62 1.73 1.65 1.61 1.52 1.62 1.98 1.98 1.98 19 1.68 1.69 1.70 1.70 1.63 1.75 1.70 1.66 1.65 1.60 2.00 2.00 2.00
Table 18. νo
[image:15.595.126.507.404.649.2]1 2.00 2.00 1.00 1.00 2.00 2.00 2.00 1.00 2.00 1.00 1.00 2.00 2.00 1.00 1.00 2.00 2 0.00 1.41 0.00 1.41 1.41 1.41 1.41 1.41 0.00 0.00 0.00 1.41 0.00 1.41 1.41 1.41 3 1.81 1.81 1.81 1.44 0.00 1.81 1.81 1.44 1.81 1.44 1.81 0.00 1.81 1.44 1.44 1.81 4 1.68 1.86 1.68 1.41 1.41 1.86 1.86 1.41 1.68 1.41 1.68 1.41 1.68 0.00 1.68 1.86 5 1.97 1.97 1.82 1.90 1.58 1.97 1.97 1.90 1.97 1.82 1.82 1.58 1.97 1.58 1.90 1.97 6 1.90 1.94 1.81 1.61 1.76 1.94 1.94 1.61 1.90 1.34 1.81 1.76 1.90 1.86 1.81 1.94 7 1.99 1.99 1.83 1.70 1.80 1.99 1.99 1.70 1.99 1.74 1.83 1.80 1.99 1.83 1.70 1.99 8 1.95 1.98 1.81 1.48 1.75 1.98 1.98 1.48 1.95 1.78 1.81 1.75 1.95 1.54 1.88 1.98 9 1.99 1.99 1.86 1.68 1.82 1.99 1.99 1.68 1.99 1.82 1.86 1.82 1.99 1.73 1.86 1.99 10 1.98 1.99 1.76 1.70 1.82 1.99 1.99 1.70 1.98 1.75 1.76 1.82 1.98 1.56 1.65 1.99 11 1.99 1.99 1.70 1.65 1.68 1.99 1.99 1.65 1.99 1.89 1.70 1.68 1.99 1.60 1.90 1.99 12 1.99 1.99 1.51 1.65 1.61 1.99 1.99 1.65 1.99 1.65 1.51 1.61 1.99 1.34 1.75 1.99 13 2.00 2.00 1.70 1.57 1.63 2.00 2.00 1.57 2.00 1.73 1.70 1.63 2.00 1.54 1.68 2.00 14 1.99 1.99 1.74 1.65 1.70 1.99 1.99 1.65 1.99 1.81 1.74 1.70 1.99 1.66 1.74 1.99 15 1.99 1.99 1.71 1.68 1.70 1.99 1.99 1.68 1.99 1.73 1.71 1.70 1.99 1.47 1.77 1.99 16 1.99 1.99 1.74 1.67 1.70 1.99 1.99 1.67 1.99 1.76 1.74 1.70 1.99 1.59 1.67 1.99 17 2.00 2.00 1.67 1.53 1.71 2.00 2.00 1.53 2.00 1.75 1.67 1.71 2.00 1.59 1.61 2.00 18 1.99 1.99 1.71 1.56 1.65 1.99 1.99 1.56 1.99 1.71 1.71 1.65 1.99 1.52 1.63 1.99 19 2.00 2.00 1.73 1.54 1.72 2.00 2.00 1.54 2.00 1.77 1.73 1.72 2.00 1.57 1.69 2.00
Table 19. νo
k(·, S2) for the span four maps 1-16 of Table 1.
k F1 F2 F3 F4 F5 F6 F7 F8 F9 F10 F11 F12 F13 F14 F15 F16 1 2.00 2.00 1.00 1.00 2.00 2.00 2.00 1.00 2.00 1.00 1.00 2.00 2.00 1.00 1.00 2.00 2 0.00 1.41 0.00 1.41 1.41 1.41 1.41 1.41 0.00 0.00 0.00 1.41 0.00 1.41 1.41 1.41 3 1.81 1.81 1.81 1.44 1.44 1.81 1.81 1.44 1.81 0.00 1.81 1.44 1.81 1.44 0.00 1.81 4 1.41 1.86 1.68 0.00 1.41 1.86 1.86 0.00 1.41 0.00 1.68 1.41 1.41 1.41 1.68 1.86 5 1.97 1.97 1.82 1.58 1.71 1.97 1.97 1.58 1.97 1.71 1.82 1.71 1.97 1.90 1.90 1.97 6 1.86 1.94 1.69 1.86 1.69 1.94 1.94 1.86 1.86 1.69 1.69 1.69 1.86 1.61 0.00 1.94 7 1.99 1.99 1.66 1.83 1.70 1.99 1.99 1.83 1.99 1.60 1.66 1.70 1.99 1.70 1.92 1.99 8 1.93 1.98 1.81 1.54 1.80 1.98 1.98 1.54 1.93 1.41 1.81 1.80 1.93 1.48 1.75 1.98 9 1.99 1.99 1.71 1.73 1.62 1.99 1.99 1.73 1.99 1.77 1.71 1.62 1.99 1.68 1.68 1.99 10 1.95 1.99 1.70 1.56 1.44 1.99 1.99 1.56 1.95 1.79 1.70 1.44 1.95 1.70 0.00 1.99 11 1.99 1.99 1.74 1.60 1.46 1.99 1.99 1.60 1.99 1.59 1.74 1.46 1.99 1.65 1.65 1.99 12 1.97 1.99 1.65 1.34 1.55 1.99 1.99 1.34 1.97 1.63 1.65 1.55 1.97 1.65 1.69 1.99 13 2.00 2.00 1.75 1.54 1.65 2.00 2.00 1.54 2.00 1.53 1.75 1.65 2.00 1.57 1.67 2.00 14 1.98 1.99 1.74 1.66 1.53 1.99 1.99 1.66 1.98 1.72 1.74 1.53 1.98 1.65 1.51 1.99 15 1.99 1.99 1.74 1.47 1.64 1.99 1.99 1.47 1.99 1.68 1.74 1.64 1.99 1.68 1.74 1.99 16 1.99 1.99 1.66 1.59 1.55 1.99 1.99 1.59 1.99 1.66 1.66 1.55 1.99 1.67 1.68 1.99 17 2.00 2.00 1.67 1.59 1.57 2.00 2.00 1.59 2.00 1.74 1.67 1.57 2.00 1.53 1.69 2.00 18 1.99 1.99 1.63 1.52 1.61 1.99 1.99 1.52 1.99 1.70 1.63 1.61 1.99 1.56 1.61 1.99 19 2.00 2.00 1.69 1.57 1.51 2.00 2.00 1.57 2.00 1.54 1.69 1.51 2.00 1.54 1.63 2.00
Table 20. νo
k(·, S2) for the span 4 maps 1-16 of Table 1,
[image:16.595.132.589.404.648.2]k 17 18 19 20 21 22 23 24 25 26 27 28 29 30 31 32 1 1.00 1.00 2.00 2.00 1.00 2.00 1.00 1.00 2.00 2.00 1.00 1.00 2.00 2.00 1.00 1.00 2 0.00 1.41 0.00 1.41 1.41 0.00 0.00 1.41 1.41 0.00 0.00 1.41 0.00 0.00 0.00 0.00 3 0.00 0.00 0.00 0.00 1.44 0.00 1.81 0.00 0.00 1.81 1.44 1.44 0.00 0.00 0.00 1.81 4 0.00 1.68 1.68 1.41 1.68 1.68 1.68 1.68 1.41 1.68 1.41 0.00 1.68 1.68 0.00 1.68 5 1.71 1.90 1.71 1.58 1.90 1.71 1.82 1.90 1.58 1.97 1.82 1.58 1.71 1.71 1.71 1.82 6 1.69 0.00 1.34 1.76 1.81 1.34 1.69 0.00 1.76 1.90 1.34 1.86 1.34 1.34 1.69 1.69 7 1.60 1.92 1.54 1.80 1.70 1.54 1.66 1.92 1.80 1.99 1.74 1.83 1.54 1.54 1.60 1.66 8 1.41 1.75 1.41 1.75 1.88 1.41 1.81 1.75 1.75 1.95 1.78 1.54 1.41 1.41 1.41 1.81 9 1.77 1.68 1.74 1.82 1.86 1.74 1.71 1.68 1.82 1.99 1.82 1.73 1.74 1.74 1.77 1.71 10 1.79 0.00 1.72 1.82 1.65 1.72 1.70 0.00 1.82 1.98 1.75 1.56 1.72 1.72 1.79 1.70 11 1.59 1.65 1.41 1.68 1.90 1.41 1.74 1.65 1.68 1.99 1.89 1.60 1.41 1.41 1.59 1.74 12 1.63 1.69 1.59 1.61 1.75 1.59 1.65 1.69 1.61 1.99 1.65 1.34 1.59 1.59 1.63 1.65 13 1.53 1.67 1.66 1.63 1.68 1.66 1.75 1.67 1.63 2.00 1.73 1.54 1.66 1.66 1.53 1.75 14 1.72 1.51 1.44 1.70 1.74 1.44 1.74 1.51 1.70 1.99 1.81 1.66 1.44 1.44 1.72 1.74 15 1.68 1.74 1.58 1.70 1.77 1.58 1.74 1.74 1.70 1.99 1.73 1.47 1.58 1.58 1.68 1.74 16 1.66 1.68 1.64 1.70 1.67 1.64 1.66 1.68 1.70 1.99 1.76 1.59 1.64 1.64 1.66 1.66 17 1.74 1.69 1.59 1.71 1.61 1.59 1.67 1.69 1.71 2.00 1.75 1.59 1.59 1.59 1.74 1.67 18 1.70 1.61 1.46 1.65 1.63 1.46 1.63 1.61 1.65 1.99 1.71 1.52 1.46 1.46 1.70 1.63 19 1.54 1.63 1.60 1.72 1.69 1.60 1.69 1.63 1.72 2.00 1.77 1.57 1.60 1.60 1.54 1.69
Table 21. νo
k(·, S2) for the span 4 onto maps 17-32 of Table 1.
k F17 F18 F19 F20 F21 F22 F23 F24 F25 F26 F27 F28 F29 F30 F31 F32 1 1.00 1.00 2.00 2.00 1.00 2.00 1.00 1.00 2.00 2.00 1.00 1.00 2.00 2.00 1.00 1.00 2 0.00 1.41 0.00 1.41 1.41 0.00 0.00 1.41 1.41 0.00 0.00 1.41 0.00 0.00 0.00 0.00 3 1.44 1.44 1.44 1.44 0.00 1.44 1.81 1.44 1.44 1.81 0.00 1.44 1.44 1.44 1.44 1.81 4 1.41 1.68 1.68 1.41 1.68 1.68 1.68 1.68 1.41 1.41 0.00 1.41 1.68 1.68 1.41 1.68 5 1.82 1.90 1.58 1.71 1.90 1.58 1.82 1.90 1.71 1.97 1.71 1.90 1.58 1.58 1.82 1.82 6 1.34 1.81 1.61 1.69 0.00 1.61 1.81 1.81 1.69 1.86 1.69 1.61 1.61 1.61 1.34 1.81 7 1.74 1.70 1.70 1.70 1.92 1.70 1.83 1.70 1.70 1.99 1.60 1.70 1.70 1.70 1.74 1.83 8 1.78 1.88 1.65 1.80 1.75 1.65 1.81 1.88 1.80 1.93 1.41 1.48 1.65 1.65 1.78 1.81 9 1.82 1.86 1.60 1.62 1.68 1.60 1.86 1.86 1.62 1.99 1.77 1.68 1.60 1.60 1.82 1.86 10 1.75 1.65 1.61 1.44 0.00 1.61 1.76 1.65 1.44 1.95 1.79 1.70 1.61 1.61 1.75 1.76 11 1.89 1.90 1.69 1.46 1.65 1.69 1.70 1.90 1.46 1.99 1.59 1.65 1.69 1.69 1.89 1.70 12 1.65 1.75 1.49 1.55 1.69 1.49 1.51 1.75 1.55 1.97 1.63 1.65 1.49 1.49 1.65 1.51 13 1.73 1.68 1.66 1.65 1.67 1.66 1.70 1.68 1.65 2.00 1.53 1.57 1.66 1.66 1.73 1.70 14 1.81 1.74 1.59 1.53 1.51 1.59 1.74 1.74 1.53 1.98 1.72 1.65 1.59 1.59 1.81 1.74 15 1.73 1.77 1.53 1.64 1.74 1.53 1.71 1.77 1.64 1.99 1.68 1.68 1.53 1.53 1.73 1.71 16 1.76 1.67 1.69 1.55 1.68 1.69 1.74 1.67 1.55 1.99 1.66 1.67 1.69 1.69 1.76 1.74 17 1.75 1.61 1.63 1.57 1.69 1.63 1.67 1.61 1.57 2.00 1.74 1.53 1.63 1.63 1.75 1.67 18 1.71 1.63 1.55 1.61 1.61 1.55 1.71 1.63 1.61 1.99 1.70 1.56 1.55 1.55 1.71 1.71 19 1.77 1.69 1.65 1.51 1.63 1.65 1.73 1.69 1.51 2.00 1.54 1.54 1.65 1.65 1.77 1.73
Table 22. νo
k(·, S2) for the span 4 maps 17-32 of Table 1,
[image:17.595.135.586.404.649.2]1 1.00 1.00 2.00 2.00 1.00 1.00 1.00 2.00 1.00 2.00 2.00 1.00 1.00 2.00 2.00 1.00 2 1.41 0.00 1.41 0.00 0.00 0.00 0.00 0.00 1.41 1.41 1.41 0.00 1.41 0.00 0.00 0.00 3 1.44 0.00 1.44 0.00 0.00 1.44 1.44 1.81 0.00 0.00 1.44 1.81 0.00 1.81 1.44 1.44 4 0.00 1.41 1.41 1.68 1.68 0.00 1.86 1.41 0.00 0.00 1.41 1.41 1.41 1.41 1.68 1.86 5 1.37 1.37 1.58 1.71 1.82 1.90 1.37 1.71 1.90 1.71 1.58 1.82 1.37 1.71 1.37 1.90 6 1.51 1.51 1.51 1.34 1.51 1.34 1.34 0.00 0.00 1.51 0.00 1.61 1.34 0.00 1.34 0.00 7 1.74 1.88 1.54 1.60 1.66 1.60 1.77 1.54 1.70 1.66 0.00 1.74 1.80 1.54 1.60 1.32 8 1.48 1.58 1.65 1.62 1.41 1.65 0.00 1.62 1.62 1.58 1.68 1.54 0.00 1.62 1.68 0.00 9 1.62 1.78 1.74 1.58 1.74 1.58 1.68 0.00 1.48 1.48 1.44 1.73 1.44 0.00 1.64 1.60 10 1.34 1.62 1.40 1.54 1.66 1.58 1.52 1.68 1.61 1.62 1.34 1.47 1.34 1.68 1.34 1.50 11 1.58 1.69 1.43 1.64 1.51 1.76 1.67 1.60 1.55 1.53 1.60 1.66 1.58 1.60 1.57 1.67 12 1.54 1.44 1.60 1.51 1.63 1.74 1.46 1.56 0.00 1.54 1.54 1.44 1.52 1.56 1.38 1.38 13 1.61 1.66 1.62 1.65 1.56 1.77 1.59 1.63 1.32 1.66 1.61 1.47 1.57 1.63 1.68 1.60 14 1.64 1.62 1.52 1.57 1.53 1.80 1.55 1.40 1.55 1.41 1.60 1.55 1.48 1.40 1.55 1.65 15 1.60 1.74 1.60 1.38 1.62 1.73 1.58 1.62 1.52 1.52 1.50 1.49 1.66 1.62 1.66 1.61 16 1.48 1.73 1.47 1.53 1.50 1.60 1.51 1.59 1.49 1.44 1.29 1.58 1.57 1.59 1.49 1.57 17 1.46 1.69 1.58 1.59 1.62 1.64 1.61 1.47 1.60 1.58 1.56 1.55 1.46 1.47 1.63 1.36 18 1.56 1.72 1.55 1.49 1.55 1.52 1.46 1.50 1.51 1.52 1.54 1.45 1.56 1.50 1.52 1.45 19 1.56 1.66 1.56 1.55 1.52 1.64 1.45 1.60 1.47 1.51 1.55 1.56 1.52 1.60 1.59 1.48
Table 23. νo
k for 16 left permutative span 5 maps.
Letpn(x[0,4]) denote the polynomial rule for the mapnin Table 23 and letqn(x[0,3]) denote the polynomial rule for the span 4 map
nin Table 1. Thenpn is defined bypn(x[0,4]) =x0+qn(x[1,4]).
The purpose of Table 23 is to allow a rough comparison of a sample of maps which are linear in an end variable to maps which are not (Table 23 vs. Table 1). We see no particular difference.
Table 24 gives complete cycle data for the c.a. B through shift periodk= 22. For eachk, allB-periodspof points fromPk(S2) are listed. The multiplicities given
are the numberµorb ofB-cycles inPk(S2) with the given sizep; the numberµper
of points in all these cycles; and the numberµevof points inPk(S2) with eventual
k p µorb µper µev k p µorb µper µev
1 1 1 1 2 16 1 2207 2207 2208
2 1 3 3 4 4 1 4 6192
3 1 4 4 8 120 1 120 23520
4 1 7 7 8 2688 2 5376 33616
4 1 4 8 17 1 3571 3571 3572
5 1 11 11 12 1020 1 1020 1530
15 1 15 20 2533 1 2533 119357
6 1 18 18 64 3230 1 3230 6613
7 1 29 29 30 18 1 5778 5778 5824
49 1 49 98 9 1 9 9
8 1 47 47 48 38 36 1368 3834
4 1 4 48 54 3 162 4815
120 1 120 160 108 6 648 648
9 1 76 76 80 216 6 1296 7740
9 1 9 9 296 36 10656 10656
54 3 162 423 324 2 648 228618
10 1 123 123 124 19 1 9349 9349 9350
15 1 15 40 76 1 76 76
410 1 410 860 133 2 266 14421
11 1 199 199 200 171 1 171 171
176 1 176 1848 646 1 646 2755
12 1 322 322 3692 4161 1 4161 25156
4 1 4 8 4180 1 4180 12122
56 6 336 336 13471 1 13471 460237 60 1 60 60 20 1 15127 15127 15128
13 1 521 521 522 4 1 4 8
10 13 130 650 15 1 15 1000
26 1 26 117 132 5 660 1560
143 1 143 3900 140 4 560 560
403 1 403 845 410 1 410 9420
416 1 416 2158 5240 2 10480 306300 14 1 843 843 844 20500 1 20500 197240 49 1 49 602 21240 1 21240 517360 161 2 322 2212 21 1 24476 24476 24480
448 2 896 7686 14 3 42 42
490 1 490 882 21 2 42 42
882 1 882 4158 49 1 49 98
15 1 1364 1364 1368 57 21 1197 1197
15 1 15 20 266 3 798 1949766
180 1 180 180 2618 6 15708 15708 399 5 1995 8625 4886 3 14658 14658 450 3 1350 15705 11865 1 11865 91161 530 3 1590 1590 22 1 39603 39603 39604
1095 1 1095 5280 132 2 264 264
176 1 176 910272
660 1 660 1100
[image:19.595.145.469.106.728.2]1067 2 2134 112948 14344 1 14344 924814 32428 1 32428 2205302
Table 24. Table for B = x0+x1x2 constructed from FPeriod:
For a given mapf, a given positive integerN and a given positive integermand given set of positive integersk, the program FProbPeriod will for eachkrandomly samplemblocks of lengthkon alphabet {0,1, . . . N−1}, and compute the period and preperiod underf of the pointxinPk(SN) such thatx[0, k−1] is the chosen block. Here, by definition the period pof xis the eventual period: the smallest
j >0 such that for somek≥0,fk(x) =fk+j(x). So,pis the length of thef-cycle into which x is mapped by some fk, k ≥ 0. The preperiod of x is the smallest nonnegativek such thatfk(x) isf-periodic, that is fk(x) =fk+p(x). For a given sample ofmpoints fromPk(S2), the multiplicityµofpis the number of times the
sampled point has the (eventual) periodp. In the following tables, we restrict to cellular automataf onN = 2 symbols.
k p µ k p µ k p µ
1 1 10 15 1 1 27 3402 4
2 1 10 399 3 12096 3
3 1 10 450 3 218835 2
4 1 4 530 1 242352 1
4 6 1095 2 28 882 1
5 1 4 16 120 7 32144 2
15 6 2688 3 57036 7
6 1 10 17 2533 9 29 98223 2
7 1 4 3230 1 193256 1
49 6 18 296 1 340286 3
8 1 2 324 9 504252 4
4 2 19 1 1 30 17580 1
120 6 13471 9 161721 8
9 1 2 20 5240 3 212670 1
9 1 20500 1 31 2228621 10 54 7 21240 6 32 473792 10 10 410 10 21 266 10 33 74439 7
11 1 1 22 176 2 313984 3
176 9 14344 4 34 2533 10
12 1 8 32428 4 35 1635074 6
56 2 23 1 2 4485250 1
13 1 1 622 1 14840595 3
143 3 9108 7 36 152 2
403 2 24 1 2 324 2
416 4 12432 4 22974 1
14 49 1 20256 4 1700772 1
448 7 25 61830 4 4191696 4 882 2 104425 6 37 1365226 1
26 143 1 7065594 5
[image:20.595.183.428.279.659.2]6994 9 39209196 4
Table 25. FProbPeriod output for the c.a. B=x0+x1x2on two
k p30 µ30 p10 µ10 k p30 µ30 p10 µ10 k p30 µ30 p10 µ10
1 1 30 1 10 15 1 4 23 1 1
2 1 30 1 10 180 1 622 2 622 1
3 1 30 1 10 399 10 399 6 9108 27 9108 9
4 1 13 1 5 450 8 450 1 24 1 4
4 17 4 5 530 2 184 1
5 1 12 1 4 1095 5 1095 3 2330 1 2330 1
15 18 15 6 16 1 2 7440 6 7440 1
6 1 30 1 10 4 1 12432 10 12432 5
7 1 9 1 3 120 12 120 3 20256 8 20256 3
49 21 49 7 2688 15 2688 7 25 4325 1
8 1 2 1 3 17 1 2 13015 1
4 6 4 2 2533 26 2533 9 61830 14 61830 4
120 22 120 5 3230 2 3230 1 73175 4 73175 1
9 1 3 18 1 1 54 1 104425 10 104425 5
54 27 54 10 216 2 26 6994 30 6994 10
10 1 2 296 5 27 3402 9 3402 3
15 3 1 2 324 22 324 9 12096 9 12096 3
410 25 410 8 19 4161 1 1 1 218835 10 218835 1
11 1 9 1 2 4180 2 4180 1 242352 2 242352 3
176 21 176 8 13471 27 13471 8 28 448 5
12 1 27 1 10 20 15 1 882 5 882 4
56 3 5240 5 5240 5 32144 6 32144 1
13 1 1 20500 7 20500 1 57036 14 57036 5
10 2 10 1 21240 17 21240 4 29 98223 4
143 13 143 2 21 1 1 193256 7
403 5 403 1 266 26 266 10 340286 13 340286 3
416 9 416 6 11865 3 504252 6 504252 7
14 49 2 22 176 6 176 4 30 1 1
161 4 161 3 1067 1 450 5
448 11 448 4 14344 9 1800 1 1800 1
490 1 490 1 32428 14 32428 6 127995 2
882 12 882 2 132720 1
[image:21.595.126.542.114.544.2]161721 19 161721 7 212670 1 212670 2
Table 26. Table for B=x0+x1x2 constructed as for Table 29,
for sample sizes 10 and 30 for FProbPeriod. The longest orbit lengthpfound is the same for both sample sizes, except fork= 12 andk= 21. Exact cycle data for the mapB, through shift period
k L L L L L L L L
[image:22.595.168.445.122.588.2]1 1.00 1.00 1.00 1.00 1.00 1.00 1.00 1.00 2 1.00 1.00 1.00 1.00 1.00 1.00 1.00 1.00 3 1.44 1.00 1.44 1.00 1.00 1.44 1.44 1.00 4 1.00 1.41 1.18 1.41 1.00 1.00 1.41 1.00 5 1.71 1.71 1.71 1.58 1.37 1.37 1.58 1.37 6 1.34 1.00 1.20 1.00 1.51 1.20 1.61 1.61 7 1.32 1.74 1.66 1.54 1.32 1.60 1.32 1.60 8 1.00 1.81 1.63 1.18 1.00 1.29 1.18 1.62 9 1.58 1.55 1.27 1.22 1.48 1.29 1.58 1.58 10 1.40 1.82 1.49 1.46 1.00 1.31 1.25 1.31 11 1.69 1.60 1.57 1.55 1.53 1.43 1.46 1.57 12 1.23 1.39 1.16 1.00 1.30 1.34 1.30 1.36 13 1.67 1.59 1.63 1.49 1.53 1.48 1.53 1.66 14 1.20 1.62 1.38 1.35 1.37 1.38 1.39 1.26 15 1.19 1.59 1.50 1.39 1.40 1.42 1.44 1.48 16 1.00 1.63 1.50 1.47 1.40 1.13 1.54 1.63 17 1.38 1.60 1.68 1.55 1.45 1.52 1.52 1.55 18 1.30 1.37 1.58 1.41 1.33 1.40 1.53 1.59 19 1.62 1.64 1.60 1.45 1.50 1.51 1.47 1.49 20 1.22 1.64 1.54 1.50 1.32 1.18 1.12 1.56 21 1.21 1.30 1.48 1.36 1.15 1.29 1.48 1.52 22 1.34 1.60 1.51 1.46 1.23 1.49 1.40 1.35 23 1.39 1.48 1.57 1.53 1.44 1.55 1.53 1.58 24 1.14 1.51 1.54 1.45 1.39 1.14 1.46 1.46 25 1.50 1.58 1.48 1.50 1.23 1.53 1.44 1.56 26 1.32 1.40 1.56 1.46 1.33 1.44 1.43 1.29 27 1.42 1.58 1.54 1.50 1.43 1.46 1.28 1.58 28 1.12 1.47 1.43 1.47 1.30 1.31 1.48 1.44 29 1.56 1.57 1.54 1.49 1.31 1.35 1.51 1.63 30 1.12 1.50 1.59 1.44 1.33 1.37 1.45 1.64 31 1.11 1.60 1.59 1.41 1.47 1.32 1.49 1.63 32 1.00 1.50 1.60 1.26 1.31 1.46 1.48 1.54 33 1.23 1.46 1.63 1.44 1.37 1.43 1.49 1.54 34 1.20 1.25 1.45 1.48 1.35 1.48 1.48 1.56 35 1.26 1.60 1.44 1.48 1.42 1.43 1.48 1.59 36 1.16 1.52 1.50 1.41 1.27 1.29 1.38 1.46 37 1.49 1.60 1.55 1.46 1.30 1.44 1.45 1.57
Table 27. This table is based at eachk on a random sample of 10 blocks of length k on two symbols. L is the maximum period from the sample.
A=x0+x1, linear, andB=x0+x1x2, permutative. C=B◦Brev, nonclosing, whereBrev=x0x1+x2. G=x−1+x0x1+x2, bipermutative, nonlinear.
E=B◦A, degree 2, left closing, not right closing.
J =A◦U, whereU =x0+x−2(1 +x−1)x1x2is invertible.
map A B C E G H J K
[image:23.595.151.462.117.588.2]k M1/k M1/k M1/k M1/k M1/k M1/k M1/k M1/k 1 1.00 1.00 1.00 1.00 0.00 1.00 1.00 1.00 2 1.41 1.00 1.00 1.00 1.00 1.00 1.41 1.00 3 1.00 1.25 1.00 1.25 1.25 1.00 1.00 1.25 4 1.41 1.00 1.00 1.18 1.31 1.18 1.31 1.00 5 1.00 1.00 1.00 1.00 1.31 1.24 1.14 1.00 6 1.12 1.41 1.20 1.25 1.20 1.12 1.12 1.25 7 1.00 1.21 1.16 1.10 1.34 1.16 1.32 1.25 8 1.29 1.09 1.00 1.33 1.36 1.18 1.36 1.31 9 1.00 1.25 1.25 1.27 1.19 1.24 1.24 1.24 10 1.07 1.14 1.32 1.11 1.30 1.21 1.30 1.30 11 1.00 1.44 1.23 1.26 1.28 1.25 1.25 1.42 12 1.12 1.44 1.37 1.34 1.26 1.20 1.32 1.38 13 1.00 1.34 1.27 1.32 1.21 1.25 1.23 1.41 14 1.05 1.41 1.37 1.32 1.30 1.25 1.35 1.42 15 1.00 1.39 1.37 1.30 1.26 1.34 1.32 1.41 16 1.18 1.46 1.39 1.34 1.28 1.25 1.29 1.32 17 1.00 1.47 1.34 1.33 1.28 1.26 1.26 1.41 18 1.03 1.46 1.34 1.31 1.23 1.22 1.30 1.40 19 1.00 1.44 1.34 1.32 1.25 1.34 1.32 1.42 20 1.07 1.39 1.37 1.28 1.28 1.27 1.36 1.37 21 1.00 1.46 1.41 1.36 1.33 1.35 1.33 1.48 22 1.03 1.44 1.39 1.34 1.26 1.23 1.31 1.48 23 1.00 1.47 1.40 1.33 1.29 1.34 1.31 1.44 24 1.09 1.43 1.43 1.35 1.32 1.28 1.29 1.44 25 1.00 1.44 1.41 1.33 1.30 1.27 1.30 1.47 26 1.02 1.45 1.43 1.31 1.28 1.26 1.31 1.45 27 1.00 1.45 1.43 1.33 1.31 1.37 1.37 1.45 28 1.05 1.46 1.42 1.32 1.30 1.29 1.34 1.46 29 1.00 1.42 1.41 1.31 1.31 1.33 1.32 1.44 30 1.02 1.41 1.44 1.34 1.31 1.28 1.35 1.47 31 1.00 1.44 1.43 1.38 1.30 1.36 1.34 1.45 32 1.11 1.46 1.43 1.37 1.30 1.31 1.34 1.45 33 1.00 1.46 1.42 1.35 1.27 1.34 1.33 1.46 34 1.03 1.47 1.24 1.34 1.33 1.32 1.34 1.47 35 1.00 1.45 1.56 1.37 1.31 1.34 1.37 1.46 36 1.04 1.44 1.46 1.36 1.29 1.32 1.36 1.47 37 1.01 1.47 1.46 1.35 1.32 1.34 1.35 1.46
1 1 10 12 1 10 20 3 1 30 31 1
2 1 10 13 47 6 2790 9 82531 9
3 1 10 52 4 21 573 10 31 57747 10
4 1 10 14 1 1 22 11 3 32 85 2
5 1 1 5 3 519 3 91 2
3 9 13 3 9658 4 234649 6
6 1 5 47 2 23 1499 8 33 3452570 6
3 5 49 1 9384 2 10357710 4
7 1 3 15 31 7 24 1 1 34 1717 7
5 7 145 3 35160 9 10574 1
8 1 5 16 29 1 25 20475 10 999056 2
13 5 85 9 26 441 1 35 572068 1
9 1 1 17 101 3 9401 9 2860340 1
9 9 399 7 27 4543 5 3262280 8
10 1 1 18 1 1 19710 1 36 56 2
3 7 455 9 113643 4 4095 1
5 1 19 1 1 28 5 1 729537 3
11 1 401 4 1260 9 908910 1
11 11 6 2755 3 29 277298 10 2188611 3
143 4 7125 2 37 5881335 2
[image:24.595.150.464.113.390.2]12081277 8
Table 29. This table is based at eachk on a random sample by FProbPeriod of 10 blocks of lengthkon symbols 0,1. It is a table of the resulting periodsp with multiplicitiesµ for the nonclosing map C =B◦Brev where B =x0+x1x2 and Brev =x0x1+x2.
Here, a sampled block x[0, k−1] determines a point x of period
k p µ k p µ k p µ k p µ k p µ
1 1 1 11 11 7 19 2755 3 27 113643 6 34 1717 10
2 1 1 143 3 7125 5 122661 4 35 3262280 8
3 1 7 12 1 9 7619 2 28 35 2 6886355 2
3 3 6 1 20 1395 9 180 5 36 56 2
4 1 6 13 13 2 5780 1 1260 2 504 2
2 4 52 5 21 4011 10 26124 1 729537 3
5 1 2 611 3 22 11 1 29 277298 10 2188611 3
5 3 14 7 2 878 5 30 5205 1 37 3768043 1
15 5 35 2 5709 2 137190 1 5881335 2
6 1 7 91 6 9658 2 1237965 8 12081277 7
3 3 15 87 2 23 9384 2 31 457777 1
7 7 2 465 8 34477 8 1790157 9
35 8 16 680 7 24 1 2 32 680 1
8 1 1 728 3 11720 5 728 3
4 2 17 1717 5 35160 3 267824 2 52 7 6783 5 25 4095 8 3754384 4 9 1 1 18 9 1 20475 2 33 3452570 5
9 9 56 1 26 52 2 10357710 5
[image:25.595.125.521.115.377.2]10 15 7 4095 8 122213 8 55 3
Table 30. This table is constructed just as Table 29 was, except for the following: the data is for the map D which is the mapC
1 1 30 10 17 255 30 10 36 252 30 10 2 1 30 10 18 126 30 10 37 3233097 30 10 3 1 7 3 19 9709 30 10 38 19418 30 10
3 23 7 20 30 1 1 39 4095 30 10
4 1 30 10 60 29 9 40 120 30 10
5 15 30 10 21 63 30 10 41 41943 30 10
6 1 3 0 22 682 30 10 42 126 30 10
3 9 3 23 2047 30 10 43 5461 30 10 6 18 7 24 24 30 10 44 1364 30 10 7 7 30 1 25 25575 30 10 45 4095 30 10 8 1 30 9 26 1638 30 10 46 4094 30 10 9 63 30 10 27 13797 30 10 47 8388607 30 10
10 15 1 10 28 28 30 10 48 48 30 10
30 29 10 29 475107 30 10 49 2097151 30 10 11 341 30 10 30 30 30 10
[image:26.595.144.470.113.375.2]12 12 30 10 31 31 30 10 13 819 30 10 32 1 30 10 14 14 30 10 33 1023 30 10 15 15 30 10 34 510 30 10 16 1 30 10 35 4095 30 10
Table 31. Table forA=x0+x1constructed as for Table 29, for
k Pre. k Pre. k Pre. k Pre. k Pre. k Pre. 18 0 21 216 24 394 27 2669 30 7988 33 100664
45 232 1032 3329 8537 108279
170 254 1627 5641 10545 146726
226 578 1834 9244 12479 149017
293 595 2880 9697 13204 157529
362 756 3145 11036 13676 161009
506 1174 3396 11583 16210 188071
556 1313 3905 13921 16315 196758
751 3058 5215 14745 24373 240207
102 3186 5517 23357 31106 270439
19 0 22 73 25 57 28 6000 31 4184 34 74577
9 350 404 7790 11132 80674
145 381 463 14999 16211 161429
201 522 750 18569 30108 193935
291 587 1361 23067 30661 209842
301 1163 1547 25108 32789 283852
490 1480 1671 28943 39001 360139
547 1788 2491 31291 57399 400913
658 3131 9415 37745 70339 452695
105 3247 9531 47285 99228 521740
20 0 23 0 26 428 29 2702 32 8955 35 38461
44 0 7866 9704 14007 51383
181 671 9538 10239 19792 71921
230 2543 11744 10783 48308 82039
257 2791 12056 11194 49195 122647
290 2835 13070 13472 65168 261207
445 2900 15762 19429 65824 416233
556 3123 16164 22208 72902 492662
622 6492 16999 31392 126309 529999
[image:27.595.136.479.115.494.2]755 7854 17346 31856 184781 555899
Table 32. This table is based at eachkon a random sample of 10 blocks of lengthk on symbols 0,1. It is a table of the preperiods (Pre.) seen by FProbPeriod in a sample for the mapB=x0+x1x2.
18 0 21 134 24 316 27 2016 30 1862 33 1790
15 159 969 2046 2020 6742
17 286 1012 2543 2159 8823
26 305 1027 3793 6736 19037
53 551 1541 5981 15523 19158
98 600 1954 10577 16289 19234
113 696 2800 13024 29590 33862
177 748 3054 14611 32253 56053
184 1379 3371 15185 56898 105560
198 1550 5430 17428 59246 119315
19 15 22 7 25 1215 28 982 31 2176 34 28492
35 14 1379 5042 3552 176703
48 202 3305 5438 3716 184042
49 241 3429 5783 16352 203938
108 389 3486 5890 30302 204854
119 436 3673 8235 53475 261574
211 481 3865 9723 55921 282167
264 1003 4716 10118 58664 295105
271 1119 4719 15474 60608 374994
275 1477 6056 19004 65768 384473
20 7 23 177 26 289 29 7160 32 2686 35 15491
20 198 327 8519 4683 68409
136 341 1127 9150 9120 76254
138 366 1301 16361 9808 134451
273 793 4720 16679 18985 168960
280 1036 5146 21158 19562 205781
422 1043 5817 22279 32081 223889
474 1402 8610 24581 76390 247831
478 2389 11410 25450 89515 351861
[image:28.595.136.475.112.503.2]614 2613 12155 25558 98677 385646
Table 33. This table is based at eachkon a random sample of 10 blocks of lengthk on symbols 0,1. It is a table of the preperiods (Pre.) seen by FProbPeriod in a sample for the nonclosing map
References
[Boyle-Kitchens1999] M. Boyle and B. Kitchens, Periodic points for onto cellular automata, Indag. Mathem., N.S.,10(1999), no. 4, 483-493.
[Hedlund-Appel-Welch1963] G. A. Hedlund, K. I. Appel and L. R. Welch,All onto functions of span less than or equal to five, IDA-CRD Working Paper (July, 1963), 73 pages.
Mike Boyle, Department of Mathematics, University of Maryland, College Park, MD 20742-4015, U.S.A.
E-mail address:[email protected] URL:www.math.umd.edu/∼mmb
Bryant Lee, Department of Mathematics, University of Maryland, College Park, MD 20742-4015, U.S.A.
![Table 2.26 irregular span 5 onto maps of the 2 shiftwhich fix . . . 000 . . .and are not linear in an end variable[Hedlund-Appel-Welch1963, Table XII].](https://thumb-ap.123doks.com/thumbv2/123dok/922416.902544/2.595.174.441.137.354/table-irregular-shiftwhich-linear-variable-hedlund-appel-welch.webp)
![Table 3. The map numbers refer to the 32 span 4 maps of Tableand1. Table 3 shows for the given sample of maps, and for m = 10 m = 13, for which k in the range [m, 24] the jointly periodicpoints in Pk(S2) are m-dense](https://thumb-ap.123doks.com/thumbv2/123dok/922416.902544/3.595.156.457.130.354/table-numbers-tableand-table-sample-range-jointly-periodicpoints.webp)